Emtia Kanal Endeksi (CCI)

CCI Stochastic and a quick lesson on Scalping & Trading SystemsHello traders
Still on holidays but I don't and will never forget you <3
I realize more and more that you guys don't only want some indicators and learn about pinescript. You also want some guidance and get some mentors providing you with comprehensive and simple trading methods and tricks.
I'm against those posting many scripts a day that in the end will make you lose your money because they don't give you the methodology to use them
It might look nice on the charts but we're not here to do some painting.... but to improve our lifestyle right :)
The today indicator is based on an indicator that I used for scalping : Fxcodebase CCI Stochastic
A CCI stochastic is very reactive and allows us to take many scalps trades per day with a few pips/USD gain for each trade. I don't recommend novice traders to use it and I strongly recommend everyone reading my disclaimer below basically saying "I'm not a financial advisor, don't be dumb, stay safe"
(I also recommend the few scripts copy-pasters to read my disclaimer as well)
What's a novice trader, sir? Well... thanks for asking. A novice trader is any trader with less than 5 years of live trading experience
From a pinescript perspective, this script will be however interesting for everyone :)
How to use it?
The indicator gives 3 possible entries for Longs and Shorts:
- Arrows at Enter - Will give signals whenever the Stoch CCI will enter in the BUY/SELL zone
- Arrows at Exit - Will give signals whenever the Stoch CCI will exit the BUY/SELL zone
- Arrows at Center - Signals whenever the Stoch CCI will cross the mid-line (50)
All arrows have different colors because ... painting is cool and nice.... kidding.... it gives clearer and more readable signals on the chart (but painting sir...)
A possible trading method could be to use the 3 modes at the same time to get the maximum of opportunities.
The safer bet is to use the "Arrows at Exit" only mode but for those who want to accumulate more scalping positions, adding the "Arrows at Enter" mode is an option as well. In other words, you accumulate a few scalping positions whenever the Stoch CCI get in the BUY/SELL zone and will stop accumulating whenever it will exit the BUY/SELL zone
You can add a few extra positions whenever the Stoch CCI will cross the mid-line as it often translates in a trend continuation
Life hack
Very important note : (probably the most important gem I shared until now) The inputs set by default will have to be changed for your asset/timeframe and can't be generic for everything. You have to play with the inputs until the signals will make sense to you
The indicator/strategy with a unique configuration that you'll never check or update according to the market condition DOES NOT exit.
If you find such a tool and prove me that you're making constant gains with it over a year, please patent it and then show it to me as I'd like to study it to replicate :) But most likely this is a myth/unicorn
Who I am to say this? Well, I worked in a Bank with real traders and I have a good sense of what works and what will certainly not work
My guru said scalping crypto in 1 second timeframe was the way to get rich quick. Do you agree sir?
But in trading, this is not because you take the maximum of trades possible that your gains will increase. This is the contrary.
There is a strong and proven inverse correlation between the number of trades taken and how fast you'll burn your capital. A swing trader taking 2/3 trades a month is more likely to beat 99% of the scalpers out there trying to predict all market movements. (and I'm not even talking about how dangerous it is to scalp with leverage)
You're starting to know me a bit more right now. I prefer to tell you what you need to hear vs what you want to hear because the second option doesn't allow to stay in the game very long.
I might lose some futures clients along the way by saying that but for my own conscience and ethics, I prefer to warn about the true risks of trading and to select who you listen very carefully (the advice also works for me, if you feel what I said doesn't make sense, this is totally your right but I hope this is because I'm french and not because of the content ^^).
See you tomorrow for another indicator or idea
Love you all
Dave
____________________________________________________________
Be sure to hit the thumbs up. Building those indicators take a lot of time and likes are always rewarding for me :) (tips are accepted too)
- If you want to suggest some indicators that I can develop and share with the community, please use my personal TRELLO board
- I'm an officially approved PineEditor/LUA/MT4 approved mentor on codementor. You can request a coaching with me if you want and I'll teach you how to build kick-ass indicators and strategies
Jump on a 1 to 1 coaching with me
- You can also hire for a custom dev of your indicator/strategy/bot/chrome extension/python
Disclaimer:
Trading involves a high level of financial risk, and may not be appropriate because you may experience losses greater than your deposit. Leverage can be against you.
Do not trade with capital that you can not afford to lose. You must be aware and have a complete understanding of all the risks associated with the market and trading. We can not be held responsible for any loss you incur.
Trading also involves risks of gambling addiction.
Please notice I do not provide financial advice - my indicators, strategies, educational ideas are intended to provide only some source code for anyone interested in improving their trading
The proprietary indicators and strategies developed by Best Trading Indicator, the object of intellectual property rights are and remain the exclusive property of Best Trading Indicator, at the exclusion of images and videos and texts free of rights or provided by the Company or external legal or physical person.
No assignment of intellectual property rights is carried out through these Terms and Conditions.
Any total or partial reproduction, modification or use of these properties for any reason whatsoever is strictly prohibited without the express written authorization of the Company.

HA_CCI Long onlyStratégie calculée sur le croisement d'in CCI lent et d'un CCI Rapide
Le CCI est calculé sur la cloture de bougie henki hashi

CCI Fish netThis chart uses cci from 10 days to 200 days.
Green means cci10 is greater than cci200, red means opposite.
Enjoy!

CCI by Minh DucCommodity Channel Index by Minh Duc
- Fast Line Cross
- Master Trendline
Use for all time frame.
Price: 50$ for a month with user guide trading system.
Contact me: Telegram @minhduc1712


PriceDivergence (ps4)This script implements price divergence module using signals from several factors like:
RSI, RSI Stochastic, MACD, Volume MA, Accumulation/Distribution, Fisher Transform and CCI

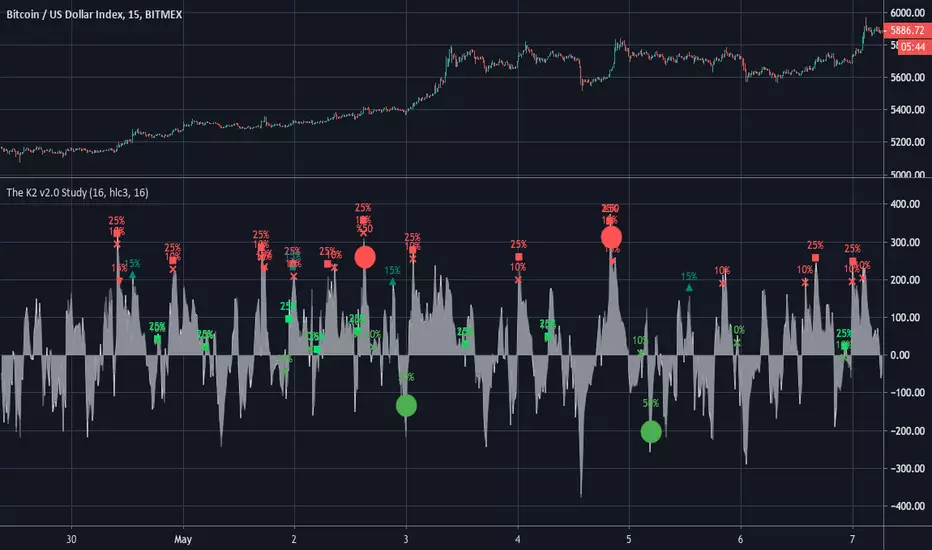
The K2 v2.0 StudySTUDY VERSION:
The updated version of THE K2 is finally here! A lot of changes were made when creating the second version of the K2, but the result was a much higher level of performance.
The new K2 consists of a 1 minute 'fast' CCI and 15 minute slow CCI . We identified key thresholds for each one to construct a more complex trading approach. The green shapes on the chart represent buy signals and the red shapes are sell signals. The text above them is the percentage of equity used in each trade. These percentages are based on the CCI's position relative to the fixed thresholds. By doing this, the strategy achieves a higher frequency of trades and lower max drawdown.
Here's a guide to help understand the various shapes:
Circles: Slow CCI trades using 50% equity.
Squares: 25%
Triangles: 15%
Crosses(X's): 10%
We will update the user guide on our website(ProfitProgrammers.com) to include an in-depth guide to using the new K2.
The results displayed on the chart are the results for the month of April. As always, the K2 strategy comes with its study equivalent(at no extra cost).
If you're interested in the K2, message us for a free 3 day trial!
This study can also be updated for fully automated trading.
All of our invite only studies and strategies can be found on our website ProfitProgrammers.com
The K2 v2.0 StrategyThe updated version of THE K2 is finally here! A lot of changes were made when creating the second version of the K2, but the result was a much higher level of performance.
The new K2 consists of a 1 minute 'fast' CCI and 15 minute slow CCI. We identified key thresholds for each one to construct a more complex trading approach. The green shapes on the chart represent buy signals and the red shapes are sell signals. The text above them is the percentage of equity used in each trade. These percentages are based on the CCI's position relative to the fixed thresholds. By doing this, the strategy achieves a higher frequency of trades and lower max drawdown.
Here's a guide to help understand the various shapes:
Circles: Slow CCI trades using 50% equity.
Squares: 25%
Triangles: 15%
Crosses(X's): 10%
We will update the user guide on our website(ProfitProgrammers.com) to include an in-depth guide to using the new K2.
The results displayed on the chart are the results for the month of April. As always, the K2 strategy comes with its study equivalent(at no extra cost).
If you're interested in the K2, message us for a free 3 day trial!
All of our invite only studies and strategies can be found on our website ProfitProgrammers.com


Combo Strategy 123 Reversal & CCI This is combo strategies for get a cumulative signal.
First strategy
This System was created from the Book "How I Tripled My Money In The
Futures Market" by Ulf Jensen, Page 183. This is reverse type of strategies.
The strategy buys at market, if close price is higher than the previous close
during 2 days and the meaning of 9-days Stochastic Slow Oscillator is lower than 50.
The strategy sells at market, if close price is lower than the previous close price
during 2 days and the meaning of 9-days Stochastic Fast Oscillator is higher than 50.
Second strategy
The Commodity Channel Index (CCI) is best used with markets that display cyclical or
seasonal characteristics, and is formulated to detect the beginning and ending of these
cycles by incorporating a moving average together with a divisor that reflects both possible
and actual trading ranges. The final index measures the deviation from normal, which indicates
major changes in market trend.
To put it simply, the Commodity Channel Index (CCI) value shows how the instrument is trading
relative to its mean (average) price. When the CCI value is high, it means that the prices are
high compared to the average price; when the CCI value is down, it means that the prices are low
compared to the average price. The CCI value usually does not fall outside the -300 to 300 range
and, in fact, is usually in the -100 to 100 range.
WARNING:
- For purpose educate only
- This script to change bars colors.

The K2 StrategyStrategy version of the K2 Indicator. The K2 uses a fast and slow CCI to identify optimal long entry and exit opportunities.


Enhanced Commodity Channel Index(CCI) Cycle Indicator - MTFThis is a heavily modified and enhanced version of CCI Cycle and my first indicator released using Pine Script version 4.0, something I contributed to often in a small role, and will continue to do, in my free time. This indicator is highly reactive and does a magnificent job of identifying fluctuations in market cycles when they are not trending. Compared to my free "Enhanced Schaff Trend Cycle Indicator" presented above along side this indicator, CCI Cycle is superior in it's own way, but a superb companion for providing a more accurate signals analysis. I packed as much tech as I could into this indicator along with astounding color and agility, and I'm unsure if there is any room for major improvements in the near future.
Features List Includes:
I.P.O.C.S.(Initial Public Offering Clean Start) Technology - plotting from day one, minute one of IPO
Fully adjustable M.T.F. ( Multiple Time Frame ) is enable/disable capable
Enable/disable dark background for enhanced visibility
"Source" Selection
Multiple CCI Cycle adjustments
Moving average selection
Ranges and thresholds are enable/disable capable
Upper threshold adjustment
Red/green secondary range that adjusts +/- from the upper/lower thresholds
Lower threshold adjustment
Adjustable centered medial zone
Highlighting is enable/disable capable
Normalized zero mean to +/-1
This is not a freely available indicator, FYI. To witness my Pine poetry in action, properly negotiated requests for unlimited access, per indicator, may ONLY be obtained by direct contact with me using TV's "Private Chats" or by "Message" in my member name above. The comments section below is solely just for commenting and other remarks, ideas, compliments, etc... If you do have any questions or comments regarding this indicator, I will consider your inquiries, thoughts, and ideas presented below in the comments section, when time provides it. As always, "Like" it if you like it, and also return to my scripts list occasionally for additional postings. Have a profitable future everyone!

Woodies CCX Vol Weighted + CZ + SW indicatorsVersion of Woodies CCX that takes in account volume (uses Vol Weighted JMA). All credits for the original code go to @4alphabsolute
