AI Market Barometer ProAI Market Barometer Pro - Professional Trading Indicator
Overview
AI Market Barometer Pro is an advanced multi-timeframe trading system that combines artificial intelligence algorithms with proprietary technical analysis to deliver high-confidence trading signals. This professional-grade indicator analyzes market conditions across multiple timeframes simultaneously, providing traders with clear directional bias and signal strength ratings.
Core Features
🎯 Core AI Barometer System
- Multi-Timeframe Analysis: Monitors different timeframes simultaneously
- AI Confidence Score: Proprietary algorithm calculates signal confidence from 0-100%
- Three-Level Signal Strength: Basic, Medium ★, and Strong ★★ signals
- Dynamic Background Coloring: Visual market sentiment at a glance
- Real-Time Information Panel: Customizable position with live market metrics
⚡ Three AI Accelerator Systems
- Accelerator 1: Original multi-timeframe momentum system with 27 dimensions
- Accelerator 2: Five-star selection algorithm with 32 AI parameters
- Accelerator 3:
- Each accelerator provides independent AI support lines and signal zones
- Highly selective signals ensuring maximum accuracy
📊 Advanced Visualization
- Color-Coded Signals:
- Green zones indicate bullish conditions
- Red zones indicate bearish conditions
- Gray indicates neutral/ranging markets
- Smart Labels: Auto-positioned signal labels displaying confidence percentages
- Background Intensity: Three levels showing signal strength
- Customizable Display: Adjustable panel position and visibility options
Configuration Options
Display Settings
- Panel Position: 9 position options (corners, edges, center)
- Show Labels: Toggle signal labels on/off
- Show Background Color: Toggle background coloring on/off
- Show Info Panel: Toggle real-time information table on/off
- Background Display Days: Control how many days of coloring to display (1-30 days)
Channel Settings
- Enable Channel: Optional channel
- Channel Width: Adjustable deviation multiplier
Accelerator Settings
- Enable Accelerator 1: Original accelerator system
- Enable Accelerator 2: Five-star selection system
- Enable Accelerator 3: Advanced buy filtering system
- Each can be toggled independently
Alert System
Pre-configured alerts include:
- AI Long Signal activation
- AI Short Signal activation
- AI Ranging Signal activation
- Accelerator 1 Bull/Bear zones
- Accelerator 2 Bull/Bear zones
- Accelerator 3 Bull/Bear zones
Information Panel Metrics
Real-time display includes:
- Current Timeframe
- Active Signal (Long/Short/Ranging)
- AI Confidence Percentage
- Current Price
- Change Percentage
- Momentum Status (Bullish/Bearish/Mixed)
- Signal Strength Rating
Recommended Timeframes
- Scalping: 1-minute charts
- Day Trading: 5-minute, 15-minute charts
- Swing Trading: 1-hour, 4-hour, Daily charts
- Position Trading: Daily, Weekly charts
Technical Requirements
- TradingView Pro, Pro+, or Premium account (required for multi-timeframe functionality)
- Compatible with all markets: Forex, Crypto, Stocks, Indices, Commodities
- Works on all timeframes from 1-minute to Monthly
Disclaimer
This indicator is a tool to assist with trading decisions. Past performance does not guarantee future results. Trading involves substantial risk of loss. Always use proper risk management and never risk more than you can afford to lose. The AI algorithms and confidence scores are based on historical price patterns and technical analysis, not predictive guarantees.
What Makes This Different?
Unlike simple trading systems, AI Market Barometer Pro:
- ✅ Analyzes multiple timeframes simultaneously
- ✅ Calculates dynamic confidence scores
- ✅ Provides three-tier signal strength ratings
- ✅ Includes three independent accelerator systems
- ✅ Delivers highly selective, low-noise signals
- ✅ Features professional-grade visualization
- ✅ Adapts to all market conditions
Join thousands of traders using AI-powered analysis to gain their edge in the markets.
🌤️ Perfect Companion Indicator
Enhance your trading with AI Market Weather Forecast Pro
Transform complex market analysis into intuitive weather forecasts. Get instant market temperature readings from -50°C to +50°C and know whether you're trading in a heatwave or a blizzard.
Why use them together:
Barometer → Precise entry/exit signals with AI confidence scores
Weather → Overall market climate and trend temperature
Combined → Complete market picture for optimal timing
👉 Get AI Market Weather Forecast Pro
Know the market climate before you trade. Two indicators, one complete trading system.
© 2024 AI Market Barometer Pro. All rights reserved. Proprietary algorithms and methodologies protected.
Grafik Desenleri

Gann Levels by Acharya JiThis Pine Script indicator is designed to help traders quickly identify **key intraday levels** based on the **first candle of the trading day**. It performs three main functions:
1. **Marks the First Candle’s High and Low**
- Blue circles are plotted at the high and low of the first candle each day.
- These serve as the baseline reference points for calculating targets.
2. **Plots Upside Targets (Green Lines)**
- Six horizontal green lines are drawn above the first candle’s high.
- Each line represents a percentage increment: **+0.09%, +0.18%, +0.36%, +0.72%, +1.44%, +2.88%**.
- These levels act as potential resistance or profit-taking zones.
3. **Plots Downside Targets (Red Lines)**
- Six horizontal red lines are drawn below the first candle’s low.
- Each line represents a percentage decrement: **-0.09%, -0.18%, -0.36%, -0.72%, -1.44%, -2.88%**.
- These levels act as potential support or stop-loss zones.
---
Purpose
- Provides a **structured intraday roadmap** based on the first candle.
- Helps traders visualize **target ladders** both above and below the market.
- Useful for scalpers, intraday traders, and strategy testing around **breakouts or reversals**.
---
👉 Rahul, would you like me to also add **labels (like +0.09%, -0.18%)** directly on the chart next to each line so you can instantly recognize which target level is which without checking the legend?

DENIES KRESNA SANTA FOOTSTEPOne very cold night, Santa was counting the good deeds of the children in each house to give them Christmas presents.
The children in the town were curious about which house would receive the gift. But the children could guess where Santa would deliver the gift based on several indications.
Footstep: Santa was delighted to find a good child's house, jumping high to show his joy, leaving footprints on the roof.
Starlight: The presence of starlight indicated that Santa's jump was so high that it tore through the clouds, allowing light to penetrate the town.
Dwarf: Children in their sleep heard the little noisy voices of the dwarfs, who sometimes came out with Santa.
And the children hoped that one day, Santa would return, leaving the most beautiful Christmas gift, and jump high again, filled with joy...

DENIES KRESNA UFO ENGULFhelping me to choose engulf area
This script help me as snipper indicator to choose where is untouch engulf area yet.

SekakitaMoneyZone本インジケーターは、製作者Sekakitaが実際のトレードで使用している
「相場の波形(Wave Structure)」に基づき、利確候補(TP)を見極めることを目的として開発されました。
相場の流れを視覚的に捉えることで、無駄なエントリーや早すぎる決済を防ぎ、再現性の高いトレード判断を可能にします。
This indicator is developed based on the wave patterns essential to Sekakita’s trading strategy, with the primary goal of identifying potential take-profit (TP) areas.
By visualizing market wave structures in real time, it enables more consistent and disciplined trade management.
OCC Strategy Optimized (MA 5 + Delayed TSL)# OCC Strategy Optimized (MA 5 + Delayed TSL) - User Guide
## Introduction
The **OCC Strategy Optimized** is an enhanced version of the classic **Open Close Cross (OCC)** strategy. This strategy is designed for high-precision trend following, utilizing the crossover logic of Open and Close moving averages to identify market shifts. This optimized version incorporates advanced risk management, multi-timeframe analysis, and a variety of moving average types to provide a robust trading solution for modern markets.
>
> **Special Thanks:** This strategy is based on the original work of **JustUncleL**, a renowned Pine Script developer. You can find their work and profile on TradingView here: (in.tradingview.com).
---
## Key Features
### 1. Optimized Core Logic
- **MA Period (Default: 5):** The strategy is tuned with a shorter MA length to reduce lag and capture trends earlier.
- **Crossing Logic:** Signals are generated when the Moving Average of the **Close** crosses the Moving Average of the **Open**.
### 2. Multi-Timeframe (MTF) Analysis
- **Alternate Resolution:** Use a higher timeframe (Resolution Multiplier) to filter out noise. By default, it uses $3 \times$ your current chart timeframe to confirm the trend.
- **Non-Repainting:** Includes an optional delay offset to ensure signals are confirmed and do not disappear (repaint) after the bar closes.
### 3. Advanced Risk Management
This script features a hierarchical exit system to protect your capital and lock in profits:
- **Fixed Stop Loss (Initial):** Protects against sudden market reversals immediately after entry.
- **Delayed Trailing Stop Loss (TSL):**
- **Activation Delay:** The TSL only activates after the trade reaches a specific profit threshold (e.g., 1%). This prevents being stopped out too early in the trade's development.
- **Ratchet Trail:** Once activated, the stop loss "ratchets" up/down, never moving backward, ensuring you lock in profits as the trend continues.
- **Take Profit (TP):** A fixed percentage target to exit the trade at a pre-defined profit level.
### 4. Versatility
- **12 MA Types:** Choose from SMA, EMA, DEMA, TEMA, WMA, VWMA, SMMA, HullMA, LSMA, ALMA, SSMA, and TMA.
- **Trade Direction:** Toggle between Long-only, Short-only, or Both.
- **Visuals:** Optional bar coloring to visualize the trend directly on the candlesticks.
---
## User Input Guide
### Core Settings
- **Use Alternate Resolution?:** Enable this to use the MTF logic.
- **Multiplier for Alternate Resolution:** How many charts higher the "filter" timeframe should be.
- **MA Type:** Select your preferred moving average smoothing method.
- **MA Period:** The length of the Open/Close averages.
- **Delay Open/Close MA:** Use `1` or higher to force non-repainting behavior.
### Risk Management Settings
- **Use Trailing Stop Loss?:** Enables the TSL system.
- **Trailing Stop %:** The distance the stop follows behind the price (Optimized Default: 1.5%).
- **TSL Activation % (Delay):** The profit % required before the TSL starts moving. (Optimized Default: 2.0% to ensure 0.5% profit is locked immediately).
- **Initial Fixed Stop Loss %:** Your hard stop if the trade immediately goes against you.
- **Take Profit %:** Your ultimate profit target for the trade.
---
## How to Trade with This Strategy
1. **Identify the Trend:** Look for the Moving Average lines (Close vs Open) to cross.
2. **Wait for Confirmation:** If using MTF, ensure the higher timeframe also shows a trend change.
3. **Manage the Trade:** Let the TSL work. With the default **2.0% Activation** and **1.5% Trail**, the strategy will automatically lock in **0.5% profit** the moment the threshold is hit, then follow the price higher.
4. **Position Sizing:** Adjust the `Properties` tab in the script settings to match your desired capital allocation (Default is 10% of equity).
---
## Recommended Settings
1. Trialing < Activation
2. Check ranging
## Credits
Original Strategy by: **JustUncleL**
Optimized and Enhanced by: **Antigravity AI**

Sessions + EMAS + Nube (Mini Table)This indicator is designed to help traders analyze market trends and identify potential trading opportunities.
It provides clear visual signals based on price behavior and technical calculations, allowing traders to better understand market structure, momentum, and direction.
The indicator can be used on any market and timeframe, making it suitable for both intraday and swing trading.
It is intended as a decision-support tool and should be used in combination with proper risk management and other forms of analysis.

ENTRY SL TARGETS]Entry sl target use 3 min time frame intraday use only,long and short trades can do with sl

WaveTrend Strategy [Long + Flex Exit]wavetrend strategy
enter long when oversold.
close position when profit reaches certain value or overbought

Muros Multi-TF Pro Dashboard v2fwrvw w fw wf fs rf wf wf jni hb hu huhb yhi ib i ibb uoobu ic biicb ibc bic k

ES Multi-Timeframe SMC Entry SystemOverviewThis is a comprehensive Smart Money Concepts (SMC) trading strategy for ES1! (E-mini S&P 500) futures that provides simultaneous buy and sell signals across three timeframes: Daily, Weekly, and Monthly. It incorporates your complete entry checklists, confluence scoring system, and automated risk management.Core Features1. Multi-Timeframe Signal Generation
Daily Signals (D) - For intraday/swing trades (1-3 day holds)
Weekly Signals (W) - For swing trades (3-10 day holds)
Monthly Signals (M) - For position trades (weeks to months)
All three timeframes can trigger simultaneously (pyramiding enabled)
2. Smart Money Concepts ImplementationOrder Blocks (OB)
Automatically detects bullish and bearish order blocks
Bullish OB = Down candle before strong impulse up
Bearish OB = Up candle before strong impulse down
Validates freshness (< 10 bars = higher quality)
Visual boxes displayed on chart
Fair Value Gaps (FVG)
Identifies 3-candle imbalance patterns
Bullish FVG = Gap between high and current low
Bearish FVG = Gap between low and current high
Tracks unfilled gaps as targets/entry zones
Auto-removes when filled
Premium/Discount Zones
Calculates 50-period swing range
Premium = Upper 50% (short from here)
Discount = Lower 50% (long from here)
Deep zones (<30% or >70%) for higher quality setups
Visual shading: Red = Premium, Green = Discount
Liquidity Sweeps
Sell-Side Sweep (SSL) = False break below lows → reversal up
Buy-Side Sweep (BSL) = False break above highs → reversal down
Marked with yellow labels on chart
Valid for 10 bars after occurrence
Break of Structure (BOS)
Identifies when price breaks recent swing high/low
Confirms trend continuation
Marked with small circles on chart
3. Confluence Scoring SystemEach timeframe has a 10-point scoring system based on your checklist requirements:Daily Score (10 points max)
HTF Trend Alignment (2 pts) - 4H and Daily EMAs aligned
SMC Structure (2 pts) - OB in correct zone with HTF bias
Liquidity Sweep (1 pt) - Recent SSL/BSL occurred
Volume Confirmation (1 pt) - Volume > 1.2x 20-period average
Optimal Time (1 pt) - 9:30-12 PM or 2-4 PM ET (avoids lunch)
Risk-Reward >2:1 (1 pt) - Built into exit strategy
Clean Price Action (1 pt) - BOS occurred
FVG Present (1 pt) - Near unfilled fair value gap
Minimum Required: 6/10 (adjustable)Weekly Score (10 points max)
Weekly/Monthly Alignment (2 pts) - W and M EMAs aligned
Daily/Weekly Alignment (2 pts) - D and W trends match
Premium/Discount Correct (2 pts) - Deep zone + trend alignment
Major Liquidity Event (1 pt) - SSL/BSL sweep
Order Block Present (1 pt) - Valid OB detected
Risk-Reward >3:1 (1 pt) - Built into exit
Fresh Order Block (1 pt) - OB < 10 bars old
Minimum Required: 7/10 (adjustable)Monthly Score (10 points max)
Monthly/Weekly Alignment (2 pts) - M and W trends match
Weekly OB in Monthly Zone (2 pts) - OB in deep discount/premium
Major Liquidity Sweep (2 pts) - Significant SSL/BSL
Strong Trend Alignment (2 pts) - D, W, M all aligned
Risk-Reward >4:1 (1 pt) - Built into exit
Extreme Zone (1 pt) - Price <20% or >80% of range
Minimum Required: 8/10 (adjustable)4. Entry ConditionsDaily Long Entry
✅ Daily score ≥ 6/10
✅ 4H trend bullish (price > EMAs)
✅ Price in discount zone
✅ Bullish OB OR SSL sweep OR near bullish FVG
✅ NOT during avoid times (lunch/first 5 min)Daily Short Entry
✅ Daily score ≥ 6/10
✅ 4H trend bearish
✅ Price in premium zone
✅ Bearish OB OR BSL sweep OR near bearish FVG
✅ NOT during avoid timesWeekly Long Entry
✅ Weekly score ≥ 7/10
✅ Weekly trend bullish
✅ Daily trend bullish
✅ Price in discount
✅ Bullish OB OR SSL sweepWeekly Short Entry
✅ Weekly score ≥ 7/10
✅ Weekly trend bearish
✅ Daily trend bearish
✅ Price in premium
✅ Bearish OB OR BSL sweepMonthly Long Entry
✅ Monthly score ≥ 8/10
✅ Monthly trend bullish
✅ Weekly trend bullish
✅ Price in DEEP discount (<30%)
✅ Bullish order block presentMonthly Short Entry
✅ Monthly score ≥ 8/10
✅ Monthly trend bearish
✅ Weekly trend bearish
✅ Price in DEEP premium (>70%)
✅ Bearish order block present5. Automated Risk ManagementPosition Sizing (Per Entry)
Daily: 1.0% account risk per trade
Weekly: 0.75% account risk per trade
Monthly: 0.5% account risk per trade
Formula:
Contracts = (Account Equity × Risk%) ÷ (Stop Points × $50)
Minimum = 1 contractStop Losses
Daily: 12 points ($600 per contract)
Weekly: 40 points ($2,000 per contract)
Monthly: 100 points ($5,000 per contract)
Profit Targets (Risk:Reward)
Daily: 2:1 = 24 points ($1,200 profit)
Weekly: 3:1 = 120 points ($6,000 profit)
Monthly: 4:1 = 400 points ($20,000 profit)
Example with $50,000 AccountDaily Trade:
Risk = $500 (1% of $50k)
Stop = 12 points × $50 = $600
Contracts = $500 ÷ $600 = 0.83 → 1 contract
Target = 24 points = $1,200 profit
Weekly Trade:
Risk = $375 (0.75% of $50k)
Stop = 40 points × $50 = $2,000
Contracts = $375 ÷ $2,000 = 0.18 → 1 contract
Target = 120 points = $6,000 profit
Monthly Trade:
Risk = $250 (0.5% of $50k)
Stop = 100 points × $50 = $5,000
Contracts = $250 ÷ $5,000 = 0.05 → 1 contract
Target = 400 points = $20,000 profit
6. Visual Elements on ChartKey Levels
Previous Daily High/Low - Red/Green solid lines
Previous Weekly High/Low - Red/Green circles
Previous Monthly High/Low - Red/Green crosses
Equilibrium Line - White dotted line (50% of range)
Zones
Premium Zone - Light red shading (upper 50%)
Discount Zone - Light green shading (lower 50%)
SMC Markings
Bullish Order Blocks - Green boxes with "Bull OB" label
Bearish Order Blocks - Red boxes with "Bear OB" label
Bullish FVGs - Green boxes with "FVG↑"
Bearish FVGs - Red boxes with "FVG↓"
Liquidity Sweeps - Yellow "SSL" (down) or "BSL" (up) labels
Break of Structure - Small lime/red circles
Entry Signals
Daily Long - Small lime triangle ▲ with "D" below price
Daily Short - Small red triangle ▼ with "D" above price
Weekly Long - Medium green triangle ▲ with "W" below price
Weekly Short - Medium maroon triangle ▼ with "W" above price
Monthly Long - Large aqua triangle ▲ with "M" below price
Monthly Short - Large fuchsia triangle ▼ with "M" above price
7. Information TablesConfluence Score Table (Top Right)
┌──────────┬────────┬────────┬────────┐
│ TF │ SCORE │ STATUS │ SIGNAL │
├──────────┼────────┼────────┼────────┤
│ 📊 DAILY │ 7/10 │ ✓ PASS │ 🔼 │
│ 📈 WEEKLY│ 6/10 │ ✗ WAIT │ ━ │
│ 🌙 MONTH │ 9/10 │ ✓ PASS │ 🔽 │
├──────────┴────────┴────────┴────────┤
│ P&L: $2,450 │
└─────────────────────────────────────┘
Green scores = Pass (meets minimum threshold)
Orange/Red scores = Fail (wait for better setup)
🔼 = Long signal active
🔽 = Short signal active
━ = No signal
Entry Checklist Table (Bottom Right)
┌──────────────┬───┐
│ CHECKLIST │ ✓ │
├──────────────┼───┤
│ ━ DAILY ━ │ │
│ HTF Trend │ ✓ │
│ Zone │ ✓ │
│ OB │ ✗ │
│ Liq Sweep │ ✓ │
│ Volume │ ✓ │
│ ━ WEEKLY ━ │ │
│ W/M Align │ ✓ │
│ Deep Zone │ ✗ │
│ ━ MONTHLY ━ │ │
│ M/W/D Align │ ✓ │
│ Zone: Discount│ │
└──────────────┴───┘
Green ✓ = Condition met
Red ✗ = Condition not met
Real-time updates as market conditions change
8. Alert SystemIndividual Alerts:
"Daily Long" - Triggers when daily long setup appears
"Daily Short" - Triggers when daily short setup appears
"Weekly Long" - Triggers when weekly long setup appears
"Weekly Short" - Triggers when weekly short setup appears
"Monthly Long" - Triggers when monthly long setup appears
"Monthly Short" - Triggers when monthly short setup appears
Combined Alerts:
"Any Long Signal" - Catches any bullish opportunity (D/W/M)
"Any Short Signal" - Catches any bearish opportunity (D/W/M)
Alert Messages Include:
🔼/🔽 Direction indicator
Timeframe (DAILY/WEEKLY/MONTHLY)
Current confluence score

ATR + Moving AverageThis indicator shows a manually calculated Average True Range (ATR) along with a moving average of the ATR.
The ATR measures current candle volatility.
The ATR Moving Average shows the average candle size over the selected period.
Both can use different smoothing types (RMA, SMA, EMA, WMA) for flexibility.
It’s useful for seeing when price is stretched, volatility is expanding or contracting, and for higher-timeframe mean-reversion analysis.

Hardwaybets Strat Market Checklist Trading## **Hardwaybets TheStrat Market Checklist Engine**
**A Checklist-Driven TheStrat Trading**
---
### **Overview**
This script is an **informational market context and permission framework** designed to help users **organize structural and liquidity information** in a clear, checklist-based format.
It evaluates **price context only** and displays the results in a table.
It does **not** generate trade signals or trading instructions.
---
### **What This Script Does**
The indicator evaluates and displays:
* Nearest prior **Area of Interest (AOI)**
(Previous Day High/Low or Previous Week High/Low)
* Higher-timeframe structural bias (Daily & Weekly)
* Proximity to liquidity
* Liquidity behavior (acceptance vs rejection)
* **Strat pattern classification only** (12 canonical patterns)
* A final **permission state** based on the above conditions
All information is presented as **contextual reference data**, not execution guidance.
---
### **What This Script Does NOT Do**
* ❌ No buy or sell signals
* ❌ No arrows, markers, or execution prompts
* ❌ No entries, exits, stops, or targets
* ❌ No performance metrics or profitability claims
* ❌ No strategy or backtesting logic
The word **“TRADE”** in the dashboard refers to **permission status only**, not a recommendation to trade.
---
### **Dashboard Modes**
* **Full Mode**: displays AOI price and distance (points & ticks)
* **Compact Mode**: minimal checklist view for reduced screen usage
Both modes are **informational only**.
---
### **Pattern Classification**
The script identifies and labels Strat candle pattern **types only**, including:
* Reversal patterns
* Continuation patterns
* Compression patterns
* Expansion patterns
Pattern labels are **descriptive classifications**, not signals or instructions.
---
### **Intended Use**
This script is intended to be used as a **contextual reference tool** alongside a user’s own analysis, rules, or education.
It may be useful for:
* Market structure study
* Liquidity behavior observation
* Pattern classification review
* Educational purposes
---
### **Technical Notes**
* Pine Script® v6
* Uses completed candles only
* No repainting logic
* No future data access
* Table-based UI only
---
### **Disclaimer**
This indicator is provided **for educational and informational purposes only**.
The author does not provide financial advice, trading recommendations, or execution guidance.
All trading decisions remain the sole responsibility of the user.
---
### **Conceptual Attribution**
This script is inspired by publicly available market structure concepts commonly referred to as “The Strat” methodology.
No proprietary or paid content is included.
---
### **Feedback**
Constructive feedback and suggestions are welcome.
Please note that this script is intentionally **non-signaling by design**.

ORB 5 Min Break & Retest + Alerts By KhanORB 5-Minute Break & Retest Indicator
This indicator plots the high and low of the first 5-minute candle of the trading session (Opening Range). It then monitors price for a breakout above or below the ORB levels and triggers an alert when price retests the broken level and holds.
Designed to help identify high-probability ORB continuation setups with clear visual levels and TradingView alerts.
If you want, I can also:
Make it even shorter (1–2 lines)
Write a more detailed TradingView public script description
Add a usage guide (rules + best timeframe)
Disclaimer:
This is general information only and not financial advice. For personal guidance, please talk to a licensed professional.

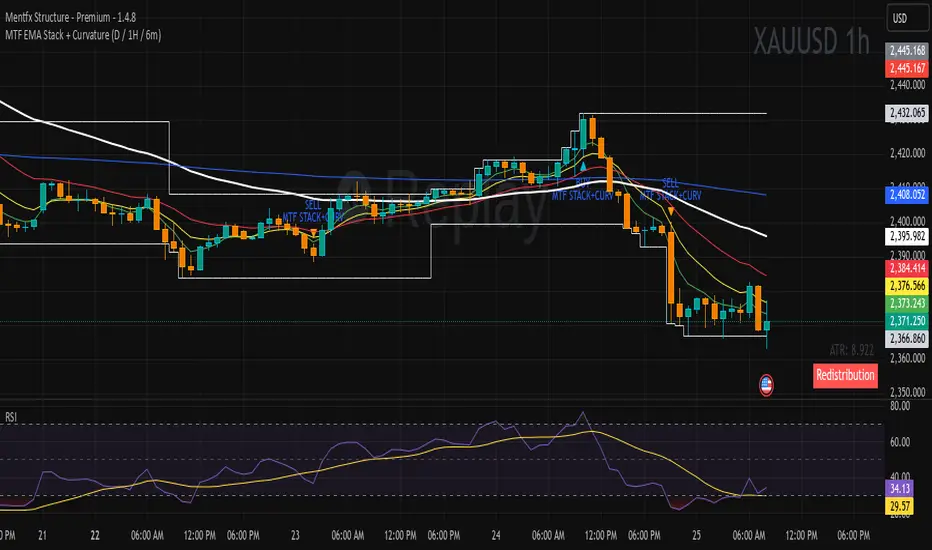
MTF EMA Stack + Curvature (D / 1H / 6m)Purpose of the Indicator
The MTF EMA Stack + Curvature Indicator is a trend-alignment confirmation tool.
Its goal is to identify high-probability trend continuation setups by requiring all of the following to agree:
Trend direction (EMA stacking)
Trend strength / acceleration (EMA curvature)
Multi-timeframe alignment (Daily, 1-Hour, and 6-Minute) with you can change to your preference
Instead of reacting to short-term noise, the indicator only signals when institutional-style trend structure is aligned across time frames.

DEVASTICits a combination of MACD+RSI+STOCHASTIC. It enhances the oscillation and sublimes the participation of stochastic indicator into the ultimate MACD the king of Indicators. I have used the formulae of 14 period SMA and combined it with other oscillators.

PDH PDL PWH PWL + IMB 15m / 1H / 4H + Weekly LogicPDH PDL PWH PWL indycators
weekly indycators automaticly generated.
for a every week

Premarket & PD H/L scannerpremarket scanner for top stock picks
Uses a stock selection of your own choosing that can be adjusted in the script as need be.
Both the premarket low or high is compared and also previous day high or low in order to determine trend and pinpoint which tickers are best suited to trade on a particular day

Heikin Ashi Wick Strategy
🔥 Heikin Ashi Wick Momentum Strategy
“Trade momentum decay before the trend breaks.
>> FOCUS ON WICKS, NOT ONLY CANDLE COLOR<<
What Makes This Different (Traffic Driver)
✔ Uses Heikin Ashi wicks (almost nobody does this correctly)
✔ Captures trend continuation, not breakouts
✔ Exits before momentum collapse, not after
✔ Non-repainting
✔ Clean charts, instant readability
This Strategy Is REALLY Trading
This is a Heikin Ashi momentum-decay system:
• Enters when trend is strong but not euphoric
• Exits when:
o Trend stops probing higher
o Sellers gain relative strength
It avoids:
• Chasing strong breakout candles
• Holding through momentum rollovers
Candle Type Used: Heikin Ashi (manually calculated)
NOTE: The script does not use regular candles.
It reconstructs Heikin Ashi (HA) candles from raw OHLC:
• HA Close = average of open, high, low, close
• HA Open = midpoint of prior HA candle (smoothed)
• HA High / Low = extremes of HA open/close vs real high/low
➡️ This filters noise and emphasizes trend structure and momentum.
Strengths
✅ Works well in strong, smooth trends
✅ Very clean logic (no indicators)
✅ Non-repainting
✅ Early exits protect capital
Best Use
This works best on:
• Daily timeframe
• Strong trend ETFs / megacaps
o QQQ
o SPY
o NVDA, MSFT, AAPL
• When combined with:
o EMA 21 trend filter (your preference)
o Market regime filter (e.g., above 50/200 SMA)
o Rising 10 EMA and 20 EMA
________________________________________
8️⃣ Weaknesses (Important)
⚠️ No stop loss (only structure-based exits)
⚠️ Can exit too early in explosive trends
⚠️ Will chop in sideways markets
⚠️ No volatility filter (ATR, EMA, regime)
How to Avoid the Weaknesses — Summary
Turn the setup from a concept into a robust strategy by adding these controls:
1. Trade Only Trends
o Require price above EMA-21 (optionally EMA-21 > EMA-50)
o Eliminates chop and sideways markets
2. Improve Exits (Avoid Leaving Winners Too Early)
o Partial exit when upper wick disappears
o Full exit only when lower wick dominates
o Optional: require 2 consecutive exit candles
3. Add Risk Protection
o Use a volatility stop: ~1.5× ATR(14) below entry or below HA swing low
o Protects against gaps and sudden reversals
4. Filter Weak Signals
o Require meaningful wick size (≈30–40% of candle range)
o Avoids low-quality indecision candles
5. Avoid Bad Volatility
o Skip entries when ATR is expanding aggressively
o Focus on calmer, controllable trends
6. Limit Time in Trade
o Add a max bars hold (e.g., 10–15 bars on daily)
o Prevents capital getting stuck in fading trends
⚠️ Educational use only. Not financial advice. Trading involves risk and losses can exceed expectations. Past performance does not guarantee future results. Use at your own risk.


Liquidity Sweep Sniper AP StyleAP Capital – Liquidity Sweep Sniper (Fab-Style)
📌 Overview
This indicator is a precision scalping tool inspired by professional liquidity-based trading concepts often demonstrated by elite intraday scalpers.
The script focuses on liquidity sweeps followed by strong displacement, aiming to capture short, high-probability momentum moves — particularly effective on lower timeframes (1–5 min) during active market sessions.
It is not a signal spam tool. Signals appear only when multiple objective conditions align.
🧠 Core Concept
Markets do not move randomly — they seek liquidity before expanding.
This indicator identifies:
Buy-side / Sell-side liquidity
Liquidity sweeps (stop-hunts)
Strong displacement candles reclaiming price
Optional higher-timeframe trend alignment
Only when all conditions are met does a signal print.
🔍 What the Indicator Detects
1️⃣ Liquidity Pools
Equal highs or equal lows detected within a configurable lookback
Minimum number of touches required
ATR-based tolerance to adapt to volatility
These levels represent areas where stop orders are likely resting.
2️⃣ Liquidity Sweep
A valid sweep requires:
Price to wick beyond the liquidity level
Candle to close back inside the range
This indicates failed breakout / stop-hunt behaviour.
3️⃣ Displacement Confirmation
After the sweep, the candle must show:
Strong body (default >60% of candle range)
Candle range large relative to ATR
Clear directional intent (momentum)
This filters out weak reactions and chop.
4️⃣ Optional Trend Filter
EMA-based higher-timeframe bias
Helps align scalps with dominant direction
Can be enabled or disabled
📈 Signals
BUY: Sell-side liquidity sweep → bullish displacement
SELL: Buy-side liquidity sweep → bearish displacement
Signals are plotted directly on the chart and can be used with alerts.
⚙️ Recommended Usage
Markets: XAUUSD, indices, liquid FX pairs
Timeframes: 1m–5m
Sessions: London & New York (best performance)
Risk Management: Always required — this tool does not place trades
Best used as a confirmation tool, not standalone.
⚠️ Important Notes
This indicator is inspired by liquidity-based scalping concepts, not an exact replication of any individual trader’s private strategy.
No indicator predicts the future — this tool highlights high-probability scenarios, not guarantees.
Past performance is not indicative of future results.

LockedEye Trading Navigator**LockedEye Trading Navigator — Summary**
This script is a real-time market decision dashboard designed to prevent impulsive trades by forcing structure, context, and confirmation checks into a single glance. It does not generate blind buy/sell signals. It evaluates market conditions, trend alignment, and risk context before allowing a trade bias.
**Core Purpose**
Acts as a pre-trade checklist, not a signal spammer.
Helps traders wait, filter, and align with structure.
Designed for scalping to intraday trading.
Optimized to reduce FOMO entries and late trades.
**Key Features**
**1. Market State Detection**
Classifies the market into TREND ↑, TREND ↓, or COOKING (ranging/compression).
Uses volatility compression and linear regression slope to prevent trading during low-quality conditions.
**2. Multi-Timeframe Moving Average Alignment**
Tracks trend alignment using EMA 6 & 21 (momentum bias), EMA 50 (mid-trend filter), EMA 200 (macro bias), and EMA 70 & 99 on M15 (higher-timeframe confirmation).
Each MA condition is displayed with directional arrows and color-coded backgrounds.
**3. Break of Structure (BOS)**
Detects bullish or bearish structure breaks based on recent range.
Flags BULL, BEAR, or NO.
Used as structural confirmation, not as a standalone signal.
**4. MACD Momentum Bias**
Evaluates MACD line versus signal line.
Outputs BULL, BEAR, or NONE.
Acts as momentum confirmation for trend continuation or exhaustion.
**5. RSI Divergence Detection**
Detects basic bullish and bearish divergence.
Highlights momentum disagreement with price.
Used as a boost factor, not a trigger.
**6. Candlestick Context**
Identifies bullish engulfing, bearish engulfing, and doji candles.
Used to validate entry timing rather than direction alone.
**7. Volume Behavior**
Compares current volume to a 20-period SMA.
Flags INCREASING or DECREASING to confirm whether price movement is supported by participation.
**8. ICT Candle Logic (Correctly Color-Coded)**
Evaluates the current close relative to the previous candle.
INSIDE: Close remains within the previous high/low, indicating consolidation.
OUTSIDE (Green): Close above previous high, indicating bullish expansion.
OUTSIDE (Red): Close below previous low, indicating bearish expansion.
Helps avoid misreading fake breakouts and inside bars.
**9. Price Location Awareness**
Determines whether price is at SUPPORT, at RESISTANCE, or in MID range.
Ensures trades are only considered where risk is logical.
**10. Final Trade Summary Engine**
Outputs one of four states: LONG OK, SHORT OK, WAIT, or NO TRADE.
Requires trend alignment, MACD agreement, structure and location validation, and at least one supporting confirmation.
**Design Philosophy**
No repainting by default.
No emotional signals.
No hindsight bias.
Forces discipline and patience.
Designed as a decision filter, not a prediction tool.
**Best Use Case**
Scalping and intraday trading.
Traders who struggle with overtrading.
Traders who want structure before execution.
Works best when combined with manual price action reading.
