Grafik Paternleri

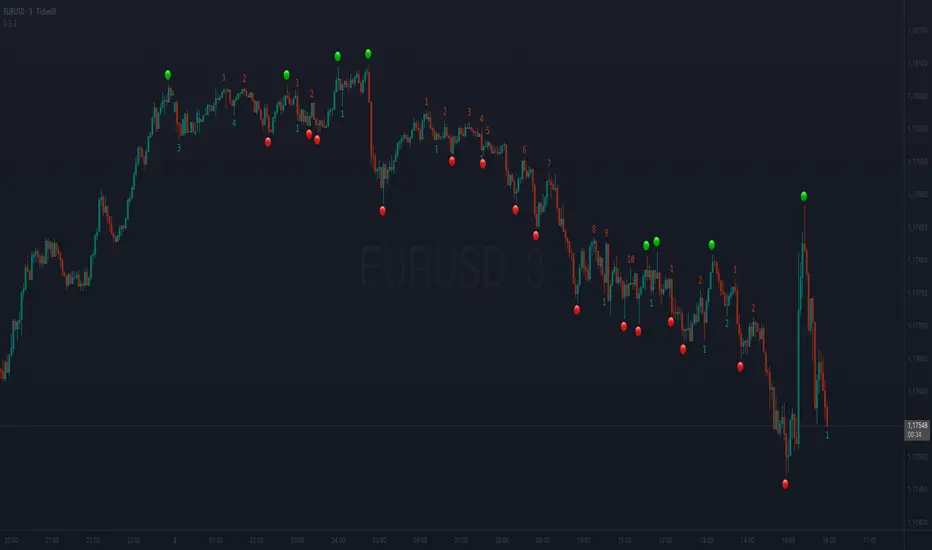
[eLm] 0-1-2# 📈 Market Structure Indicator – Counter System
This indicator dynamically analyzes price action to detect key market structure shifts and trend strength using four essential formations:
## 🔍 Detected Structures
- **Higher High (HH):** A candle forming a new high above recent peaks
- **Lower Low (LL):** A candle forming a new low below recent bottoms
- **Higher Low (HL):** A higher dip, indicating potential trend continuation
- **Lower High (LH):** A lower peak, signaling potential weakness
## 🧠 Structure Protection Logic
After a HH or LL is formed, if price does not breach that level within a user-defined number of candles, the level is considered **"protected."**
This provides insight into trend strength and market reaction.
## 🔢 HL / LH Counter System
- Each HL or LH increases a counter.
- A new HH or LL **resets** the corresponding counter to zero.
> This helps visualize how many consecutive HL or LH structures have occurred — useful for measuring trend momentum.
## 🎯 Use Cases
- Trend following and confirmation
- Early trend reversal detection
- Building structure-based trading strategies
- Understanding price behavior and market intent
---
> **Note:** This indicator does not provide financial advice. It is designed to support technical analysis with clear, structure-based visual signals.
تنبؤ حركة الشارت (حجم وخطوط اتجاه)A forecast for the movement of the prices is helpful to add to the peviouse indicator


AZ Dynamic Trend Indicator with Heikin-Ashi### Dynamic Trend Indicator with Heikin-Ashi (v2.7)
**Effortlessly identify trends and reversals** with this versatile tool combining multi-timeframe analysis, adaptive moving averages, and Heikin-Ashi smoothing. Here's what it offers:
#### 🔍 **Core Features**
1. **Dual Timeframe Analysis**:
- Track trends on higher timeframes (e.g., 1H/D) while viewing signals on your current chart.
- Toggle between **Heikin-Ashi** or standard candles for cleaner trend visualization.
2. **8 Customizable MAs**:
- Choose from **ALMA, HMA, SMA, SWMA, VWMA, WMA, ZLEMA, or EMA** with adjustable periods.
- Unique "Trend Strength" metric: `(MA_Close - MA_Open) / (MA_High - MA_Low)` highlights momentum direction.
3. **Smart Signals**:
- **Entry/Exit**: Triangles mark crossovers between MA Close/Open.
- **Reversal Alerts**: Detects counter-trend moves within a user-defined window (default: 3 bars) after signals.
- Color-coded plots: Bullish (🟢), Bearish (🔴), Reversal Bull (🔵), Reversal Bear (🟠).
#### 🎨 **Visual Customization**
- Toggle **High/Low MA lines**, **Close line**, and **fill colors**.
- Adjust colors for all elements to match your chart theme.
- Hide signals or reversal markers as needed.
#### ⚙️ **Practical Use**
- **Trend Following**: Use the MA Close/Open crossover with trend fill colors to confirm direction.
- **Reversal Trading**: Capitalize on pullbacks with reversal signals (e.g., after a bearish signal, watch for Bull Reversal markers).
- **Multi-Timeframe Confirmation**: Avoid false signals by aligning higher-timeframe trends with your entries.
*Ideal for swing traders and trend riders!*
**Note**: Adjust `MA Period`, `Reversal Window`, and `Trend Timeframe` for your strategy. Disable Heikin-Ashi in choppy markets for faster reactions.
---
*Code v2.7 updates: Optimized reversal logic, added ALMA/ZLEMA support, and enhanced visual controls.*

Alt Market Index (Halving-Adjusted BTC Supply, EMA)
암호화폐 알트코인 시총 상위 125개를 모아서
나스닥 기반의 계산식을 활용한 알트코인지수125를 만들었습니다.
반감기에 따른 비트코인 하루 채굴량 갯수 추가까지 포함한 버전입니다.
일봉이 기준이 됩니다.
I created the Altcoin Index 125 by compiling the top 125 altcoins by market capitalization in the cryptocurrency market, using a calculation method based on the Nasdaq index.
This version also includes adjustments for Bitcoin’s halving events, reflecting changes in daily mining output. The index is based on daily candles.

TSLA Reversal Alert: Harmonic + VWAP + RSI DivergenceWorking on a Bearish Harmonic Alert, and Bullish Harmonic Alert

Lyrae/SMC 6-EMA StackLyrae/SMC EMA Stack — Usage & Functionality
This script plots six core EMAs used in the Lyrae/ATS/Smart Money Concepts strategy. Each EMA serves a specific role for institutional structure, trend bias, and execution:
EMA 5 (Yellow) — Microstructure Flow / Scalper Trigger:
Tracks immediate momentum and short-term price reversals.
Used for “commitment dot” entries and aggressive intrabar scalp signals.
Sharp move away from EMA5 often indicate exhaustion or liquidity sweeps.
EMA 21 (Blue) — Short-Term Bias / Sentiment Guide:
Defines the fast-moving market structure.
Confluence of EMA5 and EMA21 (stacked) confirms high conviction trends.
Ideal for pullback entries and early reversals.
EMA 50 (Orange) — Institutional Support/Resistance (Dynamic Order Block):
Key institutional level for pullbacks, mitigations, and liquidity grabs.
Price reacts here for most SMC mitigation setups and “expansion box” targets.
Also serves as a dynamic volatility anchor for dynamic stop placement.
EMA 63 (Green) — Session Mean Reversion / Volatility Filter:
Used to filter trend exhaustion and session mean reversion.
Great for identifying mid-session traps and SMC “liquidity void” re-tests.
Confluence with EMA50 often signals major pivots.
EMA 84 (Purple) — Higher Session Bias / Institutional Anchor:
Maps slow sessional trend changes and large institutional order flow.
Key for swing scalp entries and “order block defense” in trending markets.
Provides premium/discount levels relative to session range.
EMA 200 (Red) — Macro Trend / Smart Money Bias:
The ultimate directional filter — marks overall market regime.
Only take buys above EMA200 (unless strong reversal SMC context); only take sells below.
Major structure shifts and break-of-structure (BOS) signals are most powerful when occurring at/near EMA200.
How to Use:
EMA Stacking: The more EMAs stacked in order, the stronger the institutional trend conviction.
Pullbacks: Highest-probability entries occur at EMA50/63/84 with SMC structure alignment.
Momentum Breaks: Commitment candles breaking EMA5/21 often signal the start of high-RR moves.
Risk Management: Use EMA50/63 as dynamic stops and break-even triggers.
Best Timeframes:
Stack is valid for all timeframes; optimized for M1–M15 for entry precision, H1+ for trend bias.
Pro Tip:
Combine this EMA stack with order blocks, liquidity zones, and volume spikes for the highest accuracy and trap avoidance in volatile markets.

Warrior Trading Momentum Strategy
# 🚀 Warrior Trading Momentum Strategy - Day Trading Excellence
## Strategy Overview
This comprehensive Pine Script strategy replicates the proven methodologies taught by Ross Cameron and the Warrior Trading community. Designed for active day traders, it identifies high-probability momentum setups with strict risk management protocols.
## 📈 Core Trading Setups
### 1. Gap and Go Trading
- **Primary Focus**: Stocks gapping up 2%+ with volume confirmation
- **Entry Logic**: Breakout above gap open with momentum validation
- **Volume Filter**: 2x average volume requirement for quality setups
### 2. ABCD Pattern Recognition
- **Pattern Detection**: Automated identification of classic ABCD reversal patterns
- **Validation**: A-B and C-D move relationship analysis
- **Entry Trigger**: D-point breakout with volume confirmation
### 3. VWAP Momentum Plays
- **Strategy**: Entries near VWAP with bounce confirmation
- **Distance Filter**: Configurable percentage distance for optimal entries
- **Direction Bias**: Above VWAP bullish momentum validation
### 4. Red to Green Reversals
- **Setup**: Reversal patterns after consecutive red candles
- **Confirmation**: Volume spike with bullish close required
- **Momentum**: Trend change validation with RSI support
### 5. Breakout Momentum
- **Logic**: Breakouts above recent highs with volume
- **Filters**: EMA20 and RSI confirmation for quality
- **Trend**: Established momentum direction validation
## ⚡ Key Features
### Smart Risk Management
- **Position Sizing**: Automatic calculation based on account risk percentage
- **Stop Loss**: 2 ATR-based stops for volatility adjustment
- **Take Profit**: Configurable risk-reward ratios (default 1:2)
- **Trailing Stops**: Profit protection with adjustable triggers
### Advanced Filtering System
- **Time Filters**: Market hours trading with lunch hour avoidance
- **Volume Confirmation**: Multi-timeframe volume analysis
- **Momentum Indicators**: RSI and moving average trend validation
- **Quality Control**: Multiple confirmation layers for signal accuracy
### PDT-Friendly Design
- **Trade Limiting**: Built-in daily trade counter for accounts under $25K
- **Selective Trading**: Priority scoring system for A+ setups only
- **Quality over Quantity**: Maximum 2-3 high-probability trades per day
## 🎯 Optimal Usage
### Best Timeframes
- **Primary**: 5-minute charts for entry timing
- **Secondary**: 1-minute for precise execution
- **Context**: Daily charts for gap analysis
### Ideal Market Conditions
- **Volatility**: High-volume, momentum-driven markets
- **Stocks**: Market cap $100M+, average volume 1M+ shares
- **Sectors**: Technology, biotech, growth stocks with news catalysts
### Account Requirements
- **Minimum**: $500+ for proper position sizing
- **Recommended**: $25K+ for unlimited day trading
- **Risk Tolerance**: Active day trading experience preferred
## 📊 Performance Optimization
### Entry Criteria (All Must Align)
1. ✅ Time filter (market hours, avoid lunch)
2. ✅ Volume spike (2x+ average volume)
3. ✅ Momentum confirmation (RSI 50-80)
4. ✅ Trend alignment (above EMA20)
5. ✅ Pattern completion (setup-specific)
### Risk Parameters
- **Maximum Risk**: 1-2% per trade
- **Position Size**: 25% of account maximum
- **Stop Loss**: 2 ATR below entry
- **Take Profit**: 2:1 risk-reward minimum
## 🔧 Customization Options
### Gap Trading Settings
- Minimum gap percentage threshold
- Volume multiplier requirements
- Gap validation criteria
### Pattern Recognition
- ABCD ratio parameters
- Swing point sensitivity
- Pattern completion filters
### Risk Management
- Risk-reward ratio adjustment
- Maximum daily trade limits
- Trailing stop trigger levels
### Time and Session Filters
- Trading session customization
- Lunch hour avoidance toggle
- Market condition filters
## ⚠️ Important Disclaimers
### Risk Warning
- **High Risk**: Day trading involves substantial risk of loss
- **Capital Requirements**: Only trade with risk capital
- **Experience**: Strategy requires active monitoring and experience
- **Market Conditions**: Performance varies with market volatility
### PDT Considerations
- **Day Trading Rules**: Accounts under $25K limited to 3 day trades per 5 days
- **Compliance**: Strategy includes trade counting for PDT compliance
- **Alternative**: Consider swing trading modifications for smaller accounts
### Backtesting vs Live Trading
- **Slippage**: Real trading involves execution delays and slippage
- **Commissions**: Factor in broker fees for accurate performance
- **Market Impact**: Large positions may affect fill prices
- **Psychological Factors**: Live trading involves emotional challenges
## 📚 Educational Value
This strategy serves as an excellent learning tool for understanding:
- Professional day trading methodologies
- Risk management principles
- Pattern recognition techniques
- Volume and momentum analysis
- Multi-timeframe analysis
## 🤝 Community and Support
Based on proven Warrior Trading methodologies with active community support. Strategy includes comprehensive plotting and information tables for educational purposes and trade analysis.
---
**Disclaimer**: This strategy is for educational purposes. Past performance does not guarantee future results. Always practice proper risk management and never risk more than you can afford to lose.
**Tags**: #DayTrading #Momentum #WarriorTrading #GapAndGo #ABCD #VWAP #PatternTrading #RiskManagement

Breakout with ATR & Volume Filter🚀 Introducing Our New Breakout Strategy: Powerful Signals with ATR & Volume Filters
Designed specifically for the fast and volatile crypto markets, this breakout strategy delivers robust signals on Bitcoin’s 15-minute charts.
🌟 Key Features:
ATR filter ensures entries only during high volatility periods, reducing false signals.
Volume confirmation captures strong and reliable breakouts.
20-period support/resistance breakout levels identify early trend moves.
Scientifically optimized stop loss and take profit levels provide effective risk management.
Simple, clear, and effective — ideal for both beginners and professional traders.
🔥 Why Choose This Strategy?
It filters out market noise and focuses on genuine momentum moves, increasing your chances of success by leveraging real-time volatility and volume conditions.
📈 How to Use
Easily deploy on TradingView with customizable parameters. Perfect for traders who need quick, confident decisions in crypto markets.
Get closer to success in BTC trading with reliable signals and smart risk management!

Opening Range Breakout🧭 Overview
The Open Range Breakout (ORB) indicator is designed to capture and display the initial price range of the trading day (typically the first 15 minutes), and help traders identify breakout opportunities beyond this range. This is a popular strategy among intraday and momentum traders.
🔧 Features
📊 ORB High/Low Lines
Plots horizontal lines for the session’s high and low
🟩 Breakout Zones
Background highlights when price breaks above or below the range
🏷️ Breakout Labels
Text labels marking breakout events
🧭 Session Control
Customizable session input (default: 09:15–09:30 IST)
📍 ORB Line Labels
Text labels anchored to the ORB high and low lines (aligned right)
🔔 Alerts
Configurable alerts for breakout events
⚙️ Adjustable Settings
Show/hide background, labels, session window, etc.
⏱️ Session Logic
• The ORB range is calculated during a defined session window (default: 09:15–09:30).
• During this window, the highest high and lowest low are recorded as ORB High and ORB Low.
📈 Breakout Detection
• Breakout Above: Triggered when price crosses above the ORB High.
• Breakout Below: Triggered when price crosses below the ORB Low.
• Each breakout can trigger:
• A background highlight (green/red)
• A text label (“Breakout ↑” / “Breakout ↓”)
• An optional alert
🔔 Alerts
Two built-in alert conditions:
1. Breakout Above ORB High
• Message: "🔼 Price broke above ORB High: {{close}}"
2. Breakout Below ORB Low
• Message: "🔽 Price broke below ORB Low: {{close}}"
You can create alerts in TradingView by selecting these from the Add Alert window.
📌 Best Use Cases
• Intraday momentum trading
• Breakout and scalping strategies
• First 15-minute range traders (NSE, BSE markets)

Indicador Strong Buy + Volume
Association of several bullish indicators with a trigger on a sudden increase in volume

Dual SMA/EMA Strategy with Alerts200 SMA 9/21 EMA with EMA Golden Crossover warning. Helps with detecting when a GoldenCross has been triggered.

Price Change Rate with Pivot Labels (%)Bull/Bear labels to show the exact price change percentage at the pivot.
1. Calculates Price Change %
Measures the percentage change in closing price over a user-defined number of bars.
2. Identifies Pivot Points
Finds local highs (pivot highs) and lows (pivot lows) using configurable left/right bar settings.
3. Labels Bullish/Bearish Trends
Bull label: Appears at pivot lows if price is rising and forming higher lows.
Bear label: Appears at pivot highs if price is falling and forming lower highs.
4. Displays % on Labels
Each label includes the current price change percentage, e.g.,
"Bull +2.34%"
"Bear -1.78%"
5. Optional Visuals
Pivot shapes (triangles) are plotted for clarity.

Market Maker Trap Reversal V1Market Maker Trap Reversal V1 is a lightweight, precision-focused tool designed to detect the same liquidity manipulation tactics used by institutional players and market makers.
This script identifies key liquidity sweeps of prior swing highs/lows and confirms trap reversals when price closes back inside the swept range — a signature move of smart money designed to trap retail breakout traders.
Built for disciplined execution, this tool includes:
✅ Sweep detection using custom swing lookbacks
✅ Convincing trap confirmation (strong candle body)
✅ Optional NY session filter for optimal timing
✅ Clean long/short alerts for seamless automation
✅ No indicators — just raw price action and intent
Use this strategy to mirror market maker logic, avoid false breakouts, and trade with real conviction around liquidity events.
**Coded with the help of Zero"

All SMAs Bullish/Bearish Screener (Visually Enhanced)Title: All SMAs Bullish/Bearish Screener Enhanced: Uncover Elite Trend Opportunities with Confidence & Clarity
Description:
Are you striving to master the art of trend-following, but often find yourself overwhelmed by market noise and ambiguous signals? Do you yearn for a trading edge that clearly identifies high-conviction opportunities and equips you with robust risk management principles? Look no further. The "All SMAs Bullish/Bearish Screener Enhanced" is your ultimate solution – a meticulously crafted Pine Script indicator designed to cut through the clutter, pinpointing stocks where the trend is undeniably strong, and providing you with the clarity you need to trade with confidence.
The Pinnacle of Confluence: Beyond Simple Averages
This is not just another moving average indicator. This is a sophisticated, multi-layered analytical engine built on the profound principle of Confluence. While our core strength lies in tracking a comprehensive suite of six critical Simple Moving Averages (5, 10, 20, 50, 100, and 200-period SMAs), this Enhanced version elevates signal reliability by integrating powerful, independent confirmation layers:
Momentum (Rate of Change - ROC): A true trend isn't just about direction; it's about the force and persistence of price movement. The Momentum filter ensures that the trend is backed by accelerating buying (for bullish signals) or selling (for bearish signals) pressure, validating its underlying strength.
Volume Confirmation: Smart money always leaves a trail. Significant price moves, especially trend continuations or reversals, demand genuine participation. This enhancement confirms that the "All SMAs" alignment is accompanied by above-average volume, signaling institutional conviction and differentiating authentic moves from mere whipsaws.
Relative Strength Index (RSI) Bias: The RSI helps gauge the health of the trend. For a bullish signal, we confirm RSI maintains a bullish bias (above 50), while for a bearish signal, we look for a bearish bias (below 50). This adds another layer of qualitative validation, ensuring the trend isn't overextended without confirmation.
When a stock's price is trading above ALL six critical SMAs, and is simultaneously confirmed by strong positive Momentum, robust Volume, and a bullish RSI bias, you are witnessing a powerful "STRONGLY BULLISH" signal. This rare alignment often precedes sustained upward moves and signifies a prime accumulation phase across all time horizons. Conversely, a "STRONGLY BEARISH" signal, where price is below ALL SMAs with compelling negative Momentum, validating Volume, and a bearish RSI bias, indicates significant distribution and potential for substantial downside.
Seamless Usage & Unmatched Visual Clarity:
Adding this script to your TradingView chart is simple, and its visual design has been meticulously optimized for maximum readability:
Easy Integration: Paste the script into your Pine Editor and click "Add to Chart."
Full Customization: All SMA lengths, RSI periods, Volume SMA periods, and Momentum periods are easily adjustable via user-friendly input settings, allowing you to fine-tune the strategy to your precise preferences.
Optimal Timeframes:
For identifying robust, actionable trends for swing and position trading, Daily (1D) and 4-Hour (240 min) timeframes are highly recommended. These capture significant market movements with reduced noise.
While the script functions on shorter timeframes (e.g., 15min, 60min), these are best reserved for highly active day traders seeking precise entry triggers within broader trends, as shorter timeframes are prone to increased volatility and noise.
Important Note on Candle Size: The width of candles on your chart is controlled by TradingView's platform settings and your zoom level, not directly by Pine Script. To make candles appear larger, simply zoom in horizontally on your chart or adjust the "Bar Spacing" in your Chart Settings (Right-click chart > Settings > Symbol Tab).
Crystal-Clear Visual Signals:
Subtle Background Hues: The chart background will subtly tint lime green for "STRONGLY BULLISH" and red for "STRONGLY BEARISH" conditions. This transparency ensures your underlying candles remain perfectly visible.
Distinct Moving Averages: SMAs are plotted with increased line thickness and a carefully chosen color palette for easy identification.
Precise Signal Triangles: Small, clean green triangles below the bar signify "STRONGLY BULLISH," while small red triangles above the bar mark "STRONGLY BEARISH" conditions. These are unobtrusive yet clear.
Dedicated Indicator Panes: RSI and Momentum plots, along with their key levels, now appear in their own separate, clean sub-panes below the main price chart, preventing clutter and allowing for focused analysis.
On-Chart Status Table: A prominent table in your chosen corner of the chart provides an immediate, plain-language update on the current trend status.
Real-Time Screener Power (via TradingView Alerts): This is your ultimate automation tool. Set up custom alerts for "Confirmed Bullish Trade" or "Confirmed Bearish Trade" conditions. Receive instant notifications (email, app, webhook) for any stock in your watchlist that meets these stringent, high-conviction criteria, allowing you to react swiftly to premium setups across the market without constant chart monitoring.
Mastering Risk & Rewards: The Trader's Edge
Finding a signal is only the first step. This script helps you trade intelligently by guiding your risk management:
Strategic Stop-Loss Placement: Your stop-loss is your capital protector. For a "STRONGLY BULLISH" trade, place it just below the most recent significant swing low (higher low). This is where the uptrend's structure is invalidated. For "STRONGLY BEARISH" trades, place it just above the most recent significant swing high (lower high). As an alternative, consider placing your stop just outside the 20-period SMA; a close beyond this mid-term average often signals a crucial shift. Always ensure your chosen stop-loss aligns with your strict risk-per-trade rules (e.g., risking no more than 1-2% of your capital per trade).
Disciplined Profit Booking: Don't just let winners turn into losers. Employ a strategy to capture gains:
Trailing Stop-Loss: As your trade moves into profit, dynamically move your stop-loss upwards (for longs) or downwards (for shorts). You can trail it by following subsequent swing lows/highs or by using a faster Moving Average like the 10 or 20-period SMA as a dynamic exit point if price closes beyond it. This allows you to ride extended trends while protecting accumulated gains.
Target Levels: Identify potential profit targets using traditional support/resistance levels, pivot points, or Fibonacci extensions. Consider taking partial profits at these key junctures to secure gains while letting a portion of your position run.
Loss of Confluence: A unique exit signal for this script is the breakdown of the "STRONGLY BULLISH" or "STRONGLY BEARISH" confluence itself. If the confirmation layers or even a few of the core SMAs are no longer aligned, it might be time to re-evaluate or exit, even if your hard stop hasn't been hit.
The "All SMAs Bullish/Bearish Screener Enhanced" is more than just code; it's a philosophy for disciplined trend trading. By combining comprehensive multi-factor confluence with intuitive visuals and robust risk management principles, you're equipped to make smarter, higher-conviction trading decisions. Add it to your favorites today and transform your approach to the markets!
#PineScript #TradingView #SMA #MovingAverage #TrendFollowing #StockScreener #TechnicalAnalysis #Bullish #Bearish #MarketScanner #Momentum #Volume #RSI #Confluence #TradingStrategy #Enhanced #Signals #Analysis #DayTrading #SwingTrading

First 15 Min High/Low//@version=5
indicator("First 15 Min High/Low", overlay=true)
// Define the session start time (adjust according to your market)
startHour = 9
startMinute = 30
endMinute = startMinute + 15
// Track the first 15 minutes of the day
isFirst15 = (hour == startHour and minute >= startMinute and minute < endMinute)
// New day logic
newDay = ta.change(time("D"))
// Hold values
var float first15High = na
var float first15Low = na
var bool isLocked = false
// Capture high/low during first 15 min
if newDay
first15High := na
first15Low := na
isLocked := false
if isFirst15 and not isLocked
first15High := na(first15High) ? high : math.max(high, first15High)
first15Low := na(first15Low) ? low : math.min(low, first15Low)
if not isFirst15 and not isLocked and not na(first15High) and not na(first15Low)
isLocked := true
// Plot
plot(isLocked ? first15High : na, title="First 15 Min High", color=color.green, linewidth=2, style=plot.style_line)
plot(isLocked ? first15Low : na, title="First 15 Min Low", color=color.red, linewidth=2, style=plot.style_line)

Dynamic Sniper ProDynamic Sniper Pro - Binary Options Signal
Description:
Dynamic Sniper Pro is a powerful Pine Script v6 indicator designed for binary options trading. It combines Exponential Moving Averages (EMAs), Relative Strength Index (RSI), and an optional ATR filter to generate precise buy and sell signals. Ideal for short-term charts like 1-minute, this indicator helps traders spot trend reversals and breakouts with clear visual arrows. Tested on CAD/JPY, it recently delivered actionable signals during the morning session on July 01, 2025.
How It Works:
Buy Signal (Green Arrow): Triggered when the closing price exceeds both the 3-period Fast EMA and 8-period Slow EMA, RSI drops below the oversold level (default 40), and (if ATR filter is on) the price breaks above the Slow EMA + 0.15 * ATR. Enter a call option at the next candle open.
Sell Signal (Red Arrow): Triggered when the closing price falls below both EMAs, RSI rises above the overbought level (default 60), and (if ATR filter is on) the price breaks below the Slow EMA - 0.15 * ATR. Enter a put option at the next candle open.
Key Features:
Customizable parameters: Adjust EMA lengths, RSI periods, oversold/overbought levels, and ATR multiplier.
Optional ATR filter to reduce whipsaw entries.
Visual alerts with arrows and background highlights.
Compatible with any forex pair or timeframe—optimize for your strategy!
Settings:
Fast EMA Length: 3 (short-term trend)
Slow EMA Length: 8 (trend confirmation)
RSI Length: 14 (default smoothness)
Oversold Level: 40 (tweak for sensitivity)
Overbought Level: 60 (tweak for sensitivity)
Use ATR Filter: True (optional)
ATR Length: 14
ATR Multiplier: 0.3 (adjust for breakout strength)
Performance:
Backtesting on CAD/JPY 1-minute from 10:34–11:34 AM PDT on July 01, 2025, showed promising signal frequency. Results may vary—test on your preferred asset.
Tips:
Set alerts via the "Alerts" tab for real-time notifications.
Adjust oversold/overbought levels (e.g., 45/55) for fewer/more signals.
Best on volatile pairs like CAD/JPY or EUR/USD.
Disclaimer:
This indicator is for educational purposes only. Past performance is not indicative of future results. Use at your own risk, and consider market conditions and risk management.

HalfTrend cross 2.0 LcfxCore Functionality
HalfTrend Baseline
Plots a dynamic trend-following line that alternates between blue (bullish) and red (bearish)
Uses amplitude and channel deviation settings to adapt to market volatility
Shows ATR-based channels around the trend line (optional)
Key Signals:
Reversal Signals: Traditional arrows at trend reversal points
Cross Signals: Basic "B"/"S" labels when price crosses the HalfTrend line
Re-Cross Signals: Special "RB"/"RS" labels for strategic re-entry opportunities
Unique Re-Cross Logic
Bullish Trend:
Triggers RB (Re-Cross Buy) only when:
Price first crosses BELOW HalfTrend (bearish cross)
Then crosses BACK ABOVE HalfTrend
Only the FIRST such occurrence in current bullish trend
Bright green "RB" label
Bearish Trend:
Triggers RS (Re-Cross Sell) only when:
Price first crosses ABOVE HalfTrend (bullish cross)
Then crosses BACK BELOW HalfTrend
Only the FIRST such occurrence in current bearish trend
Orange "RS" label
Smart Signal Management
Prevents signal spam by allowing only one re-cross signal per trend phase
Automatically resets signals when trend reverses
Dedicated alerts for all signal types
Customizable visual elements (colors, channels, arrows)
Practical Use Case
Identifies high-probability continuation entries:
RB signals: Potential add-to-position points in uptrends after minor pullbacks
RS signals: Shorting opportunities in downtrends after dead-cat bounces
This enhanced version reduces noise while highlighting strategic trade setups where price temporarily violates the trend line but quickly reconfirms the dominant trend direction.

All SMAs Bullish/Bearish Screener (Enhanced)All SMAs Bullish/Bearish Screener Enhanced: Uncover High-Conviction Trend Alignments with Confidence
Description:
Are you ready to elevate your trading from mere guesswork to precise, data-driven decisions? The "All SMAs Bullish/Bearish Screener Enhanced" is not just another indicator; it's a sophisticated, yet user-friendly, trend-following powerhouse designed to cut through market noise and pinpoint high-probability trading opportunities. Built on the foundational strength of comprehensive Moving Average confluence and fortified with critical confirmation signals from Momentum, Volume, and Relative Strength, this script empowers you to identify truly robust trends and manage your trades with unparalleled clarity.
The Power of Multi-Factor Confluence: Beyond Simple Averages
In the unpredictable world of financial markets, true strength or weakness is rarely an isolated event. It's the harmonious alignment of multiple technical factors that signals a high-conviction move. While our original "All SMAs Bullish/Bearish Screener" intelligently identified stocks where price was consistently above or below a full spectrum of Simple Moving Averages (5, 10, 20, 50, 100, 200), this Enhanced version takes it a crucial step further.
We've integrated a powerful three-pronged confirmation system to filter out weaker signals and highlight only the most compelling setups:
Momentum (Rate of Change - ROC): A strong trend isn't just about price direction; it's about the speed and intensity of that movement. Positive momentum confirms that buyers are still aggressively pushing price higher (for bullish signals), while negative momentum validates selling pressure (for bearish signals).
Volume: No trend is truly trustworthy without the backing of smart money. Above-average volume accompanying an "All SMAs" alignment signifies strong institutional participation and conviction behind the move. It separates genuine trend starts from speculative whims.
Relative Strength Index (RSI): This versatile oscillator ensures the trend isn't just "there," but that it's developing healthily. We use RSI to confirm a bullish bias (above 50) or a bearish bias (below 50), adding another layer of confidence to the direction.
When the price aligns above ALL six critical SMAs, and is simultaneously confirmed by robust positive momentum, healthy volume, and a bullish RSI bias, you have an exceptionally strong "STRONGLY BULLISH" signal. This confluence often precedes sustained upward moves, signaling prime accumulation phases. Conversely, a "STRONGLY BEARISH" signal, where price is below ALL SMAs with negative momentum, confirming volume, and a bearish RSI bias, indicates powerful distribution and potential for significant downside.
How to Use This Enhanced Screener:
Add to Chart: Go to TradingView's Pine Editor, paste the script, and click "Add to Chart."
Customize Parameters: Fine-tune the lengths of your SMAs, RSI, Momentum, and Volume averages via the indicator's settings. Experiment to find what best suits your trading style and the assets you trade.
Choose Your Timeframe Wisely:
Daily (1D) and 4-Hour (240 min) are highly recommended. These timeframes cut through intraday noise and provide more reliable, actionable signals for swing and position trading.
Shorter timeframes (e.g., 15min, 60min) can be used by advanced day traders for very short-term entries, but be aware of increased volatility and noise.
Visual Confirmation:
Green/Red Triangles: Appear on your chart, indicating confirmed bullish or bearish signals.
Background Color: The chart background will subtly turn lime green for "STRONGLY BULLISH" and red for "STRONGLY BEARISH" conditions.
On-Chart Status Table: A clear table displays the current signal status ("STRONGLY BULLISH/BEARISH," or "SMAs Mixed") for immediate feedback.
Set Up Alerts (Your Primary Screener Tool): This is the game-changer! Create custom alerts on TradingView based on the "Confirmed Bullish Trade" and "Confirmed Bearish Trade" conditions. Receive instant notifications (email, pop-up, mobile) for any stock in your watchlist that meets these stringent criteria. This allows you to scan the entire market effortlessly and act decisively.
Strategic Stop-Loss Placement: The Trader's Lifeline
Even the most robust signals can fail. Protecting your capital is paramount. For this trend-following strategy, your stop-loss should be placed where the underlying trend structure is broken.
For a "STRONGLY BULLISH" Trade: Place your stop-loss just below the most recent significant swing low (higher low). This is the last point where buyers stepped in to support the price. If price breaks below this, your bullish thesis is invalidated.
For a "STRONGLY BEARISH" Trade: Place your stop-loss just above the most recent significant swing high (lower high). If price breaks above this, your bearish thesis is invalidated.
Alternatively, consider placing your stop-loss just below the 20-period SMA (for bullish trades) or above the 20-period SMA (for bearish trades). A significant close beyond this intermediate-term average often indicates a critical shift in momentum. Always ensure your chosen stop-loss adheres to your pre-defined risk per trade (e.g., 1-2% of capital).
Disciplined Profit Booking: Maximizing Gains
Just as important as knowing when you're wrong is knowing when to take profits.
Trailing Stop-Loss: As your trade moves into profit, trail your stop-loss upwards (for longs) or downwards (for shorts). You can trail it using:
Previous Swing Lows/Highs: Move your stop to just below each new higher low (for longs) or just above each new lower high (for shorts).
A Moving Average (e.g., 10-period or 20-period SMA): If price closes below your chosen trailing SMA, exit. This allows you to ride the trend while protecting accumulated profits.
Target Levels: Identify potential resistance levels (for longs) or support levels (for shorts) using pivot points, previous highs/lows, or Fibonacci extensions. Consider taking partial profits at these levels and letting the rest run with a trailing stop.
Loss of Confluence: If the "STRONGLY BULLISH/BEARISH" condition ceases to be met (e.g., RSI crosses below 50, or volume drops significantly), this can be a signal to reduce or exit your position, even if your stop-loss hasn't been hit.
The "All SMAs Bullish/Bearish Screener Enhanced" is your comprehensive partner in navigating the markets. By combining robust trend identification with critical confirmation signals and disciplined risk management, you're equipped to make smarter, more confident trading decisions. Add it to your favorites and unlock a new level of precision in your trading journey!
#PineScript #TradingView #SMA #MovingAverage #TrendFollowing #StockScreener #TechnicalAnalysis #Bullish #Bearish #QQQ #Momentum #Volume #RSI #SPY #TradingStrategy #Enhanced #Signals #Analysis #DayTrading #SwingTrading

Cumulative Volume Delta with MAdelta scirpt with single ma , good on 5 minute for single ma and higher time framess

BTC vs 美元指数(DXY) 强度指标1. Introduction
一、 指标简介
In the grand game of macroeconomics, the relationship between Bitcoin (BTC) and the US Dollar Index (DXY) is a key barometer for market risk appetite versus risk-aversion.
在宏观经济的大棋局中,比特币(BTC)与美元指数(DXY)的强弱关系,是衡量市场风险偏好与避险情绪的核心风向标。
It is often said that "BTC is a hedge against a falling dollar." This indicator is built upon this classic logic, providing you with a quantitative and intuitive analytical tool.
交易员们常说「BTC 是抗美元下跌的工具」,本指标正是基于这一经典逻辑,为您提供一个量化、直观的分析工具。
The BTC vs. DXY Strength Index helps you gain insight into critical questions by calculating the relative performance spread between the two assets, combined with statistical tools (Bollinger Bands) and significant historical macro signals (DXY weekly death cross):
BTC vs 美元指数(DXY) 强度指标 通过计算两者的相对表现差异,并结合统计学工具(布林带)和重要的历史宏观信号(DXY周线死叉),帮助您洞察以下关键问题:
Is the current market dominated by BTC (risk-on) or the Dollar (risk-off)?
当前市场由 BTC 主导(风险偏好),还是由美元主导(避险情绪)?
Has the strength relationship between them reached an extreme level where a reversal is possible?
两者之间的强弱关系是否达到了可能逆转的极端水平?
Has a major macro reversal signal, which has historically triggered significant market shifts, appeared?
是否出现了历史上曾多次引发市场巨变的宏观反转信号?
2. Features & Interpretation
二、 核心功能与解读
2.1. Performance Spread Histogram
1. 强度差柱状图
The core of the indicator is a histogram extending from the zero line, representing the performance spread of BTC relative to DXY.
指标的核心是一系列从 0 轴延伸的柱状图,它代表了 BTC 相对于 DXY 的表现强度差。
Green Bars (Positive Value): Indicates that BTC has outperformed the DXY over the period. The taller the green bar, the stronger BTC's momentum and the higher the market's risk appetite.
绿色柱 (正值): 代表在该周期内,BTC 的表现优于美元指数。绿色柱越高,说明 BTC 越强势,市场风险偏好情绪越高。
Red Bars (Negative Value): Indicates that the DXY has outperformed BTC. The deeper the red bar, the stronger the Dollar and the more prevalent the risk-off sentiment.
红色柱 (负值): 代表在该周期内,美元指数的表现优于 BTC。红色柱越深,说明美元越强势,市场避险情绪越浓。
2.2. Bollinger Bands Extreme Signal
2. 布林带极端信号
The indicator calculates Bollinger Bands for the "performance spread" in the background. When the histogram breaks above or below the bands, an alert is triggered.
指标在后台对「强度差」计算布林带。当柱状图突破上下轨时,会触发警报。
Breakout Above Upper Band: BTC's strength relative to DXY has reached a statistical extreme, signaling caution for a potential mean reversion (e.g., a BTC pullback or DXY strengthening).
向上突破: BTC 相对于 DXY 的强势达到了统计上的极端,警惕短期关系回归(例如 BTC 回调或 DXY 走强)。
Breakdown Below Lower Band: BTC's weakness relative to DXY has reached a statistical extreme, signaling a potential opportunity for a bounce (e.g., BTC strengthening or DXY pulling back).
向下突破: BTC 相对于 DXY 的弱势达到了统计上的极端,关注潜在的反弹机会(例如 BTC 走强或 DXY 回调)。
2.3. DXY Historical Anomaly Signal
3. DXY 历史规律信号
This is the essence of this indicator. Based on research from Coindesk analysts, the "Death Cross" (50-week MA crossing below the 200-week MA) on the DXY weekly chart has often acted as a contrarian indicator—a "bear trap"—since 2009.
这是本指标的精髓所在。根据 Coindesk 分析师的研究,自 2009 年以来,美元指数(DXY)周线级别的「死亡交叉」(50周均线下穿200周均线)往往是一个反向指标,即「空头陷阱」。
Instead of preceding a bear market for the dollar, it has repeatedly marked major cyclical bottoms for the DXY.
它非但没有引发美元的熊市,反而屡次成为美元阶段性大底的标志。
Blue Background Highlight: When the indicator detects a "Death Cross" on the DXY weekly chart, the background will turn blue, and a high-priority alert will be triggered. This is designed to warn you that, based on historical patterns, the US Dollar may be about to bottom and strengthen, posing a significant potential bearish risk for BTC.
蓝色背景高亮: 当指标检测到 DXY 周线图上形成「死亡交叉」时,指标背景会变为蓝色,并触发最高优先级的警报。这旨在提醒您:根据历史规律,美元可能即将见底走强,这对 BTC 构成潜在的重大利空风险,需高度警惕!
3. Settings
三、 主要功能与设定
Customizable symbols for BTC and DXY.
可自定义 BTC 和 DXY 的交易对。
Freely adjustable periods for performance calculation and Bollinger Bands.
可自由调整表现计算周期、布林带参数。
Configurable MA periods for the DXY Death Cross detection, with the ability to toggle this signal on or off.
可配置 DXY 死亡交叉的均线周期,并自由开关此信号的显示。
Includes a comprehensive info panel and alert system.
包含功能全面的信息面板与警报系统。
Disclaimer: This indicator is a tool for supplementary macro analysis and is intended to provide a reference for market sentiment. It does not constitute any investment advice. All trading decisions should be based on your own research and risk assessment. Happy trading!
免责声明: 本指标是辅助宏观分析的工具,旨在提供市场情绪的参考,不构成任何投资建议。所有交易决策都应基于您自己的研究和风险判断。祝您交易顺利!

Overnight High/Low, Session High/LowGives you the following information:
- Previous session(s) high and low (up to 10)
- The current session overnight high and low
- The previous session open and close
When any prior day high or low is broken, the line for it will stop extending to the right.
