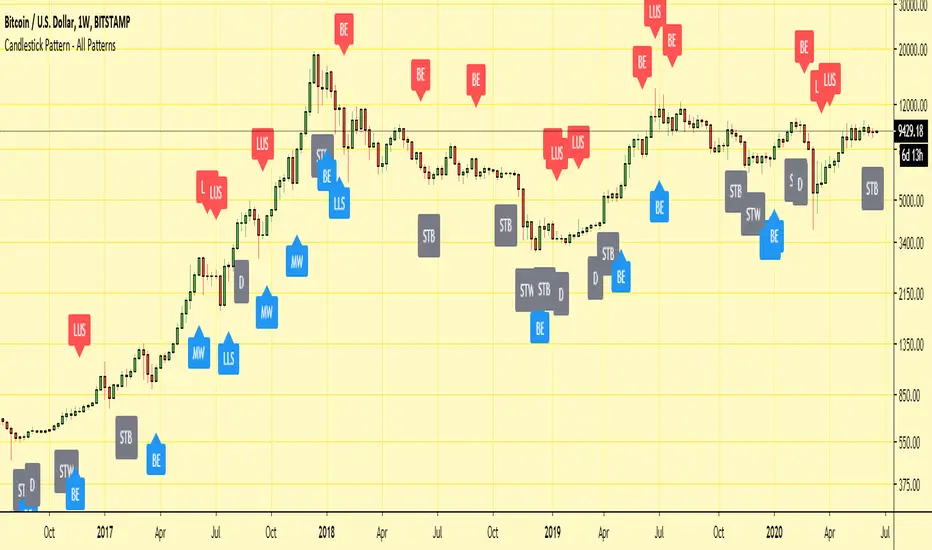
Candlestick Pattern - All PatternsHi,
Here I have collated all of the in-built TradingView candlestick patterns into one indicator.
It works on all time frames and can be useful for candlestick traders to quickly spot patterns forming on any chart.
It also allows for all individual patterns to be set up as seperate alerts within the same indicator.
Any issues/suggestions/requests let me know.
Enjoy!
Candlestickpattern
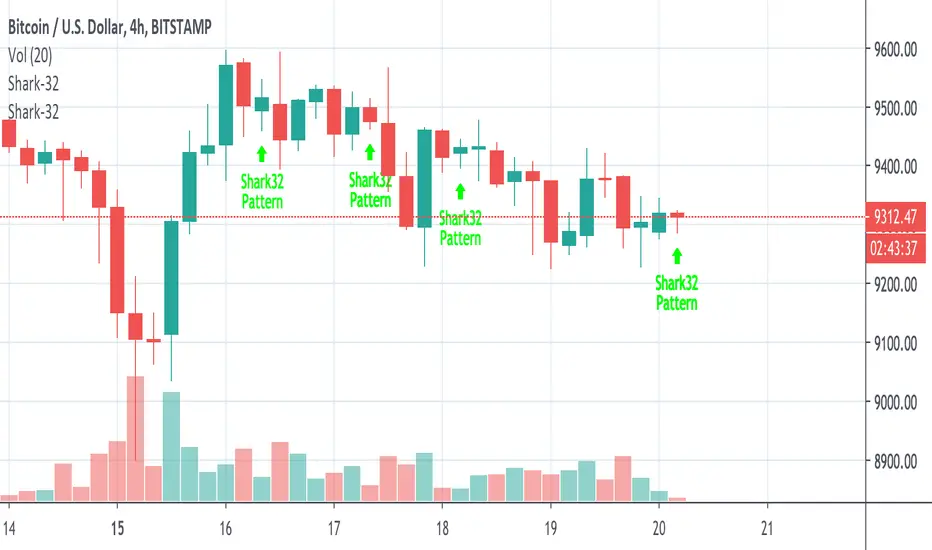
Shark-32 Pattern for Candle sticks AnalysisThis script is the perfect strategy for the all mighty shark-32 pattern.
It shows the power tussle between demand and supply before either of them finally gives up.
HTF Candlestick Patterns [TradingView] vX by DGTCandlesticks are graphical representations of price movements for a given period of time. They are commonly formed by the opening, high, low, and closing prices of a financial instrument. They have their origins in the centuries-old Japanese rice trade and have made their way into modern day price charting.
It’s important to note that candlestick patterns aren’t necessarily a buy or sell signal by themselves. They are instead a way to look at market structure and a potential indication of an upcoming opportunity. It is always useful to look at candlestick patterns in context like any other market analysis tool and candlestick patterns are most useful when used in combination with other techniques. There are countless candlestick patterns that traders can use to identify areas of interest on a chart, where some candlestick patterns may provide insights into the balance between buyers and sellers, others may indicate a reversal, continuation, or indecision.
Reversal patterns are quite useful when used in context. Reversal patterns should form at the bottom of a downtrend or at the top of an uptrend. Otherwise, they are not a reversal patterns, but continuation patterns. Most reversal patterns require confirmation such as price move in the direction of reversal accompanied by appropriate trading volume. The reversal patterns can further be confirmed through other means of traditional technical analysis—like trend lines, momentum, oscillators, or volume indicators—to reaffirm buying or selling pressure. The patterns themselves do not guarantee that the trend will reverse. Investors should always confirm reversal by the subsequent price action before initiating a trade.
This study implements some of the most commonly used candlestick patterns in a context with directional movement indicator. On request users can adjust the strong trend threshold from dialog box, eighter can disabled correlation with directional movement indicator. To add additional sight to analysis the simple moving averages of 20, 50, 100 and 200 periods are added (configurable)
You may add additional indicators of your choice. Colored DMI, BB Cloud or Price Distance to its MAs may help
Enjoy it!
Disclaimer: The script is for informational and educational purposes only. Use of the script does not constitutes professional and/or financial advice. You alone the sole responsibility of evaluating the script output and risks associated with the use of the script. In exchange for using the script, you agree not to hold dgtrd tradingview user liable for any possible claim for damages arising from any decision you make based on use of the script

万有引力(均线支撑阻挡Moving Average Support and Resisitance)系统This is a Moving Average indicator base on R/S which design for Chinese.
这是一个基于均线作为移动支撑阻挡的用法而设计的指标。
本脚本的目的在于帮助使用中文的人了解该指标,特别是其用法。同时将该指标代码添加完整的中文注释,方便使用中文的人学习Pine语言。
均线移动支撑阻挡的用法是葛南维八大买卖法则的基础。
本指标的特色
本指标利用均线的支撑阻挡效应来捕捉一段长期趋势的第二段行情。
*万有引力:即均值回归理论。认为价格始终在重复着远离其均值,再回到其均值;
*洛希极限:以均线为中心,以其0.2标准差构建其上下轨道,形成一个容错通道;
指标可调节参数
该指标有三个可设置的参数
1 短周期均线参数:默认为20;
2 长周期均线乘数:默认为80;
3 标准差参数:0.2
本指标还有两项可选设置项
1 价格源:价格源默认使用收盘价,但是你还可以选择使用开盘价、最高价、最低价等其他的价格计算方式;
2 是否显示强趋势的开关;
3 是否显示中趋势的开关;
指标用法
买入信号: 当指标出现上涨A或上涨B时,即为买入信号。其中上涨A为强趋势信号,上涨B为中趋势信号。
卖出信号: 当指标出现下跌A或下跌B时,即为卖出信号。其中下跌A为强趋势信号,下跌B为中趋势信号。
本指标支持配置买卖点的预警。
指标优势
1 适用于不同的时间周期和不同的交易品种;
2 对趋势有很好的识别效应。
指标局限性
本指标主要在于捕捉趋势的第二段,若当前趋势较弱时,第二段极有可能不成立。

SMA custom range Candle patterns (Mercenario)Custom SMA with custom range in pips
It recognises candle patterns
hammer
engulfing
three black crows and white soldiers
and HE
hammer entry, for strategy, hammer with candle confirming trend


Candlestick Reversal SystemHello Traders,
In the book "Secrets of a Pivot Boss: Revealing Proven Methods for Profiting in the Market" by Franklin Ochoa, Four different types of reversal systems were introduced and candlestick patterns are used to find reversals. I will not write a lot about the book, you should get/read it for yourself. There are many great ideas in the book, Candlesetick Reversal System, Following Trend, Time Price Opportunity, Advanced Camarilla Concepts and much more.
Reversal systems mentioned in the book are :
- Wick Reversal System
- Exteme Reversal System
- Outside Reversal System
- Doji Reversal System
I tried to add these four reversal systems to the script. If you need detailed info you better read the book ;)
Enjoy!

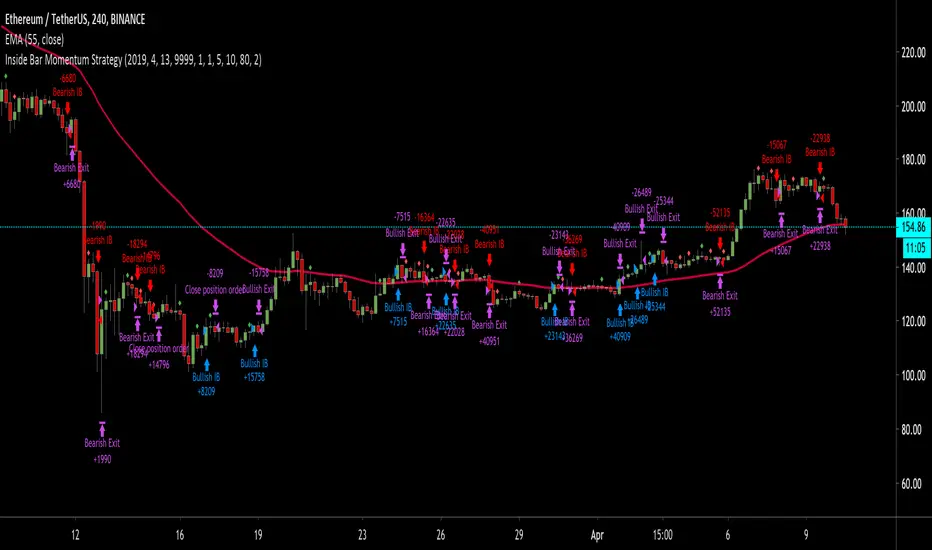
Inside Bar Momentum StrategyDescription for the strategy:
It's an inside bar momentum trade, looking for candlestick formations breakout and trading momentum with a short stop and target to 80% of the initial candle.
The entry is on a break of the original candle, stop loss is at 20% of the candle range (from the entry).
In case there's a new inside bar formation, all existing orders and trades are cancelled and new orders are placed for the new levels.
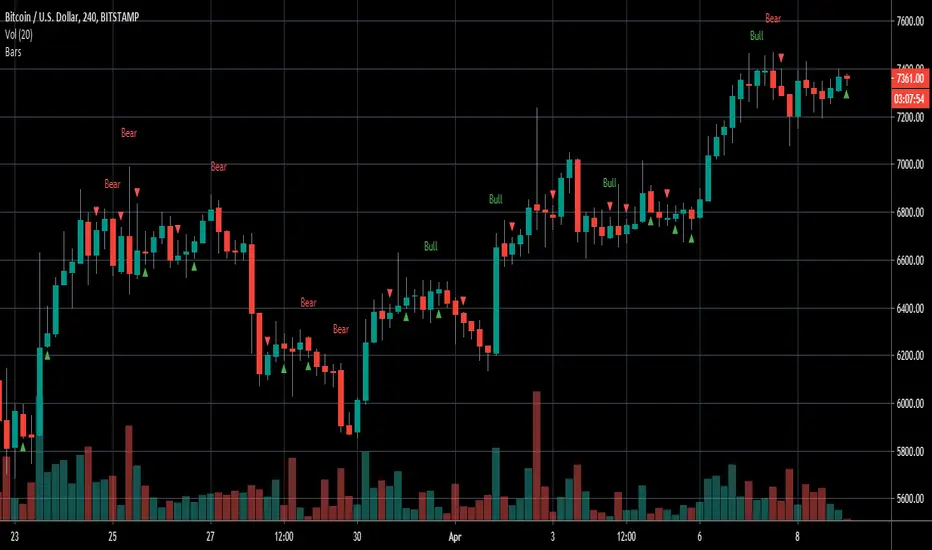
Engulfing/Inside BarsVery basic script to help discretionary traders with their candlestick pattern analysis
This script shows a colored arrow on top or below the candlestick indicating a bearish/bullish inside bar formation
also shows text with "bull" or "bear" on top of the candle when a bullish or bearish engulfing pattern surges.
big thanks to the pinescript reference manual & everyone that has open source codes bc i got stuck 50 bajillion times
Cheers.
Candlestick PatternsCandlestick Patterns
- Candlesticks are graphical representations of price movements for a given period of time.
- There are candlestick patterns that try to predict the final direction, caused by pressure between buyers and sellers.
As a general recommendation, use the candlestick patterns in the same direction of the current trend (continuations),
for reverse patterns we must expect the price to be over extended, for example,
that it is the highest or lowest value of (20-50) periods,
or that the RSI is overbought or oversold (14-50),
or that the price is far from its standard deviation.
- This indicator allows you to view more than 20 different patterns, some of them:
Doji
Engulfing
Hammer
Shooting Star
Inverted Hammer
Hanging Man
Morning Star
Evening Star
etc...
- The indicator allows displaying the full name of the pattern
- It allows you to view the labels at the top of the chart, to avoid this affecting the technical analysis

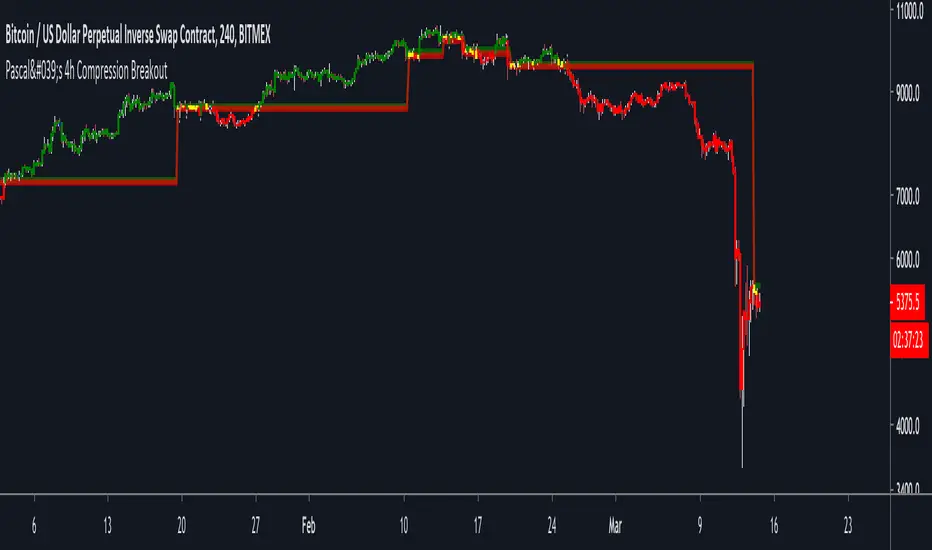
Pascal's 4h Compression BreakoutThis indicator aims to identify areas of price compression, by looking for two consecutive "inside candles" on the 4h chart.
An inside candle is simply when the current candle's high is lower than the previous candle's high, and the current candle's low is higher than the previous candle's low.
Once price compression is identified, the indicator draws a range based on the highest high and the lowest low of the two inside candles.
1) A break above the range is bullish.
2) A break below the range is bearish.
The script ALSO paints candles in blue that are likely to become strong horizontal S/R levels. This is, again, based on a candle pattern.
Please note:
1) This indicator is only meant to be used on BITMEX:XBTUSD (on the 4h or 1h chart).
2) You will have to apply some discretion to profitably trade with this indicator. Use SFPs and horizontal S/R levels to judge if a breakout is worth trading.
Finally, use the indicator at your own risk. I am not responsible for any losses you may incur.
My objective with this indicator g is to hopefully give you something that you can build upon, and NOT a script to blindly copy trade.
The concept of market compression is powerful. There are countless ways in which you can build a system around it.
This is just the tip of the iceberg.
Cheers.
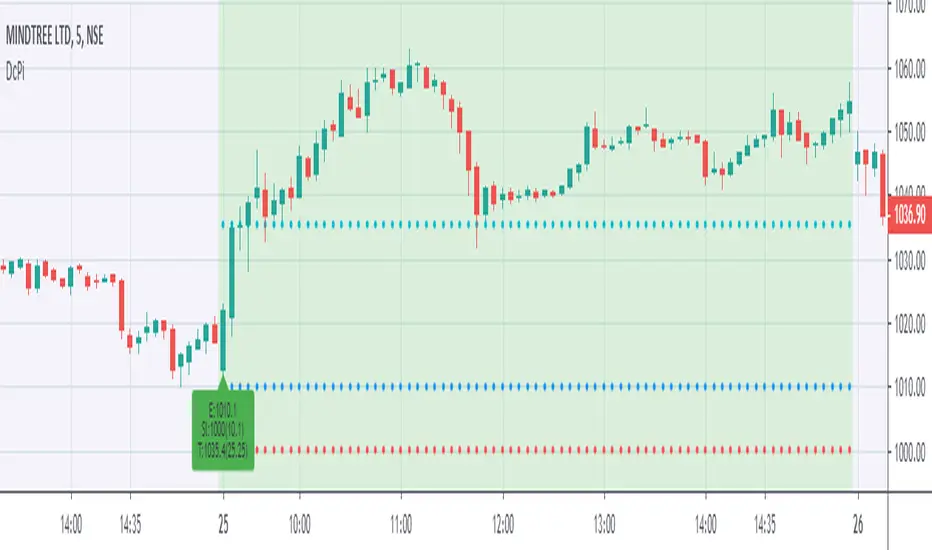
DcPi for intraday tradesDcPi stands for dark cloud and piercing , This is a very reliable pattern for intraday trades.
Precondition-
Whenever a big move is followed by gap(up/down) open next day.
Trade Setup-
Wait for price to enter in previous day range.
Aggressive traders can enter trade as soon as price enters previous day range, safe traders can wait for 1st 5 minute candle close, target can be mid of previous day range.
Trailing stoploss is a good way to secure your profits.
How this indicator helps?
Whenever intraday range will be more than 5% move, chart background will turn light blue, one might add stock to watchlist for next day.
if next day is gap open, chart background will be light green, and a textbox will be displayed with entry, stoploss and targets. One might take trades as explained in trade setup.
How it is dark cloud and piercing pattern?
Green candle followed by gap up open next day and closing in previous day range is Dark cloud on daily timeframe.
Red candle followed by gap down open next day and closing in previous day range is piercing pattern on daily timeframe.
Dekidaka-Ashi - Candles And Volume Teaming Up (Again)The introduction of candlestick methods for market price data visualization might be one of the most important events in the history of technical analysis, as it totally changed the way to see a trading chart. Candlestick charts are extremely efficient, as they allow the trader to visualize the opening, high, low and closing price (OHLC) each at the same time, something impossible with a traditional line chart. Candlesticks are also cleaner than bars charts and make a more efficient use of space. Japanese peoples are always better than everyone at an incredible amount of stuff, look at what they made, the candlesticks/renko/kagi/heikin-ashi charts, the Ichimoku, manga, ecchi...
However classical candlesticks only include historical market price data, and won't include other type of data such as volume, which is considered by many investors a key information toward effective financial forecasting as volume is an indicator of trading activity. In order to tackle to this problem solutions where proposed, the most common one being to adapt the width of the candle based on the amount of volume, this method is the most commonly accepted one when it comes to visualizing both volume and OHLC data using candlesticks.
Now why proposing an additional tool for volume data visualization ? Because the classical width approach don't provide usable data regarding volume (as the width is directly related to the volume data). Therefore a new trading tool based on candlesticks that allow the trader to gain access to information about the volume is proposed. The approach is based on rescaling the volume directly to the price without the direct use of user settings. We will also see that this tool allow to create support and resistances as well as providing signals based on a breakout methodology.
Dekidaka-Ashi - Kakatte Koi Yo!
"Dekidaka" (出来高) mean "Volume" in a financial context, while "Ashi" (足) mean "leg" or "bar". In general methods based on candlesticks will have "Ashi" in their name.
Now that the name of the indicator has been explained lets see how it works, the indicator should be overlayed directly to a candlestick chart. The proposed method don't alter the shape of the candlesticks and allow to visualize any information given by the candles. As you can see on the figure below the candle body of the proposed tool only return the border of the candle, this allow to show the high/low wick of the candle.
The body size of the candle is based on two things : the absolute close/open difference, and the volume, if the absolute close/open difference is high and the volume is high then the body of the candle will be clearly visible, if the volume is high but the absolute close/open difference is low, then the body will be less visible. This approach is used because of the rescaling method used, the volume is divided by the sum between the current volume value and the precedent volume value, this rescale the volume in a (0,1) range, this result is multiplied by the absolute close/open difference and added/subtracted to the high/low price. The original approach was based on normalization using the rolling maximum, but this approach would have led to repainting.
You have access to certain settings that can help you obtain a better visualization, the first one being the body size setting, with higher values increasing the body amplitude.
In green body with size 2, in red with size 1. The smooth parameter will smooth the volume data before being used, this allow to create more visible bodies.
Here smooth = 100.
Making Bands From The Dekidaka-Ashi
This tool is made so it output two rescaled volume values, with the highest value being denoted as "Dekidaka-high" and the lowest one as "Dekidaka-low". In order to get bands we must use two moving averages, one using the Dekidaka-high as input and the other one using Dekidaka-low, the body size parameter should be fairly high, therefore i will hide the tool as it could cause trouble visualizing the bands.
Bands with both MA's of period 20 and the body size equal to 20. Larger periods of the MA's will require a larger amount of body size.
Breakout Signals
There is a wide variety of signals that can be made from candles, ones i personally like comes from the HA candles. The proposed tool is no exception and can produce a wide variety of signals. The signals generated are basic ones based on a breakout methodology, here is each signal with their associated label :
Strong Bullish signal "⇈" : The high price cross the Dekidaka-high and the closing price is greater than the opening price
Strong Bearish signal "⇊" : The low price cross the Dekidaka-low and the closing price is lower than the opening price
Weak Bullish signal "↑" : The high price cross the Dekidaka-high and the closing price is lower than the opening price
Weak Bearish signal "↓" : The low price cross the Dekidaka-low and the closing price is greater than the opening price
Uncertain "↕" : The high price cross the Dekidaka-high and the low price cross the the Dekidaka-low
In order to see the signals on the chart check the "Show signals" option. Note that such signals are not based on an advanced study, and even if they are based on a breakout methodology we can see that volatile movement rarely produce signals, therefore signals mostly occur during low volume/volatility periods, which isn't necessarily a great thing.
Conclusion
A trading tool based on candlesticks that aim to include volume information has been presented and a brief methodology has been introduced. A study of the signals generated is required, however i'am not confident at all on their accuracy, i could work on that in the future. We have also seen how to make bands from the tool.
Candlesticks remain a beautiful charting technique that can provide an enormous amount of information to the trader, and even if the accuracy of patterns based on candlesticks is subject to debates, we can all agree that candlesticks will remain the most widely used type of financial chart.
On a side note i mostly use a dark color for a bullish candle, and a light gray for a bearish candle, with the border color being of the same color as the bullish candle. This is in my opinion the best setup for a candlestick chart, as candles using the traditional green/red can kill the eyes and because this setup allow to apply a wide variety of colors to the plot of overlayed indicators without the fear of causing conflict with the candles color.
Thanks for reading ! :3 Nya
A Word
This morning i received some hateful messages on twitter, the users behind them certainly coming from tradingview, so lets be clear, i know i'am not the most liked person in this community, i know that perfectly, but no one merit to be receive hateful messages. I'am not responsible for the losses of peoples using my indicators, nor is tradingview, using technical indicators does not guarantee long term returns, your ability to be profitable will mostly be based on the quality and quantity of knowledge you have.

BEST Engulfing + Breakout StrategyHello traders
This is a simple algorithm for a Tradingview strategy tracking a convergence of 2 unrelated indicators.
Convergence is the solution to my trading problems.
It's a puzzle with infinite possibilities and only a few working combinations.
Here's one that I like
- Engulfing pattern
- Price vs Moving average for detecting a breakout
Definition
Take out the notebooks :) and some coffee (good for focus). I'm bullish in coffee
The engulfing pattern is a two-candle reversal pattern.
The second candle completely ‘engulfs’ the real body of the first one, without regard to the length of the tail shadows.
The bullish Engulfing pattern appears in a downtrend and is a combination of one red candle followed by a larger green candle
The bearish Engulfing pattern appears in a downtrend and is a combination of one green candle followed by a larger red candle
Example: imgur.com
We're bored sir... what's the point of all this?
In summary, an engulfing is a pattern to track reversals. (the whole TradingView audience stands up now giving a standing ovation)
Adding the Price vs Moving average filters allows to track reversals with momentums (half of the audience collapsed because this is too awesome)
Ok sir... you picked up my interest
I included some cool backtest filters:
- date range filtering
- flexible take profit in USD value (plotted in blue)
- flexible stop loss in USD value (plotted in red)
All the best
Dave

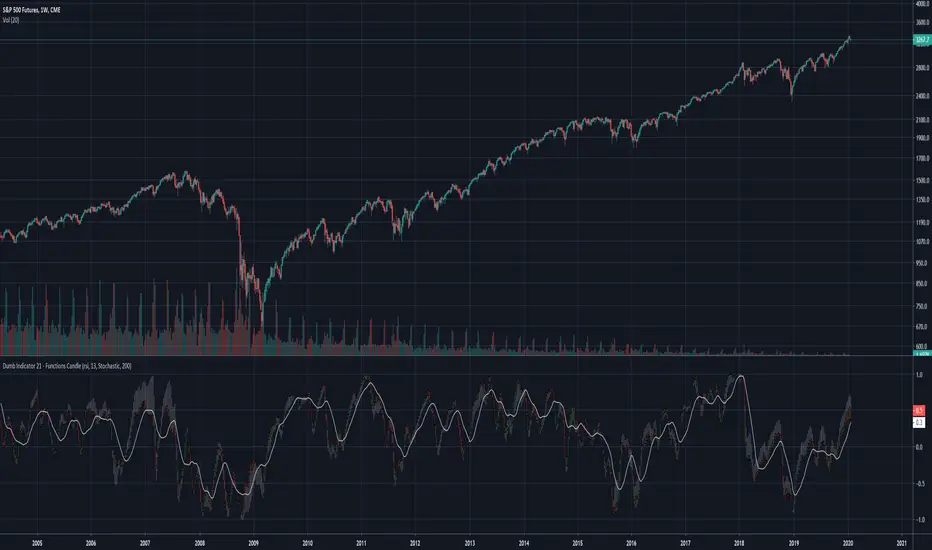
Dumb Indicator 21 - Function's Candlestick Bar's StyleThe idea is help traders to see the patterns and levels from a different point o view.
This script create candlestick using the opening, high, low and close price as source on your favorite function.
It's very simple to use:
Select a function in the drop box list, the number of bars length, check or uncheck the boxes to treat source as logarithm, smooth, and if you want to plot the SMA from the results.
To make a deeper analysis, you can select to plot the candles in Stochastic or in Percent Rank way.
The Stochastic and Percent Rank plot will show how far the price is close to highest or lowest value of the source from the last "Stochastic Length" number of bars.
Some functions with different names can plot the same results.
This indicator works on every kind of market, but you will need to find the best function and length to use.
Please, if you find anything good with this, share to everyone.
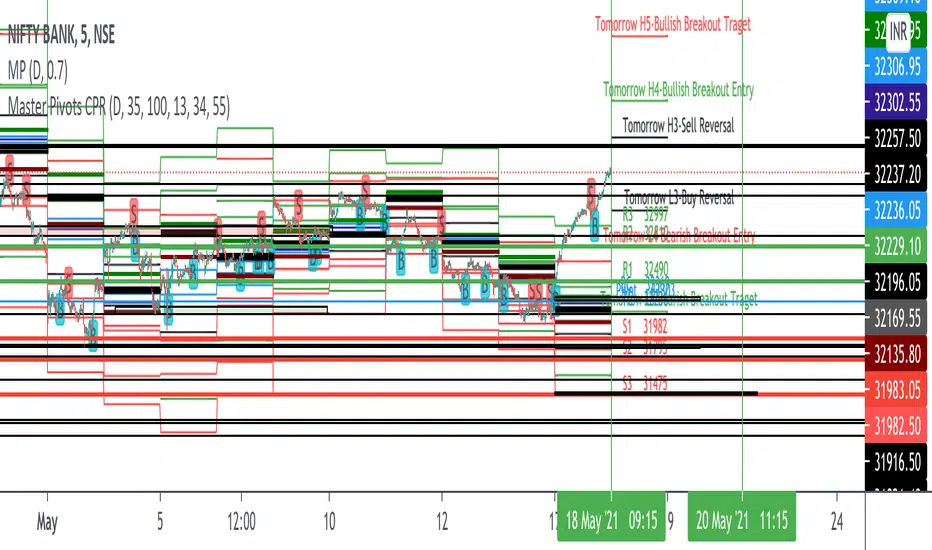
Master Pivots (CPR)This helps in monitoring the support and resistance of the current day and plan for tomorrow's support and resistance. The formula for creating the indicator is as below.
Pivot Point (P) = (High + Low + Close)/3
Support 1 (S1) = (P x 2) - High
Support 2 (S2) = P - (High - Low)
Resistance 1 (R1) = (P x 2) - Low
Resistance 2 (R2) = P + (High - Low)
Floor Pivots are one of the classic pivot ranges and helps us in trading based on pivot values. This indicator that I have built is also capable of predicting tomorrow's support and resistance up to 3 levels i.e. R1, R2, R3 and S1, S2 and S3. This is the only indicator available in trading view which does the same. Thats the only reason of making a separate indicator.
In this indicator we have also added some symbols to identify the reversal patterns based on candle. This is best if used in 15 min candle. This plots engulfing pattern, shooting star, hammer and bullish and bearish reversals.
Please use it and provide feedback for changes. If i would change anything it would be available automatically anyway.
I have not added Fibonacci Pivots as its generally available in many sites out of box. How ever if you want to code you can use the below formula.
Pivot Point (P) = (High + Low + Close)/3
Support 1 (S1) = P - {.382 * (High - Low)}
Support 2 (S2) = P - {.618 * (High - Low)}
Support 3 (S3) = P - {1 * (High - Low)}
Resistance 1 (R1) = P + {.382 * (High - Low)}
Resistance 2 (R2) = P + {.618 * (High - Low)}
Resistance 3 (R3) = P + {1 * (High - Low)}
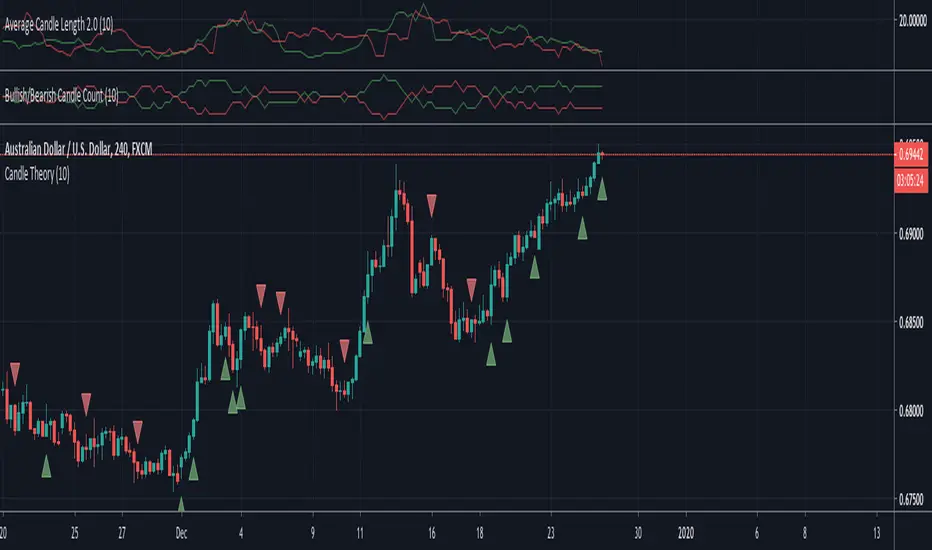
Candle TheoryDescription: The theory behind this script is that if within the last 10 candles, if the majority of them are green and the average length (wick to wick) of those majority green candles is greater than the average length of the minority red candles then it will signal that this is a bullish move within the market and signal you to buy. The opposite is true for bearish moves.
Inputs:
Length - this allows you to decide how many candles to look back, default/recommended is 10
Show First Signal In Series Only - using this indicator without this checked will show many more signals in a row. This allows you to just get a signal for the first candle that is the predicted bullish or bearish move
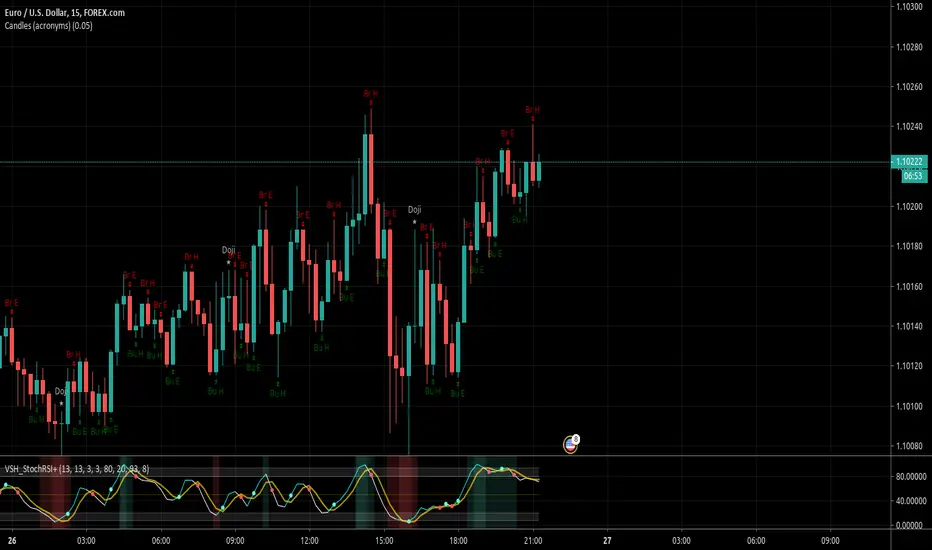
Candles (acronyms)Same script as "Candles" by TraderMentality but with acronyms for candle shape names.
Cuban's Candle ColouringUsing a complex combination of bullish/bearish candle structure (such as engulfings and breakouts) and moving averages, this indicator attempts to illustrate weakness and strength within a trending market.
Included are labels that highlight important breaks of micro structure levels.
The beauty of this script lies in the discretionary trading of 'mid-candle' colour changes, giving the trader a simple micro structure bias.
The white ( bullish ) and dark red ( bearish ) colours are the higher confluence indications of candle structure breakout and breakdown, with the grey (semi-bullish) and pink (semi-bearish) showing trend weakness.
The Golden PivotsThe Golden Pivots indicator is a combination of the following:
1. Central Pivot Range
2. Floor Pivots
3. Camarilla Pivots
4. Monthly, Weekly, Daily Highs and lows
5. Candlestick Setups
All the pivot calculations are based on Secret of Pivot Boss book by Frank Ochoa.
One can also view tomorrow's central pivot range by today end of the day.

Cuban's Candle ColouringUsing a complex combination of bullish/bearish candle structure (such as engulfings and breakouts) and moving averages, this indicator attempts to illustrate weakness and strength within a trending market.
Included are labels that highlight important breaks of micro structure levels.
The beauty of this script lies in the discretionary trading of 'mid-candle' colour changes, giving the trader a simple micro structure bias.
The white (bullish) and dark red (bearish) colours are the higher confluence indications of candle structure breakout and breakdown, with the grey (semi-bullish) and pink (semi-bearish) showing trend weakness.
Periodic CandleI have developed this indicator to be able to see the current day's candle. You can use any period that supported by TradingView. You can even shift the candle and plot the past days (period) candle.
Disclaimer: This is not financial advice
Trade safe,
Atilla

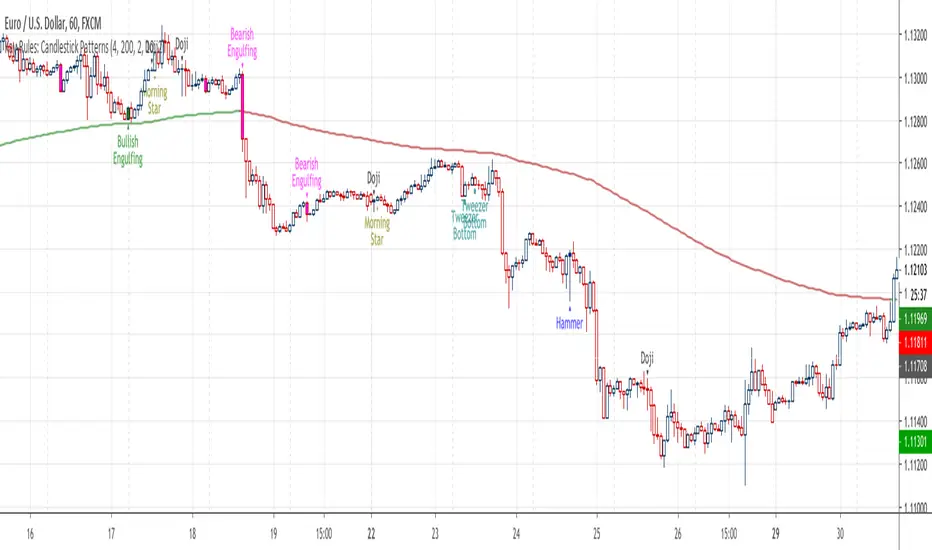
Kay-Rules: Candlestick PatternsThis indicator will mark 5 different candlestick patterns:
(1) bullish & bearish engulfing
(2) hammer & shooting star doji
(3) dragonfly & gravestone doji
(4) morning & evening star doji
(5) bottom & top tweezer
You may follow candlestick trading strategy by Rayner Teo here