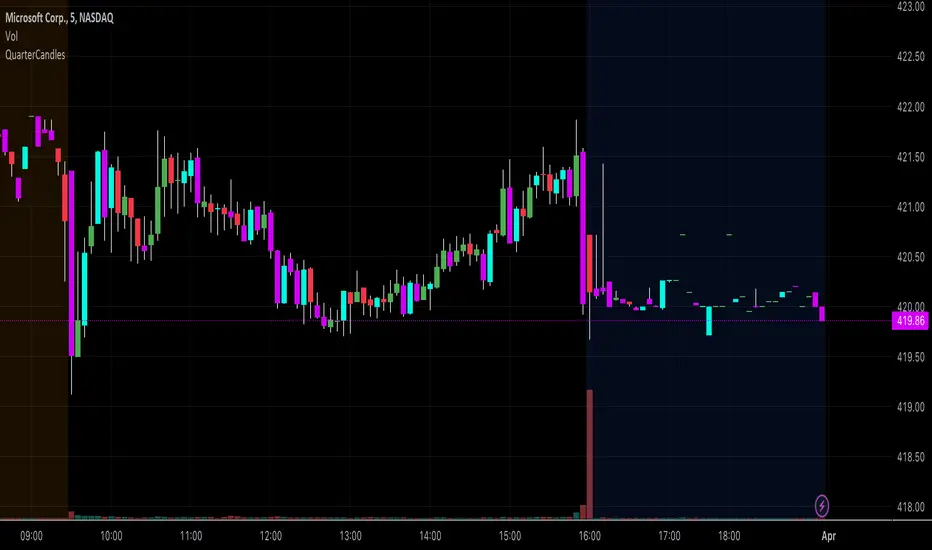
QuarterCandlesChanges candle color when close is within the top 25% or bottom 25% of candle range (High - Low) on the last candle update.
Due to limitations of barcolor command, I'd suggest that you turn OFF the candle borders (chart settings--> right click on chart --> settings -->symbol and uncheck the border option) to ensure that the bar color is easily identifiable.
Candlestickpattern
Truly Bullish & Bearish CandleThis Pine Script indicator identifies and highlights truly bullish and bearish candles on your chart. Truly bullish candles are characterized by a strong bullish close significantly above the specific percentage, suggesting strong buying pressure. Conversely, truly bearish candles exhibit a strong bearish close significantly below the specific percentage, indicating strong selling pressure. By identifying these candles, traders can gain insights into potential shifts in market sentiment and make more informed trading decisions.
Key Features:
Identifies truly bullish and bearish candles based on strong open/close differentials.
Highlights these candles on the chart for easy visualization.
Helps traders identify potential reversals or continuations in market trends.
Customizable parameters for fine-tuning to suit individual trading strategies.
Compatible with various timeframes and trading instruments.
Usage Instructions:
Apply the indicator to your chart.
Configure the settings according to your preferences.
Look for highlighted truly bullish and bearish candles as potential entry or exit signals.
Consider additional analysis and risk management strategies to confirm trading decisions.
Disclaimer: This indicator is provided for informational and educational purposes only. It is not intended as financial advice or trading recommendations. Trading involves risks, and it's essential to conduct thorough research and practice proper risk management techniques.

Morning & Evening Star [TradingFinder] Stock Indices Gap Candle🔵 Introduction
In "technical analysis", there are certain reversal patterns that alert us to a potential reversal of a stock's previous trajectory.
Two significant patterns in this regard are the "Morning Star" pattern and the "Evening Star" pattern, which are formed by a combination of three different candlesticks and are considered as reversal patterns.
Here, we will examine how to identify these patterns and how to respond to them.
🟣 Morning Star Pattern
This pattern forms at the end of a downtrend and indicates the beginning of an uptrend.
The pattern consists of three candlesticks in the following order :
1.A large bearish candlestick
2.A candlestick with a short body
3.A bullish candlestick
With the formation of the morning star pattern, it is expected that the stock price will change direction and continue to rise. Therefore, in such situations, it is advisable to enter a long position and follow the uptrend.
Signs of the morning star pattern :
•The first sign of this pattern is the presence of a small-bodied candlestick at the end of the trend, accompanied by a gap from the previous candlestick (a bearish candlestick with a large body). Therefore, the bodies of the first and second candlesticks do not overlap.
•The second candlestick indicates market confusion and uncertainty. The color of the middle candlestick is not significant.
•The third candlestick must be positive and have a higher price than the previous candlestick (i.e., the small-bodied candlestick).
•The closing price of the third candlestick must be higher than half of the first candlestick.
🟣 Evening Star Pattern
This pattern forms at the end of an uptrend and indicates the beginning of a downtrend.
The pattern consists of three candlesticks in the following order :
1.A large bullish candlestick
2.A candlestick with a short body
3.A bearish candlestick
With the formation of the evening star pattern, it is expected that the stock price will change direction and continue to fall. Therefore, in such situations where this pattern is identified, it is advisable to refrain from entering a long position.
If the stock is traded in a two-way market, it is possible to profit by taking a short position after the formation of the evening star pattern.
Signs of the evening star pattern :
•The first sign of this pattern is the presence of a small-bodied candlestick at the end of the trend, accompanied by a gap from the previous candlestick (a bullish candlestick with a large body). Therefore, the bodies of the first and second candlesticks do not overlap.
•The second candlestick indicates market confusion and uncertainty. The color of the middle candlestick is not significant.
•The third candlestick must be negative and have a lower price than the previous candlestick (i.e., the small-bodied candlestick).
•The closing price of the third candlestick must be lower than half of the first candlestick.
🔵 How to Use
The "Filter" and "Market" features are available in the settings section, allowing you to customize the output of the indicator according to your needs.
With the "Filter" feature, you can filter the "Morning Star" and "Evening Star" patterns as "strong" or "weak." The difference between strong and weak patterns lies in their "Candle Body."
In strong patterns, the candle bodies account for more than 80% of the total candle range, while in weak patterns, the bodies comprise between 60% to 80% of the candle range.
If the "Filter" feature is set to "On," only strong patterns will be displayed. If it's set to "Off," all patterns will be displayed. By default, it's set to "Off."
The "Market" feature allows you to include "gaps" in your pattern identification calculations. You can choose between "Forex" and "Stock" modes. In the Forex pattern, calculations are performed without considering gaps since there are fewer gaps in the Forex market.
If gap calculations were to be part of the pattern identification conditions, only a very small number of patterns would be identified. However, in the "Stock" mode, gaps are considered as part of the identification conditions.

Three Inside [TradingFinder] 3 Inside Up & Down Chart Patterns🔵 Introduction
"3 inside up" and "3 inside down" denote a duo of candlestick reversal patterns, each comprising three individual candles, commonly observed on candlestick charts.
These patterns manifest as a sequence of three candles, signaling a potential loss of momentum in the current trend and a potential reversal in direction.
This pattern consists of 3 consecutive candles and can be either "bullish" or "bearish".
In the bullish pattern, known as "Inside Up," emerging at the conclusion of a downtrend, the final candle must exhibit bullish characteristics, while the third candle from the end must display bearish traits.
Conversely, in the bearish pattern, termed "Inside Down," occurring at the culmination of an uptrend, the last candle must demonstrate bearish behavior, with the third candle from the end reflecting bullish attributes.
🔵 How to Use
Using this indicator is very simple. Filtering "Strong 3 Inside Bar" and "Weak 3 Inside Bar" is a feature available in the settings section. You can turn the filter "On" or "Off." By default, the "Filter" is set to "On."
" Filter: On ":
" Filter: Off ":
🔵 How to Display
For better display and differentiation of "Strong 3 Inside Bar" and "Weak 3 Inside Bar," when the "Filter: On" is active, the 3 Inside Bars are displayed in green and red colors. When the "Filter: Off" is active, the 3 Inside Bars are displayed in blue and black colors.

Wick %Heyo Fellas,
thanks for checking out my new indicator.
Introduction
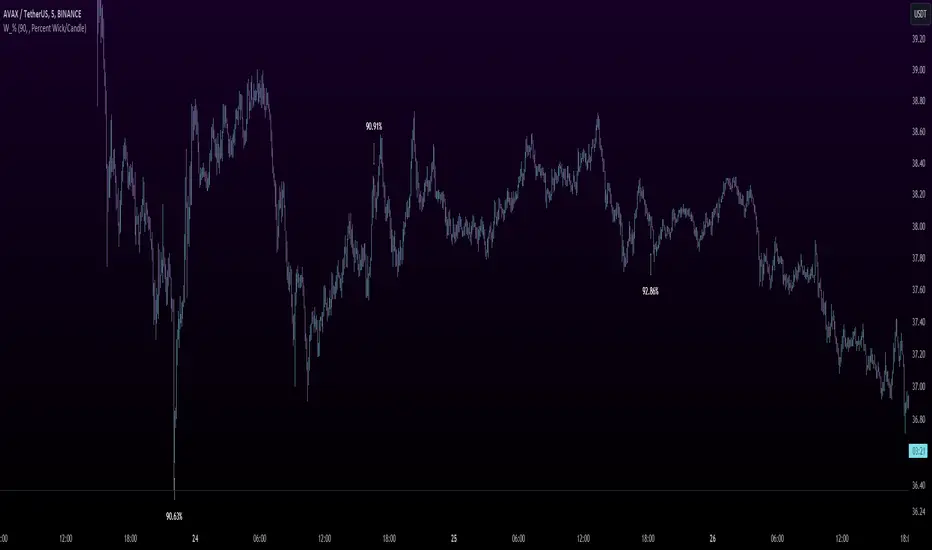
Wick % is a simple indicator to compare wick size with body size (mode 1) and to compare wick size with candle size (mode 2).
Upper wicks are bullish when close is higher than open pricen.
Lower wicks are bearish when close is lower than open price.
Wick Theory
In general, big wick and small bodie on a bar means that bull and bears are fighting heavily.
A big wick below the body means the bulls are leading in that fight,
and a big wick above the body means the bears are leading in that fight.
Calculation Formula
Mode 1 – Percentual Increase Wick/Body:
upperWickPercentage = (upperWick / body) * 100 - 100
lowerWickPercentage = (lowerWick / body) * 100 - 100
Mode 2 – Percent Wick/Candlestick:
upperWickPercentage = (upperWick / (high - low)) * 100
lowerWickPercentage = (lowerWick / (high - low)) * 100
Usage
You can use it on every symbol and every timeframe.
The indicator repaints by default, but you can disable it in the settings.
When you disable repaint, it moves the label one bar to the right.
If you want to use the indicator for signals, you must disable repainting.
Best regards,
simwai
Dark Cloud [TradingFinder] Piercing Line Reversal chart Pattern
🔵 Introduction
"Reversal candlestick patterns" are among the Japanese candlestick patterns considered as alerts for a potential change in the current price trend. It is often assumed that by identifying reversal candlestick patterns, the price trend will definitely change, either from bullish to bearish or from bearish to bullish. However, this claim is not entirely accurate, and a change in price trend does not always mean a reversal.
Nonetheless, the importance of reversal candlestick patterns remains significant. By recognizing these patterns, you can better predict changes in the trend with higher probability and make better trading decisions.
🔵 Dark Cloud
The "Dark Cloud" pattern occurs when, after an upward trend, buyers continue to drive the price up in the first candle. However, in the next candle, with sellers entering and increasing selling pressure, the price starts to decrease compared to the close of the previous candle.
This price decrease is significant enough that in the last candle, the price goes lower than the open of the previous candle, serving as a warning sign for a potential change in price trend.
The fundamental principles for the formation of the "Dark Cloud" pattern include :
1.Two candles consisting of a positive candle (first candle) and a negative candle (second candle) whose main body should be above the halfway point of the first candle's main body but does not completely cover it.
2.The color of the main body of the second candle should be opposite to the color of the main body of the first candle.
Factors affecting the strength of the "Dark Cloud" pattern include :
1.The length of the bodies of both candles, especially the second candle, which increases the strength of the pattern.
2.The gap between the two bodies can also indicate the strength of the pattern.
3.The absence of a lower shadow in the second candle also indicates the strength of the pattern.
4.If the pattern forms in a price resistance range, it has more strength.
🔵 Piercing Line
The "Piercing Line" pattern occurs when, after a downward trend, sellers decrease the price by offering their shares on the first day. However, on the next day, with buyers entering and increasing demand, the price starts to increase compared to the close of the previous day.
This increase is significant enough that in the last candle, the price goes higher than the open of the previous day, serving as a warning sign for a reversal in the price trend. Overall, this pattern is the opposite of the "Dark Cloud" pattern and occurs under a bearish trend.
The fundamental principles for the formation of the "Piercing Line" pattern include :
1.Two candles consisting of a negative candle (first candle) and a positive candle (second candle) whose main body should be above the halfway point of the first candle's main body but does not completely cover it.
2.The color of the main body of the second candle should be opposite to the color of the main body of the first candle.
Factors affecting the strength of the "Piercing Line" pattern include :
1.The length of the bodies of both candles, especially the second candle, which increases the strength of the pattern.
2.The gap between the two bodies can also indicate the strength of the pattern.
3.The absence of an upper shadow in the second candle also indicates the strength of the pattern.
4.If the pattern forms in a price support range, it has more strength.
🔵 How to Use
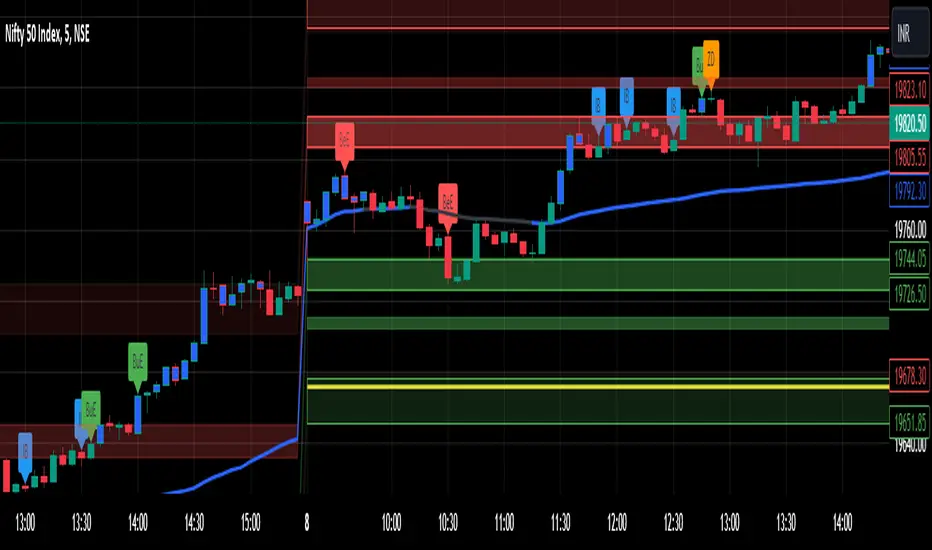
The "green circle" symbol corresponds to the "Strong Piercing Line" signal, the "blue triangle" symbol corresponds to the "Weak Piercing Line" signal, the "red circle" symbol corresponds to the "Strong Dark Cloud" signal, and the "red triangle" symbol corresponds to the "Weak Dark Cloud" signal.
🔵 Setting
Using the "Show Dark Cloud" and "Show Piercing Line" buttons, you can enable or disable the display of Dark Cloud and Piercing Line.

CandleStick [TradingFinder] - All Reversal & Trend Patterns🔵 Introduction
"Candlesticks" patterns are used to predict price movements. We have included 5 of the best candlestick patterns that are common and very useful in "technical analysis" in this script to identify them automatically. The most important advantage of this indicator for users is saving time and high precision in identifying patterns.
These patterns are "Pin Bar," "Dark Cloud," "Piercing Line," "3 Inside Bar," and "Engulfing." By using these patterns, you can predict price movements more accurately and therefore make better decisions in your trades.
🔵 How to Use
Pin Bar : This pattern consists of a Candle where "Open Price," "Close Price," "High Price," and "Low Price" form the "Candle Body," and it also has "Long Shadow" and "Short Shadow." In the visual appearance of the Pin Bar pattern, we have a candle body and a pin bar shadow, where the candle body is smaller relative to the shadow.
Just as the candle body plays an important role in analysis, the pin bar shadow can also be influential. The larger the pin bar shadow, the stronger the expectation of a trend reversal.
When a "bearish pin bar" occurs at resistance or the chart ceiling, it can be predicted that the price trend will be downward. Similarly, at support points and the chart floor, a "bullish pin bar" can indicate an upward price movement.
Additionally, patterns like "Hammer," "Shooting Star," "Hanging Man," and "Inverted Hammer" are types of pin bars. Pin bars are formed in two ways: bullish pin bars have a long lower shadow, and bearish pin bars have a long upper shadow. Important: Displaying "Bullish Pin Bar" is labeled "BuPB," and "Bearish Pin Bar" is labeled "BePB."
Dark Cloud : The Dark Cloud pattern is one type of two-candle patterns that occurs at the end of an uptrend. The 2-candle pattern indicates the shape of this pattern, which actually consists of 2 candles, one bullish and one bearish. This pattern indicates a trend reversal and is quite powerful.
The Dark Cloud pattern is seen when, after a bullish candle at the end of an uptrend, a bearish candle opens at a higher level (weakly, equal, or higher) than the closing point of the bullish candle and finally closes at a point approximately in the middle of the previous candle. In this indicator, the Dark Cloud pattern is identified as "Wick" and "Strong" .
The difference between these two lies in the strictness of their conditions. Important: Strong Dark Cloud is labeled "SDC," and Weak Dark Cloud is labeled "WDC."
Piercing Line : The Piercing candlestick pattern consists of 2 candles, the first being bearish and consistent with the previous trend, and the second being bullish. The conditions of the pattern are such that the first candle is bearish and a price gap is created between the two candles upon the opening of the next candle because its opening price is below (weakly equal to or less than) the closing price of the previous candle.
Additionally, its closing price must be at least 50% above the red candle.
This means that the second candle must penetrate at least 50% into the first candle. Important: Strong Piercing Line is labeled "SPL," and Weak Piercing Line is labeled "WPL."
3 Inside Bar (3 Bar Reversal) : The 3 Inside Bar pattern is a reversal pattern. This pattern consists of 3 consecutive candles and can be either bullish or bearish. In the bullish pattern (Inside Up) formed at the end of a downtrend, the last candle must be bullish, and the third candle from the end must be bearish.
Additionally, the close price must be more than 50% of the third candle from the end. In the bearish pattern (Inside Down) formed at the end of an uptrend, the last candle must be bearish, and the third candle from the end must be bullish. Additionally, the close price must be less than 50% of the third candle from the end. Important: Bullish 3 Inside Bar is labeled "Bu3IB," and Bearish 3 Inside Bar is labeled "Be3IB."
Engulfing : The Engulfing candlestick pattern is a reversal pattern and consists of at least two candles, where one of them completely engulfs the body of the previous or following candle due to high volatility.
For this reason, the term "engulfing" is used for this pattern. This pattern occurs when the price body of a candle encompasses one or more candles before it. Engulfing candles can be bullish or bearish. Bullish Engulfing forms as a reversal candle at the end of a downtrend.
Bullish Engulfing indicates strong buying power and signals the beginning of an uptrend. This pattern is a bullish candle with a long upward body that completely covers the downward body before it. Bearish Engulfing, as a reversal pattern, is a long bearish candle that engulfs the upward candle before it.
Bearish Engulfing forms at the end of an uptrend and indicates the pressure of new sellers and their strong power. Additionally, forming this pattern at resistance levels and the absence of a lower shadow increases its credibility. Important: Bullish Engulfing is labeled "BuE," and Bearish Engulfing is labeled "BeE."
🔵 Settings
This section, you can use the buttons "Show Pin Bar," "Show Dark Cloud," "Show Piercing Line," "Show 3 Inside Bar," and "Show Engulfing" to enable or disable the display of each of these candlestick patterns.

Liquidation Levels with Liquidity Sweeps/Breakouts [AlgoAlpha]🌊📈 Dive into the depths of market liquidity with "Liquidation Levels with Liquidity Sweeps/Breakouts" - your ultimate tool for navigating the turbulent waters of trading! 🧹💹 Crafted by the wizards at AlgoAlpha, this Pine Script™ masterpiece illuminates the unseen liquidity levels and sweeps, guiding you through the financial seas with insight. 🚀🔍
Key Features:
🕒 Timeframe Flexibility: Customize your analysis with a TimeFrame Multiplier, allowing the indicator to operate on higher timeframes for broader market insight.
💥 Dynamic Volume Threshold: Set your sensitivity to breakouts with the High Volume Threshold, ensuring you catch significant market movements while avoiding fakeouts.
👀 Visibility Controls: Toggle the display of swept liquidity and highlight liquidity breakouts with customizable background colors for clear, actionable insights.
🎨 Custom Appearance: Personalize your chart with bullish, bearish, and breakout colors to match your trading style.
How to Use the Liquidity Levels with Liquidation Sweeps Indicator:
Maximize your trading efficiency with the Liquidity Levels with Liquidation Sweeps Indicator by following these simple steps! 🚀🌟
⚙️ Customize Settings: Access the indicator settings to personalize the TimeFrame Multiplier, High Volume Threshold, and Relative Volume Period. Tailor these settings to match your trading strategy and chart preferences.
👁️ Analyze Liquidity Levels: Monitor the chart for liquidity levels and sweeps. Bullish sweeps are marked with green labels, bearish sweeps with red, and breakouts highlighted by the chart background.
🔔 Set Alerts: Enable alert conditions for liquidity breakouts and sweeps within the indicator's settings. This feature allows you to receive real-time notifications, helping you to act promptly on trading opportunities.
How It Works:
The heart of this indicator lies in its ability to track and highlight liquidity levels derived from swing pivots, and sweeps across multiple timeframes. By calculating relative volume against a user-defined threshold, it identifies strong volume movements indicative of liquidity breakouts, this helps filter out fake-outs. When a liquidity level is breached but not completely mitigated, it's either marked as a bullish or bearish sweep, which come with the option to show an estimate of the number of liquidations during the sweep.
if peakform and peakprinted != 1
aR.push(line.new(bar_index-mult, h.get(1), bar_index+1, h.get(1), color = red))
aRv.push(h.get(1))
peakprinted := 1
if valleyform and valleyprinted != 1
aS.push(line.new(bar_index-mult, l.get(1), bar_index+1, l.get(1), color = green))
aSv.push(l.get(1))
valleyprinted := 1

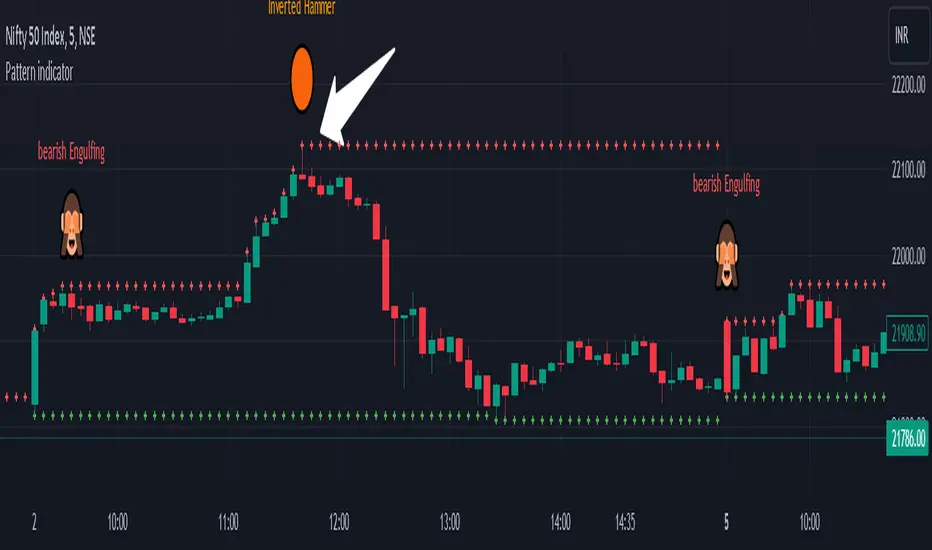
Pattern indicatorRules are pretty simple for this indicator .we are searching candlestick pattern on current day high and low ..
*** Candlestick we are looking for ***
1) Bullish/Bearish Engulfing 2) Bearish/Bullish Harami 3)Hammer/Inverted Hammer
Rule for searching bullish candlestick ====>
1) searching for current day high and day low
2) looking for candlestick as Bullish Engulfing or Bullish Harami or Hammer
3) if we got both rule 1 and rule 2 we are getting label ex- bullish engulfing
4) we can Enable/Disable Candlestick we don't want to search
Rule for bearish candles ====>
1) searching for current day high and day low
2) looking for candlestick as Bearish Engulfing or Bearish Harami or inverted hammer
3) if we got both rule 1 and rule 2 we are getting label ex- bullish engulfing
4) we can Enable/Disable Candlestick we don't want to search
Note -- i have created all indicator calculation ....
Disclaimer: market involves significant risks, including complete possible loss of funds. Consequently trading is not suitable for all investors and traders. By increasing leverage risk increases as well.With the demo account you can test any trading strategies you wish in a risk-free environment. Please bear in mind that the results of the transactions of the practice account are virtual, and do not reflect any real profit or loss or a real trading environment, whereas market conditions may affect both the quotation and execution
Candlesticks Patterns [TradingFinder] Pin Bar Hammer Shooting🔵 Introduction
Truly, the title "TradingView" doesn't do justice to this excellent website, and that's why I've written about its crucial aspect. In this indicator, the identification of all candlesticks known as "Pin bars" is explored.
These candlesticks include the following:
- Hammer : A Pin bar formed at the end of a bearish trend, with its body being either bearish or bullish.
- Shooting Star : Formed at the end of a bullish trend, with its body being either bearish or bullish.
- Hanging Man : Formed during an upward trend, characterized by a candle with a lower shadow.
- Inverted Hammer : Formed during a downward trend, characterized by a candle with an upper shadow.
🟣 Important : For ease of use, we refer to these four candlestick patterns as Pin Bars and categorize them into the main friends "Bullish" and "Bearish."
🟣 Important : In all sources, Hanging Man and Inverted Hammer are referred to as "Reversal candles." However, in reality, whenever they appear after breaking a significant area (Break Out), we expect these candles to signal a continuation of the trend and confirmation in the direction of the trend.
🟣 Important : One of the best signs of market manipulation and entry by market giants is the "Ice Berg." So, it provides one of the best trading opportunities.
🔵 Reason for Creation
Many traders, especially volume traders, use Pin bars as confirmation and enter the market after their occurrence. In this indicator, all four patterns are identified and displayed in a colored candle format, using "triangle" and "circle."
When they are evident on the chart, directly or by drawing a horizontal line, they give us good alerts for reversal or continuation areas.
🔵 Information Table
1. Red circle: Pin bars formed in a downtrend.
2. Blue circle: Bullish Pin bars formed in an uptrend.
3. Black triangle: Bearish Pin bar candle in an uptrend.
4. Blue triangle: Bullish Pin bar candle in a downtrend.
🔵 Settings
Trend Detection Period: A special feature that considers smaller or larger fluctuations. If individual price waves need to be considered, use lower numbers; if the overall trend direction is desired, use larger numbers (e.g., 5-7 or higher). This precisely sets the Zigzag or Pivot format, not displayed but considered in the indicator calculation.
Trend Effect : By changing the Trend Effect status to "Off," all Pin bars, whether bullish or bearish, are displayed regardless of the current market trend. If the status remains "On," only Pin bars in the direction of the main market trend are shown.
🟣 Important : Black triangles "Number 3" and blue triangles "Number 4" displayed in the information table section, as explained in the "Information Table" section.
Show Bullish Pin Bar : When set to "Yes," displays bullish Pin bars; when set to "No," does not display them.
Show Bearish Pin Bar : When set to "Yes," allows the display of bearish Pin bars; when set to "No," does not display them.
Bullish Pin Bar Setting : Using the "Ratio Lower Shadow to Body" and "Ratio Lower Shadow to Higher Shadow" settings, you can customize your bullish Pin bar candles. Larger numbers impose stricter conditions for identifying bullish Pin bars.
Bearish Pin Bar Setting : Using the "Ratio Higher Shadow to Body" and "Ratio Higher Shadow to Lower Shadow" settings, you can customize your bearish Pin bar candles. Larger numbers impose stricter conditions for identifying bearish Pin bars.
Show Info Table : Allows the display or non-display of the information table (located at the bottom of the page and on the right side).
🔵 How to Use
At the end of a downtrend, look for "Hammer" candles, easily identified one by one.
To identify the "Shooting Star" candle pattern at the end of an uptrend; expect a price reversal in the downtrend.
For trades in the downward direction, wait for the formation of an "Inverted Hammer" Pin bar.
And finally, in an uptrend, where a "Hanging Man" candle can form.
🔵 Features
For better visualization, triangles and circles are used above the candles, but they can be easily removed. All Pin bars are displayed in color with the following meanings:
- Black-bodied candle: Inverted Hammer
- Turquoise blue candle: Hammer
- Pink candle: Hanging Man
- Red candle: Shooting Star
🟣 Important : The capability to detect the powerful two-candle pattern "Tweezer Top" at the end of an uptrend emerges by forming two "Shooting Star" candles side by side.
Similarly, the two-candle pattern "Tweezer Bottom" is created at the end of a downtrend with the formation of two "Hammer" candles side by side. To identify the "Tweezer" pattern, make sure the settings in the "Trend Effect" section are set to "Off."
🟣 Auxiliary Indicators
During the start of trading sessions such as Asia, London, and New York, where the highest liquidity exists, alongside this indicator, you can use the Trading Sessions indicator.
Sessions
The combination of Order Blocks "-OB" and "+OB" with candles is one of the best trading methods. The indicator that identifies order blocks, along with this indicator, can yield remarkable results in the success of Pin bar candles.
Order Blocks Finder
The trading toolset "TFlab" presents this indicator. To benefit from all indicators, we invite you to visit our page " TFlab Scripts ".

Enhanced Candle Sticks [AlgoAlpha]🚀🌟 Introducing the Enhanced Candle Sticks by AlgoAlpha, a Pine Script tool designed to provide traders with an enhanced view of market dynamics through candlestick analysis. This script aims to visualise if price has hit the high or low of the candle first, aiding in back-testing, and to identify smaller trends using market structure.📊🔍
Key Features:
Timeframe Flexibility: Users can select their desired timeframe for analysis, offering a range of options from M15 to H12. This flexibility allows for detailed and specific timeframe analysis.
Micro Trend Identification: The script includes an option to enable 'MicroTrends', giving traders insights into smaller movements and trends within the larger market context.
Customizable Visuals: Traders can customize the colors of bullish and bearish candlesticks, enhancing visual clarity and personalizing the chart to their preferences.
State Tracking: The script tracks the 'state' of the market on lower timeframes to detect if the high or the low was formed first.
Warning System: When the selected timeframe does not match the chart timeframe, the script generates a warning, ensuring accurate analysis and preventing potential misinterpretations.
Usages:
Enhanced Back-testing: Users can now get a more accurate interpretation of the candlesticks by know if the high or the low came first (denoted with ⩚ or ⩛), especially in scenarios where the high and the low of the larger timeframe candle is touching both the take-profit and stop-loss levels.
Squeeze Analysis: Users can identify squeezes in price when the microtrend shows both an uptrend and a downtrend, possibly giving more insight into the market.
Lower Timeframe Market Structure Analysis: Microtrends form when the low of the candle is consecutively increasing and the high is consecutively falling, which means on a lower timeframe, price is forming higher lows or lower highs.
Basic Logic Explanation:
- The script starts by setting up the necessary parameters and importing the required library. Users can customize the timeframe, colors, and whether to enable micro trends and candlestick plotting.
- It then calculates the lower timeframe (1/12th of the current timeframe) for more detailed analysis. The `minutes` function helps in converting the selected timeframe into minutes.
- The script tracks new bars and calculates the highest and lowest values within an hour, using `ta.highestSince` and `ta.lowestSince`.
- It determines the market 'state' by checking if the current high is breaking the previous high and if the current low is breaking the previous low on lower timeframes to determine if the high or the low was formed first.
- The script uses the `plotchar` and `plotcandle` functions to visually represent these trends and states on the chart. This visual representation is key for quick and effective analysis.
Alerts:
Alerts can be set for microtrend formations:
This script is a valuable tool for traders looking to deepen their market analysis with enhanced candlestick visualization and micro trend tracking. 📈🔶💡

Doji Candle _ ThaerAbusalahIdentify doji candles in heikin ashi .
the indicator will search for a doji candles that are same in upper and lower wick by 50% and more .

Directional Bias [AlgoAlpha]The Directional Bias indicator is a premium script expertly crafted to enhance market trend visualization on trading charts. This sophisticated tool is designed to intuitively indicate the market's directional bias, aiding traders in making informed decisions on lower time frames.
Highlighted Features:
Intuitive Trend Visualization: The script employs a color-coded system for candles, simplifying the process of trend identification
Customizable Aesthetics: Users have the option to personalize the visual elements, including candle colors, to suit their preferences and enhance chart readability.
Advanced Logic: The script is built on a proprietary algorithm that analyzes candlestick patterns to determine the current trend direction.
Key Benefits:
Enhanced Decision Making: By offering a clear depiction of the market's directional bias, the indicator assists traders in making more informed entry and exit decisions, particularly suited for quick decision-making on lower timeframes.
Adaptability to Market Conditions: The script dynamically adjusts to changing market conditions, providing relevant and timely indications of trend changes or continuations.
Versatile Application: Suitable for various trading styles, the indicator can be effectively used in day trading, scalping, or even in longer-term trading strategies, depending on the timeframe selected.
Summary:
The "Directional Bias" indicator stands out as a vital tool for traders focusing on lower timeframes, offering an intuitive, customizable, and dynamic approach to trend visualization. Its advanced proprietary logic and user-friendly interface make it a valuable asset in a trader's toolkit, enhancing the ability to quickly interpret and react to market movements.

Trend-based Price Action StrategyThis is a strategy script that combines trend-based price action analysis with the Relative Strength Index (RSI) and Exponential Moving Averages (EMA) as trend filters. Here's a summary of the key components and logic:
Price Action Candlestick Patterns:
Bullish patterns: Engulfing candle and Morning Star.
Bearish patterns: Engulfing candle and Evening Star.
RSI Integration:
RSI is used to identify overbought and oversold conditions.
EMA Trend Filter:
Three EMAs with different periods: Fast , Medium and Slow.
Long trend condition occur when the fast EMA is above the medium and the medium is above the slow EMA.
Short trend condition occur when the slow EMA is above the medium and the medium is above the fast EMA.
Long entry conditions: RSI is oversold, RSI is decreasing, bullish candlestick pattern, and EMA trend filter conditions are met.
Short entry conditions: RSI is overbought, RSI is decreasing, bearish candlestick pattern, and EMA trend filter conditions are met.
Exit conditions:
Take profit or stop loss is reached.
Plotting:
Signals are plotted on the chart when entry conditions are met.
EMAs are plotted when the EMA trend filter is enabled.
This script aims to capture potential trend reversal points based on a combination of candlestick patterns, RSI, and EMA trend analysis.
Traders can use this script as a starting point for further customization or as a reference for developing their own trading strategies. It's important to note that past performance is not indicative of future results, and thorough testing and validation are recommended before deploying any trading strategy.

Japanese Candle Patterns Detector in Potential Price ZoneThis script would find the 8 famous "Japanese Candle Stick Patterns" in your chart.
Please be aware it find patterns in "Potential price zones" only, which help you to avoid none-important patterns during a price trend.
I used RSI and ATR in my codes to find best candle forms and price conditions.
*** This indicator shared before but without source code. According to follow requests, I publish it again with source codes. I hope it helps you in trading journey...
Bellow patterns are detecting:
Hammer | ShootingStar | Engulfing Candle | Doji | Tweezers Top/Buttom | Three White Soldiers/Three Black Crows | Marubozu | Harami
* You can select your preferred patterns from indicator setting.
* Pattern names are abbreviated for better view on chart.
* Separate alerts for different type of candles for whom looking for a specific candle pattern
* Main alert which notify about every kind of candle patterns detect in a chart

Flat Combo DetectorFlat Combo Detector (FCD)
Introduction:
The Flat Combo Detector is a unique tool crafted to aid traders in identifying potential trend reversals. Unlike standard indicators that primarily focus on moving averages or oscillators, the FCD bases its signals on specific candlestick patterns that manifest at crucial trend pivot points.
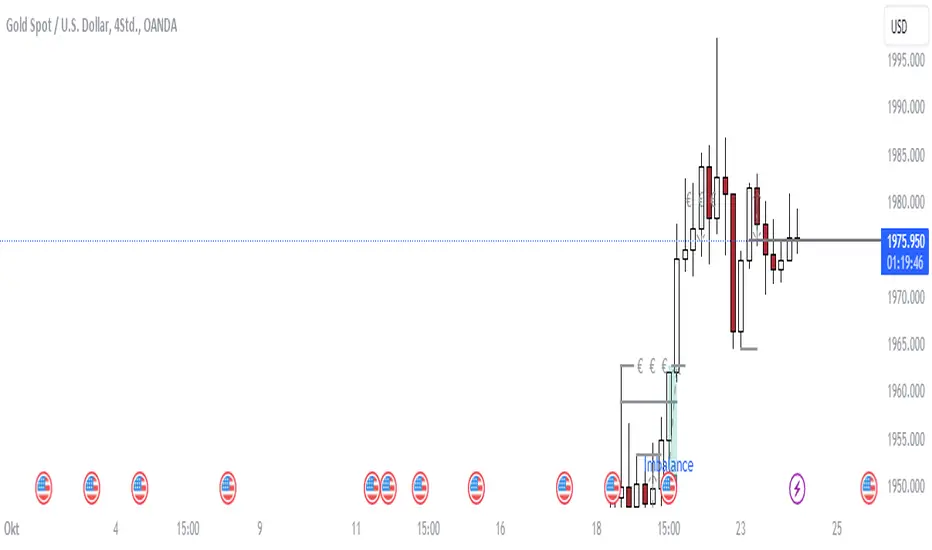
I use it mostly on OANDA:XAUUSD Gold
How It Works:
The logic of the Flat Combo Detector revolves around the formation of consecutive bearish and bullish candles with particular attributes:
Bearish to Bullish Transition:
Primary Candle : A bearish candle where the close is lower than the open and its close is equal to its low.
Following Candle: A bullish candle where the close is higher than the open, and the open approximates its low (within a user-defined tolerance).
Signal : A green triangle plotted below the price bar, indicating a potential shift from a bearish to bullish trend.
Bullish to Bearish Transition:
Primary Candle: A bullish candle where the close is higher than the open and equals its high.
Following Candle : A bearish candle where the close is lower than the open, and the open approximates its high (within a user-defined tolerance).
Signal : A red triangle plotted above the price bar, indicating a potential transition from a bullish to bearish trend.
Usage Guidance:
For traders unfamiliar with Pine Script, using this indicator is straightforward. Once added to the chart, look for the green and red triangle signals. A green triangle below a price bar suggests a possible bullish reversal, while a red triangle above a price bar hints at a potential bearish reversal. Always consider these signals in conjunction with other technical analysis tools and the broader market context to optimize decision-making.
Associated Strategy:
I've also developed a trading strategy that utilizes these specific entry points identified by the FCD. If you find the signals from this indicator helpful, you might also be interested in exploring the strategy for a comprehensive trading approach. Always remember to backtest and validate any strategy before live trading.
Chart Presentation:
The published chart associated with this script has been kept clean to ensure clarity. Users will only observe the main price bars/candles along with the green and red triangle signals generated by the FCD.
Conclusion:
The Flat Combo Detector provides traders with a fresh perspective on trend reversal points. Its focus on specific candlestick patterns makes it a valuable tool, especially when used in combination with other technical indicators. Always ensure to practice prudent risk management and consult multiple analysis methods before making trading decisions.
Strong Pullback Indicator [Rami_LB]Strong Pullback Indicator
Description:
The Strong Pullback Indicator is designed to identify potential pullbacks or even trend reversals by utilizing a specific candlestick pattern in conjunction with the Relative Strength Index (RSI). It is advised to employ this indicator in chart intervals of 15 minutes or higher, as intervals below 15 minutes may generate excessive false signals.
Working Mechanism:
Upon detecting the designated candlestick pattern, the indicator examines whether any of the last five candles exhibit RSI values below 30 or above 70 across at least four distinct time intervals, depending on whether the pattern is bullish or bearish. The RSI calculations incorporate eight different intervals: 1 minute (1m), 5 minutes (5m), 15 minutes (15m), 30 minutes (30m), 1 hour (1h), 2 hours (2h), 4 hours (4h), and 1 day (1d). An arrow is rendered above or below the current candle only when these conditions are met.
Users have the option to adjust the number of overbought or oversold intervals, as well as the general settings for the RSI.
SL/TP Lines:
The indicator can also serve as a trade signal to initiate trades in the opposite direction. To evaluate the potential success of a trade in a backtesting scenario, SL (Stop Loss) and TP (Take Profit) lines can be displayed on the chart. The SL is calculated by taking the distance from the close of the current candle to the high/low of the previous candle and multiplying it by 2.
In the settings, you can alter the Risk Reward Ratio (RRR) of the trade. Given the pullback nature of this indicator, a RRR of 1:1 is deemed logical, thus set as the default value.
Bullish vs. Bearish Candle Counter:
An additional feature of this indicator is its ability to analyze the last 100 candles to ascertain the ratio of bullish to bearish candles. When a 60% threshold is reached, the chart background color alters accordingly. This feature was conceived after a thorough analysis of over 50,000 candles of a currency pair revealed nearly identical counts of bullish and bearish candles, suggesting a market tendency to maintain this balance.
Within the settings, you have the flexibility to modify the number of candles to be analyzed and the percentage threshold for each candle type.
Should you have any ideas on how to enhance the accuracy of this indicator, or suggestions for other indicators that could improve the signals, feel free to leave a comment.

Liquidity Hunter [ChartPrime]The Liquidity Hunter helps traders identify areas in the market where reversals may occur by analyzing candle formations and structures.
█ Wick-to-Body Analysis:
The Liquidity Hunter analyses each candlestick to identify those with distinctive wick-to-body ratios. By focusing on candles with significant wick imbalances, it can reveal potential liquidity absorption zones that may influence market behavior. Users can fine-tune this ratio to their preferences through customizable body% and wick% inputs, allowing for tailored analysis.
█ Body Size Significance:
To ensure the relevance and impact of its findings, this indicator evaluates the size of the candle body.
Only candles with bodies meeting a certain size threshold are considered, eliminating noise and highlighting candles of significance.
█ Dynamic Target Setting:
The Liquidity Hunter employs the Average True Range (ATR) as a foundation for target calculation. Users can adjust their trading targets by specifying a multiplier, offering flexibility in capturing potential profit or managing risk. Customizable target inputs ensure adaptability to your trading strategy.
█ Stop Loss Protection:
In addition to setting your profit targets, the Liquidity Hunter incorporates stop loss levels, safeguarding your investments from excessive risk. By implementing a well-balanced risk-reward ratio, users may be better at navigating market fluctuations.
█ Market Character Labels:
The Liquidity Hunter Indicator goes beyond basic analysis by detecting changes in market character. It identifies shifts in sentiment providing traders with invaluable insights into evolving market conditions.
█ Candle Color Highlighting:
To enhance user-friendliness and visualization, the indicator employs distinctive candle colors between trades. These color cues help you easily spot and interpret trading opportunities, drawing your attention to potential entry and exit points.
Overall this indicator is designed to help simplify liquidity analysis and give visual targets in a market.

[Holy] Candle BlocksThis experimental indicator overlays candles from higher timeframes directly onto your current chart. The concept of Candle Blocks aims to offer an intuitive way to view price action across multiple periods simultaneously.
FEATURES
Multiple Timeframe Support: Choose from various timeframes to overlay, such as hourly, daily, weekly, etc.
Customizable Opacity: Adjust the transparency of the overlay to ensure the primary chart remains visible.
Color Coding: The overlay uses distinct colors to indicate bullish and bearish candles from the higher timeframe.
Real-time Update: The overlay updates in real-time as new higher timeframe candles are formed.
USE CASES
Trend Confirmation: Validate the trend direction of your primary timeframe by examining higher timeframe Candle Blocks.
Support & Resistance: Identify key support and resistance levels more clearly by seeing them on multiple timeframes.
Fourth-Dimensional Decision Making: This indicator aims to move towards a 4th-dimensional trading perspective, where time is considered as a vector. This helps traders to always make decisions with multiple timeframes in mind.
EXPERIMENTAL
This indicator is in its experimental stage, and future updates will be made based on its effectiveness and the feedback received. If you find this concept useful or have suggestions for improvement, please provide feedback. This will aid in further development and refinement of the indicator.

PERFECT ENGULFING Candlestick Patterns by AnmolWill add some more patterns and conditions in it in future, for now its for detecting PERFECT Engulfings only.
Use these Engulfing to take a trade when it get detected on support/resistance
Engulfing and emaThis is a Pine Script script that helps you see the Engulfing Candlestick and Inside Bar (Boring Candle) candle patterns on the TradingView chart, as well as drawing two Exponential Moving Averages (EMA). Here's a simple explanation:
1. **Candle Pattern**:
- This script identifies the Engulfing Candlestick pattern, which indicates potential changes to the price. If this pattern is detected, the script will show a green (for buy) or red (for sell) arrow above or below that candle.
- The script also identifies the Inside Bar (Boring Candle), which indicates the period area in the market. This candle will be the color you choose (default is orange).
2. **Moving Average (EMA)**:
- This script also plots two Exponential Moving Averages (EMA) on the chart. EMA is a tool that helps you see price trends more clearly.
3. **Risk Management**:
- This script calculates the Stop Loss (SL) and Take Profit (TP) levels for each Engulfing pattern. This helps you manage your trading risks.
- Labels are displayed on the charts for SL and TP, so you know where to place them.
With the help of this script, you can easily identify important patterns in the market and manage your risks better. Make sure to choose a demo account before using it in real trading.

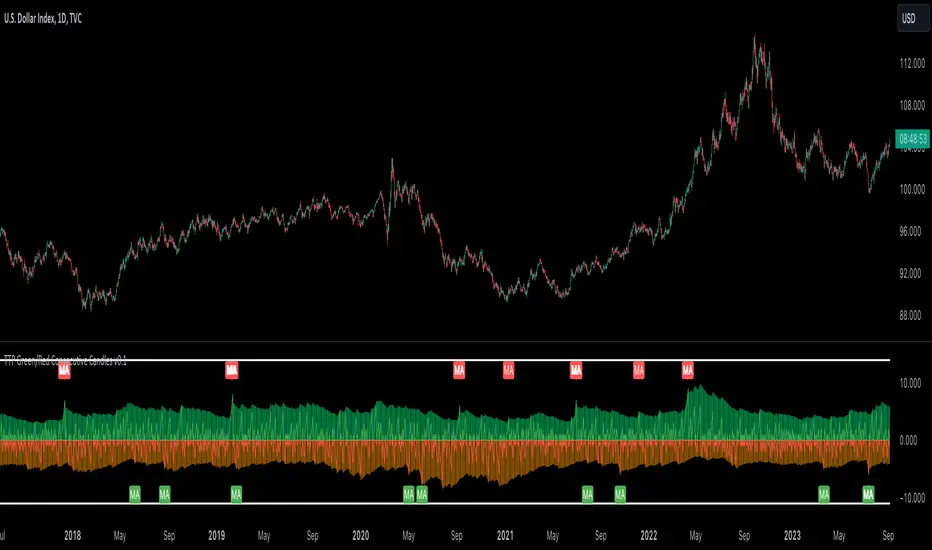
TTP Green/Red Consecutive CandlesThis indicator counts consecutive green/red candles offering some basic statistics and signals/alerts.
Features
- Counts consecutive green/red candles in an oscillator chart
- Moving average of the counting helps spotting when the consecutive candles are away from the mean. MA length and multiplier to adjust the signal sensitivity.
- Thresholds can be set to backtest and send alerts on any number of arbitrary consecutive candles of the same color.
- All time highs: the indicator keeps track of when the maximum has been reached
- Distribution data: the number of times each number of consecutive color candles has been reached is offered
Signals
- Threshold signal triggers when the number of candles of the same color is above the specified threshold.
- MA cross signal triggers when the number of candles of the same color is above the MA.
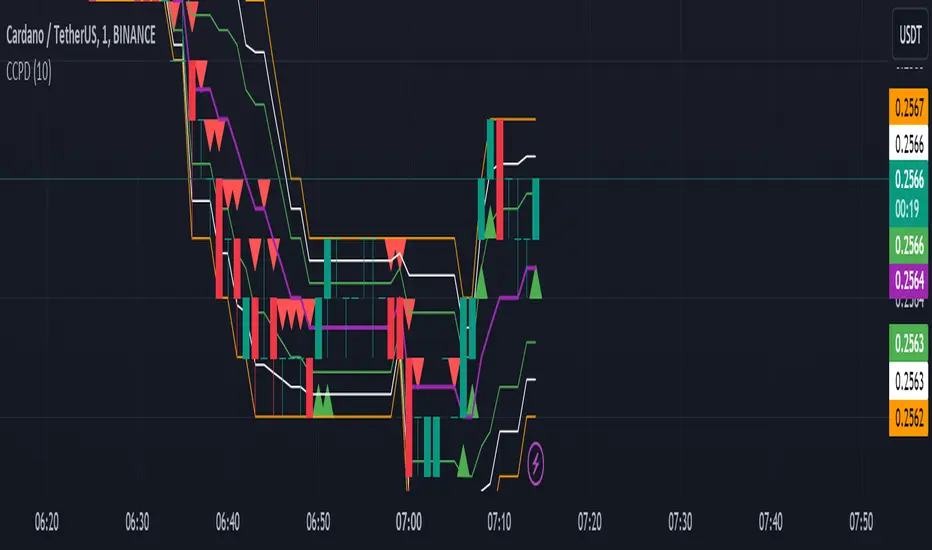
CCPD Candle Color Price DetectorThe "CCPD Candle Color Price Detector" is a custom indicator developed for TradingView, a popular platform for technical analysis and trading. This indicator assists traders in identifying potential trend reversals and assessing market sentiment based on candlestick color changes and key price levels.
This indicator operates as follows:
Color Change Detection: It primarily focuses on the color of candlesticks (green for bullish and red for bearish). When a candlestick closes higher than it opens, it is considered green (bullish), and when it closes lower, it is red (bearish).
High and Low Analysis: The indicator calculates the highest high and lowest low over a user-defined number of bars (specified by the 'Bars for High/Low' input parameter). This helps identify recent price extremes.
Midpoint Calculation: It then computes the midpoint between the highest high and lowest low, effectively determining a central reference point within the specified period.
Signal Generation: Buy and sell signals are generated based on the relationship between the current candlestick's close price, the midpoint, and the candlestick color. Buy signals occur when a green candle closes above the midpoint, suggesting potential bullish momentum. Conversely, sell signals trigger when a red candle closes below the midpoint, indicating possible bearish pressure.
Visualization: The indicator visualizes the highest high, lowest low, midpoint, and additional lines to aid in understanding the price action and potential reversal points.
Alerts: It provides alerts for buy and sell signals, allowing traders to receive notifications when potential trading opportunities arise.
Usage:
Traders can utilize the "CCPD Candle Color Price Detector" in the following ways:
Trend Reversal Identification: This indicator can help traders spot potential trend reversals by signaling when candlestick colors change and close near the midpoint. Buy and sell signals offer entry points for trades based on these reversals.
Confirmation Tool: It can be used in conjunction with other technical analysis tools to confirm trading decisions. For example, a buy signal from this indicator, coupled with a bullish trendline break or a bounce from a key support level, may provide a stronger bullish signal.
Risk Management: By understanding potential reversal points and using stop-loss orders, traders can better manage their risk and protect their capital when entering positions based on the indicator's signals.
Customization: The indicator allows users to adjust the number of bars for high/low calculations, making it adaptable to different trading strategies and timeframes.
In summary, the "CCPD Candle Color Price Detector" is a versatile indicator that can aid traders in spotting potential trend changes, enhancing trading decisions, and managing risk effectively. However, like any trading tool, it should be used in conjunction with other analysis methods and risk management strategies for optimal results.