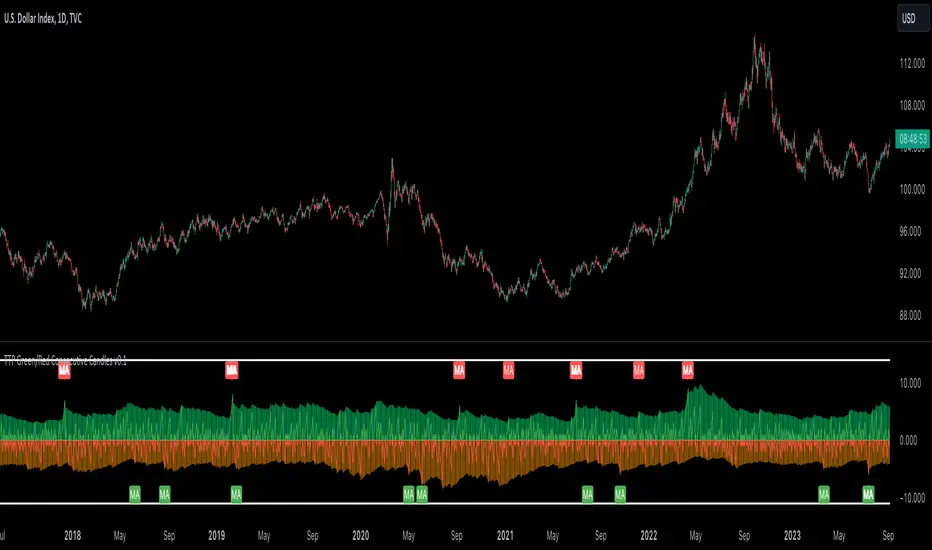
TTP Green/Red Consecutive CandlesThis indicator counts consecutive green/red candles offering some basic statistics and signals/alerts.
Features
- Counts consecutive green/red candles in an oscillator chart
- Moving average of the counting helps spotting when the consecutive candles are away from the mean. MA length and multiplier to adjust the signal sensitivity.
- Thresholds can be set to backtest and send alerts on any number of arbitrary consecutive candles of the same color.
- All time highs: the indicator keeps track of when the maximum has been reached
- Distribution data: the number of times each number of consecutive color candles has been reached is offered
Signals
- Threshold signal triggers when the number of candles of the same color is above the specified threshold.
- MA cross signal triggers when the number of candles of the same color is above the MA.
Candlestickpattern
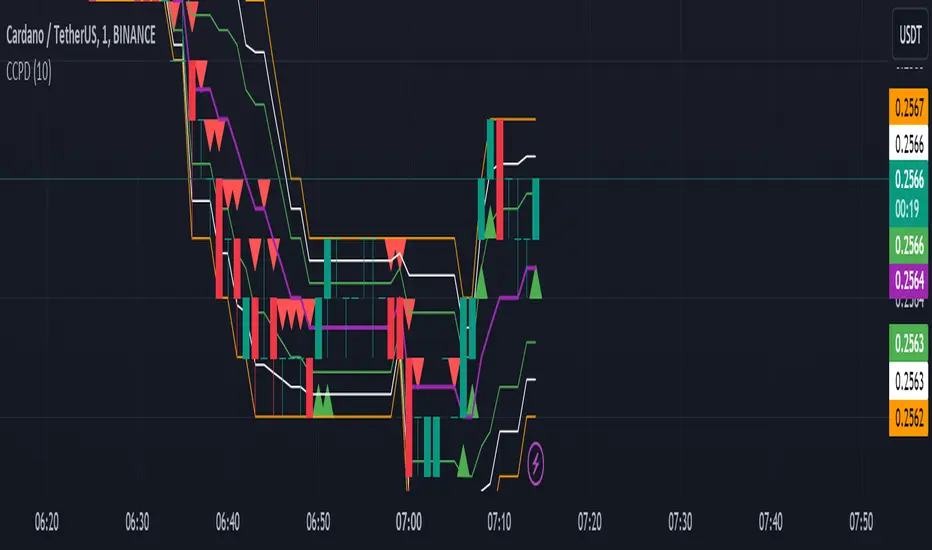
CCPD Candle Color Price DetectorThe "CCPD Candle Color Price Detector" is a custom indicator developed for TradingView, a popular platform for technical analysis and trading. This indicator assists traders in identifying potential trend reversals and assessing market sentiment based on candlestick color changes and key price levels.
This indicator operates as follows:
Color Change Detection: It primarily focuses on the color of candlesticks (green for bullish and red for bearish). When a candlestick closes higher than it opens, it is considered green (bullish), and when it closes lower, it is red (bearish).
High and Low Analysis: The indicator calculates the highest high and lowest low over a user-defined number of bars (specified by the 'Bars for High/Low' input parameter). This helps identify recent price extremes.
Midpoint Calculation: It then computes the midpoint between the highest high and lowest low, effectively determining a central reference point within the specified period.
Signal Generation: Buy and sell signals are generated based on the relationship between the current candlestick's close price, the midpoint, and the candlestick color. Buy signals occur when a green candle closes above the midpoint, suggesting potential bullish momentum. Conversely, sell signals trigger when a red candle closes below the midpoint, indicating possible bearish pressure.
Visualization: The indicator visualizes the highest high, lowest low, midpoint, and additional lines to aid in understanding the price action and potential reversal points.
Alerts: It provides alerts for buy and sell signals, allowing traders to receive notifications when potential trading opportunities arise.
Usage:
Traders can utilize the "CCPD Candle Color Price Detector" in the following ways:
Trend Reversal Identification: This indicator can help traders spot potential trend reversals by signaling when candlestick colors change and close near the midpoint. Buy and sell signals offer entry points for trades based on these reversals.
Confirmation Tool: It can be used in conjunction with other technical analysis tools to confirm trading decisions. For example, a buy signal from this indicator, coupled with a bullish trendline break or a bounce from a key support level, may provide a stronger bullish signal.
Risk Management: By understanding potential reversal points and using stop-loss orders, traders can better manage their risk and protect their capital when entering positions based on the indicator's signals.
Customization: The indicator allows users to adjust the number of bars for high/low calculations, making it adaptable to different trading strategies and timeframes.
In summary, the "CCPD Candle Color Price Detector" is a versatile indicator that can aid traders in spotting potential trend changes, enhancing trading decisions, and managing risk effectively. However, like any trading tool, it should be used in conjunction with other analysis methods and risk management strategies for optimal results.
Incomplete Session Candle - Incomplete Timeframe Candle Marker The "Incomplete Session Candle - Incomplete Timeframe Candle Marker" is an advanced tool tailored for technical analysts who understand the importance of accurate timeframes in their charting. While the indicator is not limited to the Indian market, its genesis is rooted in the nuances of trading sessions like those in India, which span 375 minutes from 9:15 AM to 3:30 PM.
Key Features:
Detects if the current timeframe is intraday (minutes or hours).
Calculates the expected duration of the candle for the chosen timeframe.
Highlights candles that don't achieve their expected session duration by placing a cross shape above the bar.
Compatible across various intraday timeframes, aiding traders in spotting discrepancies promptly.
Why We Made This: Not Just for India:
While we looked at the Indian market, this indicator works everywhere. Regular timeframes like 30 minutes, 1 hour, and 2 hours often end with incomplete candles, especially at the end of the trading day. For example:
A 30-minute timeframe makes 13 candles, but the last one is only 15 minutes long.
A 1-hour timeframe shows 7 candles, but the last one is just the last 15 minutes.
By switching to different timeframes like 25 minutes, 75 minutes, and 125 minutes, you get more complete information for better trading decisions. Learn more about this in our article: "Power of 25, 75, and 125-Minute Timeframes in the Indian Market", recognized by Trading View's Editors' Pick.
Benefits:
The indicator extends its benefits even to users without access to certain timeframes. It accommodates traders using a 1-hour timeframe (pertaining to Indian traders). By employing this indicator, traders consistently remain mindful of incomplete candles within their chosen timeframe
For those who utilize concepts like RBR, RBD, DBR, and DBD, this indicator is paramount. An incomplete candle can skew analysis, leading to potential misinterpretations of base or leg candles.
Final thoughts:
In markets like the Indian stock market, adopting such a tool is not just beneficial, but necessary. Whether you have access to unconventional timeframes or are using traditional ones, recognizing and accounting for the limitations of incomplete candles is critical & it's important to know if your candles fit the timeframe properly. This indicator gives you a better view of the market, which helps you make smarter trades.
Lastly, Thank you for your support! Your likes & comments. If you want to give any feedback then you can give in comment section.
Let's conquer the markets together!

All Candlestick Patterns on Backtest [By MUQWISHI]▋ INTRODUCTION :
The “All Candlestick Patterns on Backtest” indicator generates a table that offers a clear visualization of the historical return percentages for each candlestick pattern strategy over a specified time period. This table serves as an organized resource, serving as a launching point for in-depth research into candle formations. It may help to rectify any misconceptions surrounding candlestick patterns, refine trading approaches, and it could be foundation to make informed decisions in trading journey.
_______________________
▋ OVERVIEW:
_______________________
▋ CREDIT:
Credit to public technical “*All Candlestick Patterns*” indicator.
_______________________
▋ TABLE:
_______________________
▋ CHART:
_______________________
▋ INDICATOR SETTINGS:
#Section One: Table Setting
#Section Two: Backtest Setting
(1) Backtest Starting Period.
Note: If the datetime of the first candle on the chart is after the entreated datetime, the calculation will start from the first candle on the chart.
(2) Initial Equity ($).
(3) Leverage: Current Equity x Leverage Value.
(4) Entry Mode:
- “At Close”: Execute entry order as soon as the candle confirmed.
- “Breakout High (Low for Short)”: Stop limit buy order, entry order will be executed as soon as the next candle breakout the high of last pattern’s candle (low for short)
(5) Cancel Entry Within Bars: This option is applicable with {Entry Mode = Breakout High (Low for Short)}, to cancel the Entry Order if it's not executed within certain selected number of bars.
(6) Stoploss Range: the range refers to high of pattern - low of pattern.
(7) Risk:Reward: the calculation of risk:reward range start from entry price level. For example: A pattern triggered with range 10 points, and entry price is 100.
- For 1:1~risk:reward would the stoploss at 90 and takeprofit at 110.
- For 1:3~risk:reward would the stoploss at 90 and takeprofit at 130.
#Section Three: Technical & Candle Patterns
_______________________
▋ Comments:
This table was developed for research and educational purposes.
Candlestick patterns are almost similar as seen in “*All Candlestick Patterns*” indicator.
The table results should not be taken as a major concept to build a trading decision.
Personally, I see candlestick patterns as a means to comprehend the psychology of the market, and help to follow the price action.
Please let me know if you have any questions.
Thank you.

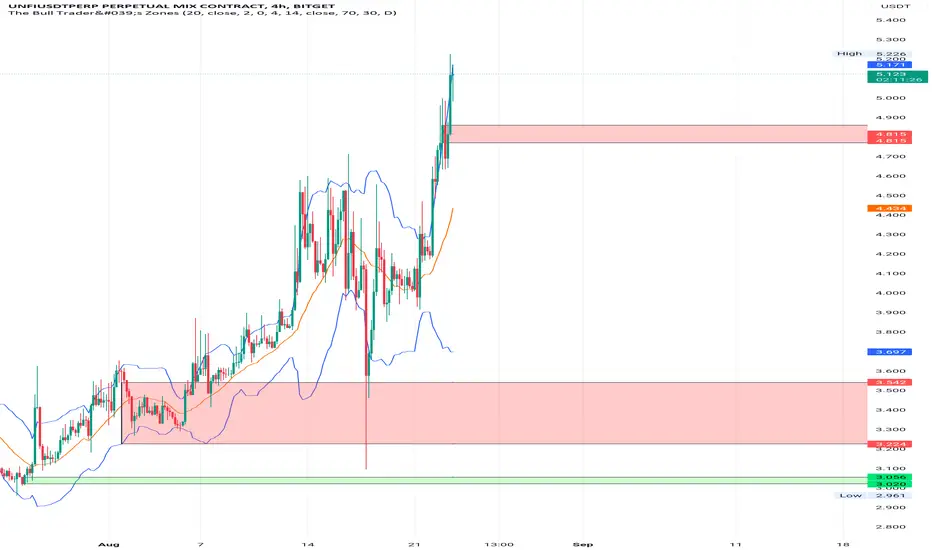
The Bull Trader's ZonesTBT Zones - Preferably used on the 4H chart. You should combine this script with other technical indicators as well.
In general the script helps find buy and sell opportunities early enough so as to make better decisions before taking a trade. Basically, it uses the rsi indicator, the long lower and long upper shadow candle sticks to create buy and sell zones.
The script is visibly engaging so one could easily know when the price is reverting into an Overbought or Sell zone after an uptrend, or reverting into an Oversold or Buy zone after an downtrend.
There is also the well known Bollinger Band Indicator, and it could be safer taking short trades when the price of the asset is above the Bollinger Basis, preferably close to the upper Bollinger Band. Vice-versa for long trades.
Adding the Camarilla L3 and H3 strategy could give an edge. Respecting the zones, if the open price is between H3 and L3;
BUY when the price moves back above L3 after going below L3. Target will be H1, H2, H3 levels. Stop loss can be placed at L4 level. Or trail an SL,
SELL when the price moves back below H3 after going above H3. Target will be L1,L2 L3 levels and stop loss above H4. Or trail an SL. Or simply take realistic profits.
By default the zones will extend left (back in history) which could give a view on how the zone previously performed. This option could be unchecked in the options. However, information on past performance is not necessarily a guide to future performance. Trade safe. Get out on time. Wait for another opportunity to set up.
When you add this indicator to your chart you can set up alerts to be informed when a new zone is formed.
Much thanks to @cyatophilum, the pinescript coder who made this a reality.
Candles In Row (Expo)█ Overview
The Candles In Row (Expo) indicator is a powerful tool designed to track and visualize sequences of consecutive candlesticks in a price chart. Whether you're looking to gauge momentum or determine the prevailing trend, this indicator offers versatile functionality tailored to the needs of active traders. The Candles In Row indicator can be an integral part of a multi-timeframe trading strategy, allowing traders to understand market momentum, and set trading bias. By recognizing the patterns and likelihood of future price movements, traders can make more informed decisions and align their trades with the overall market direction.
█ How to use
The indicator enhances traders' understanding of the consecutive candle patterns, helping them to uncover trends and momentum. Consecutive candles in the same direction may indicate a strong trend. The Candles In Row indicator can be an essential tool for traders employing a multiple timeframes strategy.
Analyzing a Higher Timeframe:
Understanding Momentum: By analyzing consecutive green or red candles in a higher timeframe, traders can identify the prevailing momentum in the market. A series of green candles would suggest an upward trend, while a series of red candles would indicate a downward trend.
Predicting Next Candle: The indicator's predictive feature calculates the likelihood of the next candle being green or red based on historical patterns. This probability helps traders gauge the potential continuation of the trend.
Setting the Trading Bias: If the likelihood of the next candle being green is high, the trader may decide to focus on long (buy) opportunities. Conversely, if the likelihood of the next candle being red is high, the trader may look for short (sell) opportunities.
In this example, we are using the Heikin Ashi candles.
Moving to a Lower Timeframe:
Finding Entry Points: Once the trading bias is set based on the higher timeframe analysis, traders can switch to a lower timeframe to look for entry points in the direction of the bias. For example, if the higher timeframe suggests a high likelihood of a green candle, traders may look for buy opportunities in the lower timeframe.
Combining Timeframes for a Comprehensive Strategy:
Confirmation and Alignment: By analyzing the higher timeframe and confirming the direction in the lower timeframe, traders can ensure that they are trading in alignment with the broader trend.
Avoiding False Signals: By using a higher timeframe to set the trading bias and a lower timeframe to find entries, traders can avoid false signals and whipsaws that might be present in a single timeframe analysis.
█ Settings
Price Input Selection: Choose between regular open and close prices or Heikin Ashi candles as the basis for calculation.
Data Window Control: Decide between displaying the full data window or only the active data. You can also enable a counter that keeps track of the number of candles.
Alert Configuration: Set the desired number and color of consecutive candles that must occur in a row to trigger an alert.
Table Display Customization: Customize the location and size of the display table according to your preferences.
-----------------
Disclaimer
The information contained in my Scripts/Indicators/Ideas/Algos/Systems does not constitute financial advice or a solicitation to buy or sell any securities of any type. I will not accept liability for any loss or damage, including without limitation any loss of profit, which may arise directly or indirectly from the use of or reliance on such information.
All investments involve risk, and the past performance of a security, industry, sector, market, financial product, trading strategy, backtest, or individual's trading does not guarantee future results or returns. Investors are fully responsible for any investment decisions they make. Such decisions should be based solely on an evaluation of their financial circumstances, investment objectives, risk tolerance, and liquidity needs.
My Scripts/Indicators/Ideas/Algos/Systems are only for educational purposes!

All Candlestick Patterns Screener [By MUQWISHI]▋ INTRODUCTION :
The Candlestick Patterns Screener has been designed to offer an advanced monitoring solution for up to 40 symbols. Utilizing a log screener style, it efficiently gathers information on confirmed candlestick pattern occurrences and presents it in an organized table. This table includes essential details such as the symbol name, signal price, and the corresponding candlestick pattern name.
_______________________
▋ OVERVIEW:
_______________________
▋ CREDIT:
Credit to public technical “*All Candlestick Patterns*” indicator.
_______________________
▋ USAGE:
_______________________
▋ Final Comments:
For best performance, add the Candlestick Patterns Screener on active symbol chart like QQQ, SPY, AAPL, BTCUSDT, ES, EURUSD or …etc.
Candlestick patterns are not a major concept to build a trading decision.
Personally, I see candlestick patterns as a means to comprehend the psychology of the market, and help to follow the price action.
Please let me know if you have any questions.
Thank you.

CandlestickPatternsLibrary "CandlestickPatterns"
This library provides a wide range of candlestick patterns, and available for user to call each pattern individually. It's a comprehensive and common tool designed for traders seeking to raise their technical analysis, and it may help users identify key turning of price action in financial instruments. Credit to public technical “*All Candlestick Patterns*” indicator.
abandonedBaby(order, d1)
The "Abandoned Baby" candlestick pattern is a bullish/bearish pattern consists of three candles.
Parameters:
order (simple string) : (simple string) Pattern order type "bull" or "bear".
d1 (simple float) : (simple float) Previous candle's body percentage out of candle range. Optional argument, default is 5.
darkCloudCover(c1, n)
The "Dark Cloud Cover" is a bearish pattern consists of two candles.
Parameters:
c1 (simple bool) : (simple bool) Previous candle's body must be higher than average. Optional argument, default is true.
n (simple int) : (simple int) Length of average candle's body. Optional argument, default is 14.
doji(d0)
The "Doji" is neither bullish or bearish consists of one candles.
Parameters:
d0 (simple float) : (simple float) Current candle's body percentage out of candle range. Optional argument, default is 5.
dojiStar(order, c1, n, d0)
The "Doji Star" is a bullish/bearish pattern consists of two candles.
Parameters:
order (simple string) : (simple string) Pattern order type "bull" or "bear" .
c1 (simple bool) : (simple bool) Previous candle's body must be higher than average. Optional argument, default is true.
n (simple int) : (simple int) Length of average candle's body. Optional argument, default is 14.
d0 (simple float) : (simple float) Current candle's body percentage out of candle range. Optional argument, default is 5.
downsideTasukiGap(c2, c1, n)
The "Downside Tasuki Gap" is a bearish pattern consists of three candles.
Parameters:
c2 (simple bool) : (simple bool) Before previous candle's body must be higher than average. Optional argument, default is true.
c1 (simple bool) : (simple bool) Previous candle's body must be lower than average. Optional argument, default is true.
n (simple int) : (simple int) Length of average candle's body. Optional argument, default is 14.
dragonflyDoji(d0)
The "Dragon Fly Doji" is a bullish pattern consists of one candle.
Parameters:
d0 (simple float) : (simple float) Current candle's body percentage out of candle range. Optional argument, default is 5.
engulfing(order, c1, c0, n)
The "Engulfing" is a bullish/bearish pattern consists of two candles.
Parameters:
order (simple string) : (simple string) Pattern order type "bull" or "bear".
c1 (simple bool) : (simple bool) Previous candle's body must be lower than average. Optional argument, default is true.
c0 (simple bool) : (simple bool) Current candle's body must be higher than average. Optional argument, default is true.
n (simple int) : (simple int) Length of average candle's body. Optional argument, default is 14.
eveningDojiStar(c2, c0, d1, n)
The "Evening Doji Star" is a bearish pattern consists of three candles.
Parameters:
c2 (simple bool) : (simple bool) Before previous candle's body must be higher than average, default is true.
c0 (simple bool) : (simple bool) Current candle's body must be higher than average. Optional argument, default is true.
d1 (simple float) : (simple float) Previous candle's body percentage out of candle range. Optional argument, default is 5.
n (simple int) : (simple int) Length of average candle's body. Optional argument, default is 14.
eveningStar(c2, c1, c0, n)
The "Evening Star" is a bearish pattern consists of three candles.
Parameters:
c2 (simple bool) : (simple bool) Before previous candle's body must be higher than average. Optional argument, default is true.
c1 (simple bool) : (simple bool) Previous candle's body must be lower than average. Optional argument, default is true.
c0 (simple bool) : (simple bool) Current candle's body must be higher than average. Optional argument, default is true.
n (simple int) : (simple int) Length of average candle's body. Optional argument, default is 14.
fallingThreeMethods(c4, c3, c2, c1, c0, n)
The "Falling Three Methods" is a bearish pattern consists of five candles.
Parameters:
c4 (simple bool) : (simple bool) 5th candle ago body must be higher than average. Optional argument, default is true.
c3 (simple bool) : (simple bool) 4th candle ago body must be lower than average. Optional argument, default is true.
c2 (simple bool) : (simple bool) 3rd candle ago body must be lower than average. Optional argument, default is true.
c1 (simple bool) : (simple bool) 2nd candle ago body must be lower than average. Optional argument, default is true.
c0 (simple bool) : (simple bool) Current candle's body must be higher than average. Optional argument, default is true.
n (simple int) : (simple int) Length of average candle's body. Optional argument, default is 14.
Returns: (bool)
fallingWindow()
The "Falling Window" is a bearish pattern consists of two candles.
gravestoneDoji(d0)
The "Gravestone Doji" is a bearish pattern consists of one candle.
Parameters:
d0 (simple float) : (simple float) Current candle's body percentage out of candle range. Optional argument, default is 5.
hammer(c0, n)
The "Hammer" is a bullish pattern consists of one candle.
Parameters:
c0 (simple bool) : (simple bool) Current candle's body must be lower than average. Optional argument, default is true.
n (simple int) : (simple int) Length of average candle's body. Optional argument, default is 14.
hangingMan(c0, n)
The "Hanging Man" is a bearish pattern consists of one candle.
Parameters:
c0 (simple bool) : (simple bool) Current candle's body must be lower than average. Optional argument, default is true.
n (simple int) : (simple int) Length of average candle's body. Optional argument, default is 14.
haramiCross(order, c1, n)
The "Harami Cross" candlestick pattern is a bullish/bearish pattern consists of two candles.
Parameters:
order (string) : (simple string) Pattern order type "bull" or "bear".
c1 (simple bool) : (simple bool) Previous candle's body must be higher than average. Optional argument, default is true.
n (simple int) : (simple int) Length of average candle's body. Optional argument, default is 14.
harami(order, c1, c0, n)
The "Harami" candlestick pattern is a bullish/bearish pattern consists of two candles.
Parameters:
order (string) : (simple string) Pattern order type "bull" or "bear"
c1 (simple bool) : (simple bool) Previous candle's body must be higher than average. Optional argument, default is true.
c0 (simple bool) : (simple bool) Current candle's body must be lower than average. Optional argument, default is true.
n (simple int) : (simple int) Length of average candle's body. Optional argument, default is 14.
invertedHammer(c0, n)
The "Inverted Hammer" is a bullish pattern consists of one candle.
Parameters:
c0 (simple bool) : (simple bool) Current candle's body must be lower than average. Optional argument, default is true.
n (simple int) : (simple int) Length of average candle's body. Optional argument, default is 14.
kicking(order, c1, c0, n)
The "Kicking" candlestick pattern is a bullish/bearish pattern consists of two candles.
Parameters:
order (string) : (simple string) Pattern order type "bull" or "bear"
c1 (simple bool) : (simple bool) Previous candle's body must be higher than average. Optional argument, default is true.
c0 (simple bool) : (simple bool) Current candle's body must be higher than average. Optional argument, default is true.
n (simple int) : (simple int) Length of average candle's body. Optional argument, default is 14.
longLowerShadow(l0)
The "Long Lower Shadow" candlestick pattern is a bullish pattern consists of one candles.
Parameters:
l0 (simple float) : (simple float) Current candle's lower wick min percentage out of candle range. Optional argument, default is 75.
longUpperShadow(u0)
The "Long Upper Shadow" candlestick pattern is a bearish pattern consists of one candles.
Parameters:
u0 (simple float) : (simple float) Current candle's upper wick min percentage out of candle range. Optional argument, default is 75.
marubozuBlack(c0, n)
The "Marubozu Black" candlestick pattern is a bearish pattern consists of one candles.
Parameters:
c0 (simple bool) : (simple bool) Current candle's body must be higher than average. Optional argument, default is true.
n (simple int) : (simple int) Length of average candle's body. Optional argument, default is 14.
marubozuWhite(c0, n)
The "Marubozu White" candlestick pattern is a bullish pattern consists of one candles.
Parameters:
c0 (simple bool) : (simple bool) Current candle's body must be higher than average. Optional argument, default is true.
n (simple int) : (simple int) Length of average candle's body. Optional argument, default is 14.
morningDojiStar(c2, d1, c0, n)
The "Morning Doji Star" candlestick pattern is a bullish pattern consists of three candles.
Parameters:
c2 (simple bool) : (simple bool) Before previous candle's body must be higher than average. Optional argument, default is true.
d1 (simple float) : (simple float) Previous candle's body percentage out of candle range. Optional argument, default is 5.
c0 (simple bool) : (simple bool) Current candle's body must be higher than average. Optional argument, default is true.
n (simple int) : (simple int) Length of average candle's body. Optional argument, default is 14.
morningStar(c2, c1, c0, n)
The "Morning Star" candlestick pattern is a bullish pattern consists of three candles.
Parameters:
c2 (simple bool) : (simple bool) Before previous candle's body must be higher than average. Optional argument, default is true.
c1 (simple bool) : (simple bool) Previous candle's body must be lower than average. Optional argument, default is true.
c0 (simple bool) : (simple bool) Cuurent candle's body must be higher than average. Optional argument, default is true.
n (simple int) : (simple int) Length of average candle's body. Optional argument, default is 14.
onNeck(c1, c0, n)
The "On Neck" candlestick pattern is a bearish pattern consists of two candles.
Parameters:
c1 (simple bool) : (simple bool) Previous candle's body must be higher than average. Optional argument, default is true.
c0 (simple bool) : (simple bool) Cuurent candle's body must be lower than average. Optional argument, default is true.
n (simple int) : (simple int) Length of average candle's body. Optional argument, default is 14.
piercing(c1, n)
The "Piercing" candlestick pattern is a bullish pattern consists of two candles.
Parameters:
c1 (simple bool) : (simple bool) Previous candle's body must be higher than average. Optional argument, default is true.
n (simple int) : (simple int) Length of average candle's body. Optional argument, default is 14.
risingThreeMethods(c4, c3, c2, c1, c0, n)
The "Rising Three Methods" candlestick pattern is a bullish pattern consists of five candles.
Parameters:
c4 (simple bool) : (simple bool) 5th candle ago body must be higher than average. Optional argument, default is true.
c3 (simple bool) : (simple bool) 4th candle ago body must be Lower than average. Optional argument, default is true.
c2 (simple bool) : (simple bool) 3rd candle ago body must be Lower than average. Optional argument, default is true.
c1 (simple bool) : (simple bool) 2nd candle ago body must be Lower than average. Optional argument, default is true.
c0 (simple bool) : (simple bool) Current candle's body must be higher than average. Optional argument, default is true.
n (simple int) : (simple int) Length of average candle's body. Optional argument, default is 14.
risingWindow()
The "Rising Window" candlestick pattern is a bullish pattern consists of two candle.
shootingStar(c0, n)
The "Shooting Star" candlestick pattern is a bearish pattern consists of one candle.
Parameters:
c0 (simple bool) : (simple bool) Current candle's body must be higher than average. Optional argument, default is true.
n (simple int) : (simple int) Length of average candle's body. Optional argument, default is 14.
spinningTopBlack(l0, u0)
The "Spinning Top Black" is neither bullish or bearish.
Parameters:
l0 (simple float) : (simple float) Current candle's lower wick min percentage out of candle range. Optional argument, default is 34.
u0 (simple float) : (simple float) Current candle's upper wick min percentage out of candle range. Optional argument, default is 34.
spinningTopWhite(l0, u0)
The "Spinning Top White" is neither bullish or bearish.
Parameters:
l0 (simple float) : (simple float) Current candle's lower wick min percentage out of candle range. Optional argument, default is 34.
u0 (simple float) : (simple float) Current candle's upper wick min percentage out of candle range. Optional argument, default is 34.
threeBlackCrows(c2, c1, c0, n)
The "Three Black Crows" candlestick pattern is a bearish pattern consists of three candles.
Parameters:
c2 (simple bool) : (simple bool) Before previous candle's body must be higher than average. Optional argument, default is true.
c1 (simple bool) : (simple bool) Previous candle's body must be higher than average. Optional argument, default is true.
c0 (simple bool) : (simple bool) Cuurent candle's body must be higher than average. Optional argument, default is true.
n (simple int) : (simple int) Length of average candle's body. Optional argument, default is 14.
threeWhiteSoldiers(c2, c1, c0, n)
The "Three White Soldiers" candlestick pattern is a bullish pattern consists of three candles.
Parameters:
c2 (simple bool) : (simple bool) Before previous candle's body must be higher than average. Optional argument, default is true.
c1 (simple bool) : (simple bool) Previous candle's body must be higher than average. Optional argument, default is true.
c0 (simple bool) : (simple bool) Cuurent candle's body must be higher than average. Optional argument, default is true.
n (simple int) : (simple int) Length of average candle's body. Optional argument, default is 14.
triStar(order, d2, d1, d0)
The "Tri Star" candlestick pattern is a bullish/bearish pattern consists of three candles.
Parameters:
order (simple string) : (simple string) Pattern order type "bull" or "bear".
d2 (simple float) : (simple float) Before previous candle's body percentage out of candle range. Optional argument, default is 5.
d1 (simple float) : (simple float) Previous candle's body percentage out of candle range. Optional argument, default is 5.
d0 (simple float) : (simple float) Current candle's body percentage out of candle range. Optional argument, default is 5.
tweezerBottom(c1, n)
The "Tweezer Bottom" candlestick pattern is a bullish pattern consists of two candles.
Parameters:
c1 (simple bool) : (simple bool) Previous candle's body must be higher than average. Optional argument, default is true.
n (simple int) : (simple int) Length of average candle's body. Optional argument, default is 14.
tweezerTop(c1, n)
The "Tweezer Top" candlestick pattern is a bearish pattern consists of two candles.
Parameters:
c1 (simple bool) : (simple bool) Previous candle's body must be higher than average. Optional argument, default is true.
n (simple int) : (simple int) Length of average candle's body. Optional argument, default is 14.
upsideTasukiGap(c2, c1, n)
The "Tri Star" candlestick pattern is a bullish pattern consists of three candles.
Parameters:
c2 (simple bool) : (simple bool) Before Previous candle's body must be higher than average. Optional argument, default is true.
c1 (simple bool) : (simple bool) Previous candle's body must be lower than average. Optional argument, default is true.
n (simple int) : (simple int) Length of average candle's body. Optional argument, default is 14.
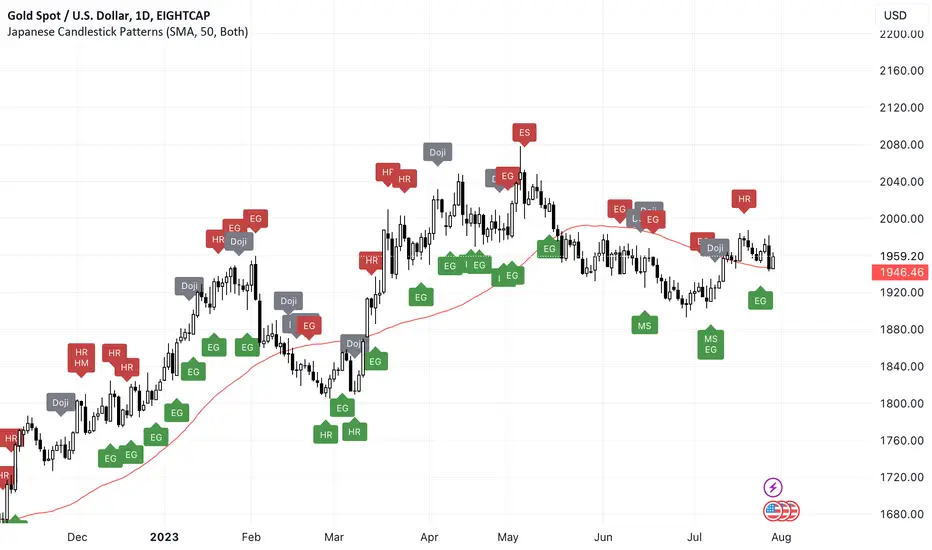
Japanese Candlestick Patterns💡 Japanese Candlesticks are a visual representation of price movements in financial markets. They were first developed by Japanese rice traders in the 18th century to analyze the price of rice contracts, and have since been adopted by traders across the world for a wide range of assets.
📌 A candlestick is composed of a rectangular body and two thin lines, known as wicks, that extend from the top and bottom of the body. The body represents the difference between the opening and closing prices of the asset during a specific time period, while the wicks indicate the high and low prices reached during that period.
📌 By using these and other candlestick patterns, traders can identify potential buying and selling opportunities and manage their risk accordingly. However, it's important to note that candlestick patterns should be used in conjunction with other technical and fundamental analysis tools to make well-informed trading decisions.
📌 Candlestick patterns are particularly useful because they are based on price action rather than external factors such as news or economic data. This makes them useful for traders who employ technical analysis, as they can use candlestick patterns to identify potential trading opportunities and manage their risk accordingly.
🚀 Candlesticks can be used to identify market trends, as well as potential buying and selling opportunities. By analyzing the patterns formed by multiple candlesticks, traders can gain insights into the behavior of the market and make informed trading decisions. Overall, Japanese Candlesticks are a powerful tool for technical analysis that can provide valuable insights into financial markets.
🔍 THE PATTERNS THAT ARE RECOGNIZED:
🔄 Reversal Patterns
* Counterattack Lines
* Dark-Cloud Cover
* Engulfing ( Bearish / Bullish )
* Hammer
* Hanging Man
* Harami ( Bearish / Bullish )
* In Neck
* On Neck
* Piercing
* Three Black Crows
* Thrusting
* Upside Gap Two Crows
⭐️ Stars
* Abandoned Baby
* Evening star
* Inverted Hammer
* Morning Star
* Shooting Star
🎯 Doji
* Doji
* Dragonfly Doji
* Evening Doji Star
* Gravestone Doji
* Long Legged Doji
* Morning Doji Star
🔥 Continuation Patterns
* Falling Three Methods
* Rising Three Methods
* Tasuki ( Upside / Downside )
🥊 Utility
* Long Lower Shadow
* Long Upper Shadow
❤️ Please, support the work with like & comment! ❤️
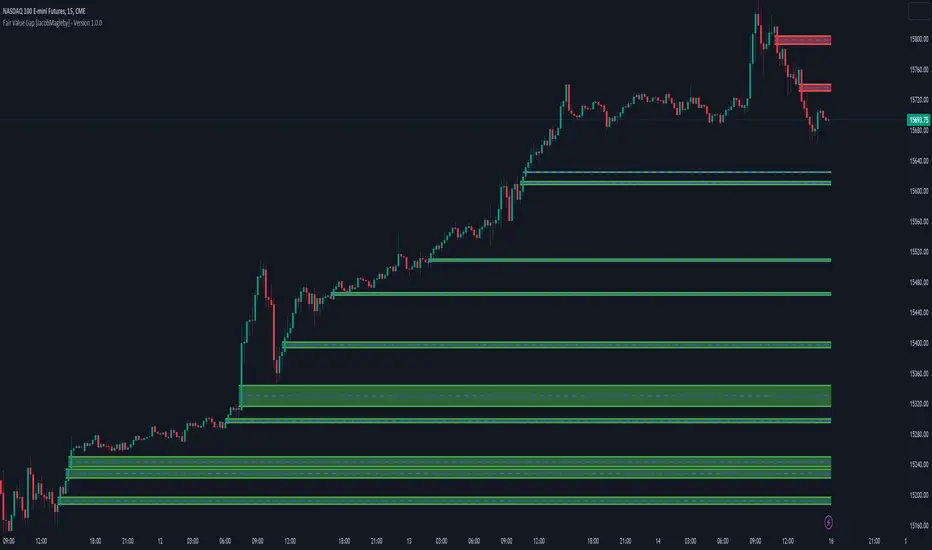
Fair Value Gap [MyTradingCoder]Introducing the "Fair Value Gap" indicator, a powerful tool designed to identify and visualize areas of potential market gaps where leftover orders may reside. This indicator utilizes price action analysis, specifically focusing on fair value gaps that occur between the current candle and the candle two bars prior.
The Fair Value Gap indicator draws customizable zones on the chart, representing bullish or bearish areas with distinct green or red colors. These zones highlight market gaps where price action has left a void, indicating the possibility of significant order activity in that region.
Key Features:
Liquidity Zone: Utilize the Fair Value Gap zones as areas of liquidity, offering potential entry points for trades.
Support/Resistance Indicator: Configure the indicator to extend beyond the initial breakout or gap fill, allowing it to act as a support/resistance zone indicator.
The Fair Value Gap indicator has several adjustable settings to customize its behavior according to your trading preferences. These settings include:
Invalidation Outcome: Choose how the fair value gap zone is treated when it becomes invalidated. Options include:
-Stop Updating: Maintain the gap zone in its current state without further updates.
-Delete: Completely remove the fair value gap from the screen.
Invalidation Method: Determine the logic that invalidates the fair value gap. Options include:
-Gap Fill: Visually shrink the zone as price action closes the gap until it is completely filled, at which point it gets deleted entirely.
-Number Of Breakouts: Invalidate the gap after a certain number of breaks or flips over the zone's border. Configure the allowed number of breakouts with the "Breakouts Until Invalidation" input.
-Age Of Gap: Invalidate the gap after a specified number of bars have passed since its creation. Set the threshold with the "Bars Until Invalidation" input.
Color Customization: Customize the appearance of the fair value gap zones with various color inputs, including bullish and bearish border colors, middle line color (shared for both bullish and bearish gaps), bullish and bearish background colors.
Line Width: Adjust the width of the border lines and the center line within the fair value gap zone for better visual clarity.
Please note that the Fair Value Gap indicator is a valuable tool but should be used alongside other technical analysis methods to make well-informed trading decisions. It does not guarantee profitable trades but aims to provide insights into potential areas of interest.
Discover opportunities within market gaps and leverage the power of leftover orders with the Fair Value Gap indicator—an indispensable asset in your trading toolkit.
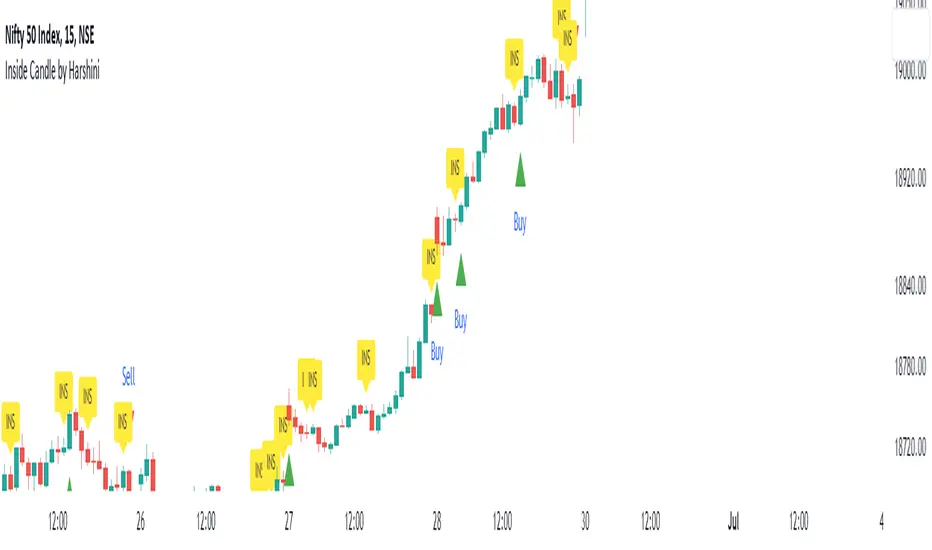
Inside Candle by HarshiniThe concept behind this indicator is that the inside candle indicates a pause in the current move and the following candle after inside candle will indicate the direction of the next move. This indicator informs you when an inside candle is formed and based on the next candle, it gives you buy/sell signal.
When an inside candle is formed, a label will appear above the candle, which makes it very easy to identify the inside candle in live charts. Once the inside candle is formed, the Buy/Sell signal depends on the next candle. If the candle formed after the inside candle gives a breakout above then "Buy" signal is indicated, you can take a trade with 1:2 risk reward. Similarly if the next candle gives a breakout below, then a "Sell" signal is generated and you can take a sell with 1:2 risk reward. This indicator can be applied to any chart like stocks, crypto, commodities etc...
Here's how you can trade using this indicator:
1) Apply this indicator in a 15 mins time frame :
Even though this indicator identifies inside candle formation in almost every time frame, it works very well when applied to a 15 mins chart.
2) Always keep minimum 1:2 Risk Reward :
While taking trades initially, stick on to 1:2 risk reward. If there are other confluences as well along with the inside candle, you can book target accordingly.
Note : It is observed that this indicator works well in a trending market and not in ranging bound market.
Buy&Sell Bullish Engulfing - The Quant Science🇺🇸
GENERAL OVERVIEW
Buy&Sell Bullish Engulfing - The Quant Science It is a Buy&Sell strategy based on the 'Bullish Engulfing' candlestick pattern. The main goal of the strategy is to achieve a consistent and sustainable return over time, with a manageable level of risk.
Bullish Engulfing
The template was developed at the top of the Indicator provided by TradingView called 'Engulfing - Bullish'.
ENTRY AND EXIT CRITERIA
Entry: A single long order is opened when the candlestick pattern is formed, and the percentage size of the order (%) is fixed by the trader through the user interface.
Exit: The long trade is closed on a percentage equity take profit-stop loss.
----------------------------------------------------------------------------------------------------------------------------------------------------------------------------------------------
🇮🇹
PANORAMICA GENERALE
Buy&Sell Bullish Engulfing - The Quant Science è una strategia Buy&Sell basata sul candlestick pattern 'Bullish Engulfing'. L'obiettivo principale della strategia è ottenere un ritorno costante e sostenibile nel tempo, con un livello gestibile di rischio.
Bullish Engulfing
Il template è stato sviluppato al top dell' Indicatore fornito da Trading View chiamato 'Engulfing - Bullish'.
CRITERI DI ENTRATA E USCITA
Entrata: viene aperto un singolo ordine long quando si forma il candlestick pattern, la size percentuale dell'ordine (%) viene selezionato tramite l'interfaccia utente dal trader.
Uscita: la chiusura della posizione avviene unicamente tramite un take profit-stop loss percentuale calcolato sul capitale.

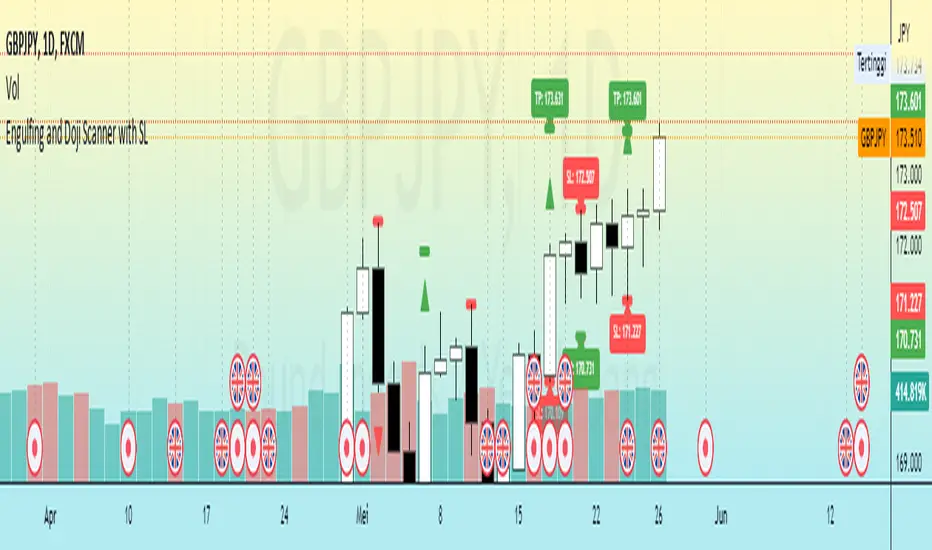
Engulfing and Doji Scanner with SLThe Bullish Engulfing pattern occurs when the close is higher than the open, and scripts will look for this pattern by checking the difference in the close and open prices sufficiently in pips. Likewise, the Bearish Engulfing pattern occurs when the close is lower than the open, and scripts will look for this pattern by checking for sufficient difference in the open and close in pips.
The Doji pattern occurs when the absolute difference between the open and close prices is very small compared to the price range for that period. The script will look for these patterns by comparing the difference between the open and close prices by a certain percentage of the price range.
After the patterns are detected, the script will calculate the Stop Loss (SL) and Take Profit (TP) levels based on the parameters set. The SL level will be determined based on the lowest price range with certain adjustments, while the TP level is calculated using a 1:1 ratio to the SL distance.
This script will display arrows and Stop Loss and Take Profit labels on the chart to assist traders in identifying relevant patterns and levels. However, it is important to remember that these scripts only assist in the analysis of patterns and levels, and a more complete trading strategy and decision-making remains the responsibility of the trader.
CANDLE STICK HEATMAPCANDLE STICK HEATMAP shows the statistics of a candle at a particular time. its very useful to find repeating pattern's at a particular time in a day.
based on the settings you can see regular repeating patterns of a day in an hourly chart. During a particular time in day there is always a down or up signal or candles.
The table boxes are candles in RED and GREEN based on open and close of the chart. The Heat map is very useful in analyzing the daily Hourly candlesticks in a week. The Time of each candlestick is plotted on the table along with default Indicators like RSI, MACD, EMA, VOLUME, ADX.
Additionally this can be used as a screener of candles on all timeframes. Analysis is easy when you want to see what happened exactly at a particular time in the previous hour, day, month etc.,
Hopefully additional updates will be introduced shortly.
Indicators:
1. MACD (close,12,26,9)
2.RSI (close,14)
3.EMA 200
3.Volume MA
Option is provided to show indicator statistics and time.
Color can be changed using settings.
Supports all Time Zones

Liquidity Engulfing & Displacement [MsF]Japanese below / 日本語説明は英文の後にあります。
-------------------------
*This indicator is based on upslidedown's "Liquidity Engulfing Candles ". It's a very cool indicator. thank you.
It has 2 functions: show the Liquidity Engulfing on HTF and candle color change when displacement occurs.
=== Function description ===
1. Liquidity Engulfing on HTF
This indicator gives Liquidity Engulfing signals not only for the current candle, but also for H4 and H1 on HTF.
You can use that a bullish engulfing on H1 is a BOS on m5 and on H4 is a BOS on m15. It uses the theory of stop hunt from ICT.
Also, It's possible to fire alert.
2. Displacement
Change the color display of the candlesticks when a bullish candleStick or bearish candleStick is attached. Furthermore, by enabling the "Require FVG" option, you can easily discover the FVG (Fair Value Gap). It is a very useful function for ICT trading.
When H1 candle takes liquidity from one side and moves with an explosive move to the other side of the previous candle (displacement), it creates break of market structure on M5. Entry on discount FVG or OTE with stop loss at or below the stop hunt wick.
=== Parameter description ===
- Liquidity engulfing candles(LEC) SETTING
- Show H1 LEC … Whether to show LEC for H1
- Show H4 LEC … Whether to show LEC for H4
- Show Current LEC … Whether to show LEC for current timeframe
- Apply Stop Hunt Wick Filter … Require candle wick into prior candle retracement zone
- Apply Close Filter … Require LL/HH on candle in order to print a valid engulfing signal
- DISPLACEMENT SETTING
- Require FVG … Draw only when FVG occurs
- Displacement Type … Displacement from open to close? or from high to low?
- Displacement Length … Period over which to calculate the standard deviation
- Displacement Strength … The larger the number, the stronger the displacement detected
-------------------------
2つの機能があります: 上位足のLiquidity engulfing(流動性獲得)を表示することと、大きな変位が発生したときにローソク足の色を変更することです。
=== 機能説明 ===
1. 上位足のLiquidity engulfing
このインジケーターは、現在のローソク足だけでなく、上位足の H4 および H1 に対してもLiquidity engulfingシグナルを提供します。
H1はm5、H4はm15での使用を推奨します。これはICTのストップハント理論を活用しています。また、アラートを発することも可能です。
2. 変位(DISPLACEMENT)
大きな陽線、陰線を付けた場合に、そのローソク足をカラー表示を変更します。
さらに"Require FVG"オプションを有効にすることで、FVG(Fair Value Gap)を容易に発見することができます。ICTトレードにを行うにあたり大変有用な機能となっています。
=== パラメータの説明 ===
- Liquidity engulfing candles(LEC) SETTING
- Show H1 LEC … H1のLECを表示するかどうか
- Show H4 LEC … H4のLECを表示するかどうか
- Show Current LEC … 現在の期間の LEC を表示するかどうか
- Apply Stop Hunt Wick Filter … ハラミ足、もしくは包み足になっている場合のみに検知させる
- Apply Close Filter … 1つ前のローソクよりも終値で超えていた場合のみに検知させる
- DISPLACEMENT SETTING
- Require FVG … FVG発生時のみ描画する
- Displacement Type … openからcloseまでの変位か?highからlowまでの変位か?
- Displacement Length … 標準偏差を計算する期間
- Displacement Strength … 変位の強さ(数字が大きいほど強い変位を検出)

RSI Primed [ChartPrime]
RSI Primed combines candlesticks, patterns, and the classic RSI indicator for advanced market trend indications
Introduction
Technical traders are always looking for innovative methods to pinpoint potential entry and exit points in the market. The RSI Prime indicator provides such traders with an enhanced view of market conditions by combining various charting styles and the Relative Strength Index (RSI). It offers users a unique perspective on the market trends and price momentum, enabling them to make better-informed decisions and stay ahead of the market curve.
The RSI Primed is a versatile indicator that combines different charting styles with the Relative Strength Index (RSI) to help traders analyze market trends and price momentum. It offers multiple visualization modes that serve specific purposes and provide unique insights into market performance:
Regular Candlesticks
Candlesticks with Patterns
Heikin Ashi Candles
Line Style
Regular Candlestick Mode
The Regular Candlestick Mode in RSI Primed depicts traditional Japanese candlesticks that most traders are familiar with. This mode bypasses any smoothing or modified calculations, representing real-price movements. Regular candlesticks offer a clear and straightforward way to visualize market trends and price action.
Candlestick with Patterns Mode
The Candlestick with Patterns Mode focuses on identifying high-probability candlestick patterns while incorporating RSI values. By leveraging the information captured by the RSI, this mode allows traders to spot significant market reversals or continuation patterns that could signal potential trading opportunities. Some recognizable patterns include engulfing bullish, engulfing bearish, morning star bullish, and evening star bearish patterns.
Heikin Ashi Candles Mode
The Heikin Ashi Candles Mode presents an advanced candlestick charting technique known for its excellent trend-following capabilities. Heikin Ashi Candles filter out noise in the market and provide a clear representation of market trends. In this mode, candlesticks are plotted based on RSI values of the open, high, low, and close prices, helping traders understand and utilize market trends effectively.
Line Style Mode
The Line Style Mode offers a simpler and minimalistic representation of the RSI values by using a line instead of candlesticks to visualize market trends. This mode helps traders focus on the overall trend direction and eliminates potential distractions caused by the complexity of candlestick patterns.
Candle Color Overlay Mode
The Candle Color Overlay Mode is a unique feature in the RSI Primed indicator that allows traders to visualize the RSI values on the chart's candles as a heat gradient. This mode adds a color overlay to the candlesticks, representing the RSI values in relation to the candlesticks' price action.
By displaying the RSI as a color gradient, traders can quickly assess market momentum and identify overbought or oversold conditions without having to switch between different modes or charts. The gradient ranges from cool colors (blue and green) for lower RSI values, indicating oversold conditions, to warm colors (orange and red) for higher RSI values, signifying overbought situations.
To enable the Candle Color Overlay Mode, traders can toggle the "Color Candles" option in the indicator settings. Once enabled, the color gradient will be applied to the candlesticks on the chart, providing a visually striking and informative representation of the RSI values in relation to price action. This mode can be used in tandem with any of the other charting styles, allowing traders to gain even more insights into market trends and momentum.
RSI Primed Implementation
The RSI Primed indicator combines the benefits of various charting styles with the RSI to help traders gain a comprehensive view of market trends and price momentum. It incorporates the Heikin Ashi and RSI values as inputs to generate several visualization modes, enabling traders to select the one that best suits their needs.
Chebyshev Digital Audio Filter in RSI Primed Indicator
A unique feature of the RSI Primed Indicator is the incorporation of the Chebyshev Digital Audio Filter, a powerful tool that significantly influences the indicator's accuracy and responsiveness. This signal processing method brings several benefits to the context of the RSI indicator, improving its performance and capabilities.
1. Improved Signal Filtering
The Chebyshev filter excels in its ability to remove high-frequency noise and unwanted signals from the RSI data. While other filtering techniques might introduce unwanted side effects or distort the RSI data, the Chebyshev filter accurately retains the main signal components, enhancing the RSI Primed's overall accuracy and reliability.
2. Faster Response Time
The Chebyshev filter offers a faster response time than most other filtering techniques. In the context of the RSI Primed Indicator, this means that the filtering process is quicker and more efficient, allowing traders to act swiftly during rapidly changing market conditions.
3. Enhanced Trend Detection
By effectively removing noise from the RSI data, the Chebyshev filter contributes to the enhanced detection of underlying market trends. This feature helps traders identify potential entry and exit points more accurately, improving their overall trading strategy and performance.
How to Use RSI Primed
Traders can choose from different visualization modes to suit their preferences while using the RSI Primed indicator. By closely monitoring the chosen visualization mode and the position of the moving average, traders can make informed decisions about market trends.
Green candlesticks or an upward line slope indicate a bullish trend, and red candlesticks or a downward line slope suggest a bearish trend. If the candles or line are above the moving average, it could signify an uptrend, whereas a position below the moving average may indicate a downtrend.
The RSI Primed indicator offers a unique and comprehensive perspective on market trends and price momentum by combining various charting styles with the RSI. Traders can choose from different visualization modes and make well-informed decisions to capitalize on market opportunities. This innovative indicator provides a clear and concise view of the market, enabling traders to make swift decisions and enhance their trading results.

The Golden Candlestick PatternThe Golden pattern is a three-candlestick configuration based on a variation of the golden ratio (2.618) from the Fibonacci sequence.
The bullish Golden pattern is composed of a normal bullish candlestick with any type of body, followed by a bigger bullish candlestick with a close price that is at least 2.618 times the size of the first candlestick (high to low). Finally, there must be an important condition that is, a third candlestick that comes back to test the open of the second candlestick from where the entry is given.
The bearish Golden pattern is composed of a normal bearish candlestick with any type of body, followed by a bigger bearish candlestick with a close price that is at least 2.618 times the size of the first candlestick (high to low). Finally, there must be an important condition that is, a third candlestick that comes back to test the open of the second candlestick from where the entry is given.

CandlesticksIndicator that identifies the classical candlestick patterns for markets that are open 24/7 like the crypto market.
Why? because those markets don't gap, so many patterns won't need to gap to be valid.
Also, the theoretical rules about the patterns are very strict but it is to the discretion of the trader or technical analyst to decide if the patterns are yet valid. This is how Steve Nison uses candlesticks, i.e. a hammer is still valid if it has a small upper shadow, a marubozu is still valid if it has tiny shadows, etc.
So, for each candlestick pattern there are tolerance parameters so you can decide what is an acceptable upper shadow size for a hammer etc. I have set them to my liking but you might want to adjust them which is totally fine.
Additional features:
-to avoid the clutter, decide how many candles have to be analyzed
-use a trend filter based on the ema 5 (you can change the value) so you only see reversal patterns relevant to the trend
-plot pivots (swings HL)
-volume confirmation: bearish signals don't need volume confirmation as prices fall off their own weight. But volume confirmation for bullish price action can serve as added confluence. You have a setting that allows you to decide how many times the volume needs to be bigger than the previous candle's volume : if you have a bullish candlestick pattern printed, if the volume is1.5 times bigger than the previous candle then you will have a shape plotted at the bottom of your chart
-there is a cheap vs expensive feature that colors the bars
-you can also color the background so you see the oversold/overbought RSI
-finally, there are a couple of custom signals
"RULES" ABOUT CANDLESTICKS
-this is not a system in itself, but combined with other candlesticks (cluster of candlesticks), volume, oscillators, trend lines, support and resistances, bollinger bands can give amazing results and that is where the magic is
-most candlesticks can establish a support or resistance or confirm one
-a reversal candlestick doesn't mean that market will shoot the other direction right away, trend changes occur usually slowly and the trend might not reverse but convert in a period of sideways. It shouldn't actually be named reversal patterns but rather trend change patterns.
-reversal patterns need a trend to reverse (or change), in ranging markets you should ignore the signals
-you might think that there are many false signals, you need to understand that they are early warnings and the next candle's close is of major importance. A hammer at the end of a downtrend isn't enough to enter a position, you will have to wait for the next candle to close above the high of the hammer to validate the bullish reversal and vice versa.
-some signals are based on 1 candle only (like the hammer) others on 2 candles (like the engulfing pattern), others on 3 and more (tower top, morning star, etc). Patterns based on multiple candles have more probability.
-you might want to wait for price to revisit the support created by the pattern (read below) to get a better entry
-candles do not provide price targets
-long lower shadows is bullish, long upper shadows is bearish, small bodies (spinning tops, stars, dojis) means indecision and market is vulnerable to a trend change and the color of the body is irrelevant, declining size of bodies means trend strength weakening
HAMMER
stop-loss under the lower shadow
lower shadow can become a potential support or confirm an existing support
ENGULFING
with bearish engulfing pattern use the highest high of the 2 candles as a resistance, and with bullish engulfing pattern use the lowest low as support
DARK CLOUD COVER
use the highest high of the 2 candles as resistance
PIERCING PATTERN
use the lowest low of the 2 candles as support
MORNING STAR
use the lowest low of the 3 candles as support
the smaller the body of the 2nd candle the more potent the signal
for traditional markets, an ideal morning star would have a gap between 2nd and 3rd candles' bodies
EVENING STAR
use the highest high of the 3 candles as resistance
the smaller the body of the 2nd candle the more potent the signal
HARAMI
the smaller the size of the candle the more potent the signal
TWEEZERS
very important signals by themselves on weekly and monthly charts
for daily and intraday signals, it is potent only if it meets additional criterias (1st candle long, 2nd short, a candle pattern with with same highs or lows)
BELT-HOLD
they are more important if they confirm a support or resistance or another belt-hold or if they have not appeared for a while.
3 BLACK CROWS AND 3 WHITE SOLDIERS
candles 1 and 2 should act as support for the 3WS and as resistance for the 3BC
RISING AND FALLING 3 METHODS
stop-loss is the low of the 1st candle that started the rising 3 methods
stop-loss is the high of the 1st candle that started the falling 3 methods
ideally 1st and last candles have the strongest volume
DOJI
signal is reinforced by subsequent candles, if market is oversold or overbought, if the market doesn't have many doji on the chart, if market is at an important junction, if there are other technical alerts
doji after a tall candle are especially potent, the highest high of the 2 candles is the resistance
doji are especially potent after an uptrend, less so after a downtrend
gavestone doji is a bearish signal
dragonfly doji is a bullish signal
long-legged doji is a confused market
CUSTOM
*1st signal is a continuation pattern based on the progression of bodies' sizes and/or shadows' sizes
*following ones are reversal patterns based on the progression of bodies' sizes and/or shadows' sizes
*early reversal is based on a "secret" excess signal
reversal confirmed is when the early reversal's excess resolves and price reintegrates the non-excess area + prints a custom reversal pattern
for both early reversal and reversal confirmed the same rule applies as with any candlestick signal: we wait for the next candle's close above the previous upper shadow (bullish reversal) or below the previous lower shadow (bearish reversal)
*swings are 3 candles fractals, they are not reversal or continuation patterns but serve to mark swing highs and lows
this is all based on Steve Nison's book Japanese candlestick charting techniques
and
Thomas N. Bulkowski's Encyclopedia of candlestick charts
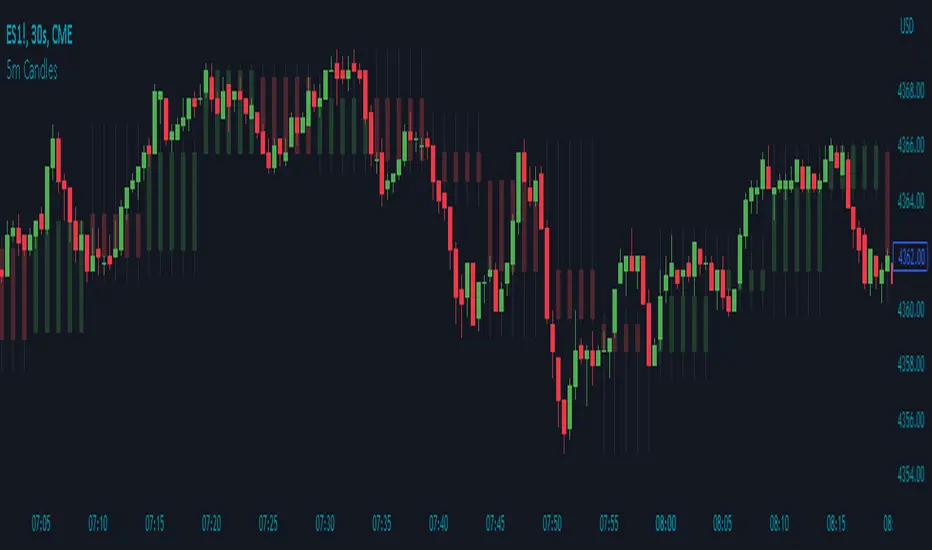
5m Candle OverlayDescription:
The 5m Candle Overlay indicator is a powerful technical analysis tool designed to overlay 5-minute candles onto your chart. This indicator enables detailed analysis of price action within the 5-minute time frame, providing valuable insights into short-term market movements.
How it Works:
The 5m Candle Overlay indicator calculates the OHLC (Open, High, Low, Close) values specifically for the 5-minute time frame. By utilizing the request.security function, it retrieves the OHLC values for each 5-minute candle. The indicator then determines the color for each candle based on a comparison between the close and open prices. Bullish candles are assigned a green color with 75% opacity, while bearish candles are assigned a red color with 75% opacity. Additionally, the indicator checks if the current bar index is a multiple of 5 to prevent overlapping and enhance visualization.
Usage:
To effectively utilize the 5m Candle Overlay indicator, follow these steps:
1. Apply the 5m Candle Overlay indicator to your chart by adding it from the available indicators.
2. Observe the overlay of 5-minute candles on your chart, providing a detailed representation of price movements within the 5-minute time frame.
3. Interpret the candles:
- Bullish candles (green by default) indicate that the close price is higher than the open price, suggesting potential buying pressure.
- Bearish candles (red by default) indicate that the close price is lower than the open price, suggesting potential selling pressure.
4. Note that the indicator plots candles with a vertical offset every fifth indicator to prevent overlapping, ensuring clarity and ease of interpretation.
5. Combine the analysis of the 5-minute candles with other technical analysis tools, such as support and resistance levels, trend lines, or indicators from different time frames, to gain deeper insights and identify potential trade setups.
6. Implement appropriate risk management strategies, including setting stop-loss orders and position sizing, to effectively manage your trades within the 5-minute time frame and protect your capital.
luckynickva OHLC
This Script Shows The OHLC Of The Higher Timeframe Candles In The Background Great For Not Losing Sight Of The Bigger Picture On The Lower Timeframe
Pattern Forecast (Expo)█ Overview
The Pattern Forecast indicator is a technical analysis tool that scans historical price data to identify common chart patterns and then analyzes the price movements that followed these patterns. It takes this information and projects it into the future to provide traders with potential price actions that may occur if the same pattern is identified in real-time market data. This projection helps traders to understand the possible outcomes based on the previous occurrences of the pattern, thereby offering a clearer perspective of the market scenario. By analyzing the historical data and understanding the subsequent price movements following the appearance of a specific pattern, the indicator can provide valuable insights into potential future market behavior.
█ Calculations
The indicator works by scanning historical price data for various candlestick patterns. It includes all in-built TradingView patterns, credit to TradingView that has coded them.
Essentially, the indicator takes the historical price moves that followed the pattern to forecast what might happen next.
█ Example
In this example, the algorithm is set to search for the Inverted Hammer Bullish candlestick pattern. If the pattern is found, the historical outcome is then projected into the future. This helps traders to understand how the past pattern evolved over time.
█ How to use
Providing traders with a comprehensive understanding of historical patterns and their implications for future price action allows them to assess the likelihood of specific market scenarios objectively. For example, suppose the pattern forecast indicator suggests that a particular pattern is likely to lead to a bullish move in the market. A trader might consider going long if the same pattern is identified in the real-time market. Similarly, a trader might consider shorting the asset if the indicator suggests a bearish move is likely, if the same pattern is identified in the real-time market.
█ Settings
Pattern
Select the pattern that the indicator should scan for. All inbuilt TradingView patterns can be selected.
Forecast Candles
Number of candles to project into the future.
-----------------
Disclaimer
The information contained in my Scripts/Indicators/Ideas/Algos/Systems does not constitute financial advice or a solicitation to buy or sell any securities of any type. I will not accept liability for any loss or damage, including without limitation any loss of profit, which may arise directly or indirectly from the use of or reliance on such information.
All investments involve risk, and the past performance of a security, industry, sector, market, financial product, trading strategy, backtest, or individual's trading does not guarantee future results or returns. Investors are fully responsible for any investment decisions they make. Such decisions should be based solely on an evaluation of their financial circumstances, investment objectives, risk tolerance, and liquidity needs.
My Scripts/Indicators/Ideas/Algos/Systems are only for educational purposes!

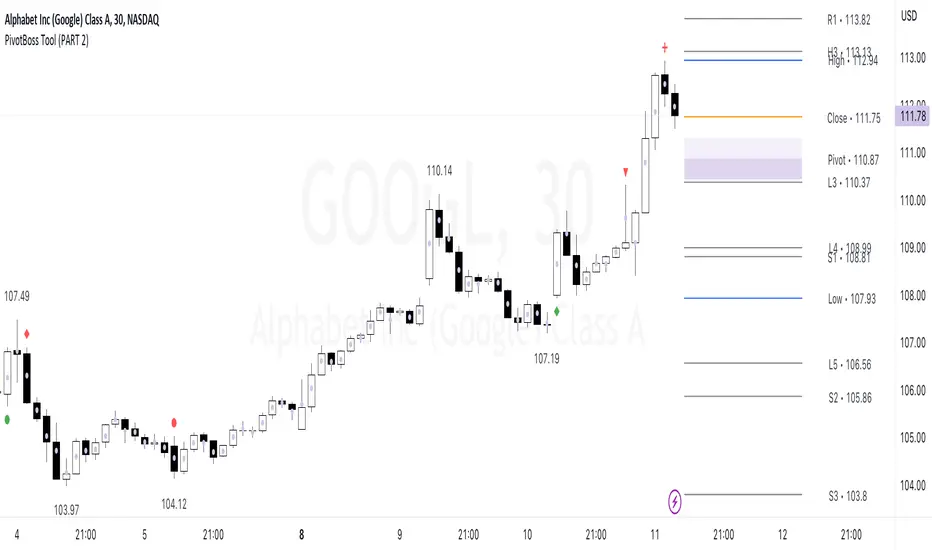
PivotBoss Tool (PART 2)Hello Everyone,
This indicator is being published on TradingView to help traders solve their multiframe EOD analysis issue and at the same time get additional information of other crucial information - CandleStick Patterns, Candlestick Midpoint and ATR Trails for trailing your SL's all under one single frame.
This indicator is based on the concepts of Secrets of Pivot Boss by Mr.Frank Ochoa and strives to provide more insightful information of pivot points and other general indicators being used by traders on day-to-day basis in the simplest format possible so that traders of all kinds can relate to the same.
And, this is purely dedicated to EOD analysis.
What is the moat of this Indicator?
This particular indicator is designed to help the traders in their EOD analysis as this indicator is well equipped to provide the next session trading pivot points well in advance at the end of the current day trading session. A trader has everything required for an EOD analysis in this particular indicator.
Below is the brief information of the indicator table you see in the layout of the above chart -
#Next Session Pivots
One can plot this feature to find out the developing pivot levels for upcoming D/W/M/Q/Y alongside it's additional pivot levels such as:
- Future Camarilla Pivots (H3/H4/H5 & L3/L4/L5)
- Future Floor Pivots (R1/R2/R3 & S1/S2/S3)
- Future CPR levels (TC/PIVOT/BC)
#Developing Pivot Cloud
One can check the developing CPR in Intraday itself by enabling the pivot cloud feature which can tell you multiple information to be with the trend and it's participants.
Basically a live extension of the current trading CPR according with the progress of the trading day.
#CandleStick Mid-Point
This can plot the midpoint of each candlestick on any timeframe for better understanding of buyer/seller's absorption!
#Candlestick Pattern Scans
So one can now easily filter out the candlesticks patterns which helps in decoding the chart in a better format for entry and exits. There are 4 candlesticks patterns included -
- Wick Reversal Pattern -
This pattern basically tells the wick strength which is actually a liquidity absorption by the stronger hand and the intensity and further direction of the move depends on the position of wick candle being formed indicated by green (bull) or red (bear) signal.
- Doji Reversal Pattern -
This pattern basically is used to identify the biasness of the market participants and further identifies a pause in the ongoing trend or a pause for the trend to get further liquidity for broader strength.
- Outside Reversal Pattern -
This pattern depicts the range of the previous candle of a specific timeframe has been tested at both the extreme and probably the price will consolidate in the that visible range for a while.
- Extreme Reversal Pattern -
This pattern basically points at a setup that looks for an extreme pattern of selling pressure and then looks to fade this behavior to capture a bullish move higher (reverse for shorts) and vice versa .
#ATR Trails
This a just a supertrend indicator sourced with ATR to track a short/long term trend change and can be used for trailing SL's when they are kept tight for big positions!
#CPR Trails
This is the most interesting feature with multiple permutations & combinations and can be used to analyse intraday as well as EOD and positional trends. Moreover, THIS FEATURE CAN ALSO INDENTIFY MICRO INTRADAY TREND AS SMALL AS EACH 5M TREND!!
This indicator will be updated with time and depending on community's feedback and requirements.
Credits -
- Mr. Frank Ochoa (Concepts and ideas from the book 'Secrets of PivotBoss' )
- TradingView (Providing a platform to traders to simply their trading through 'PineScript')
Regards,
Mukkull
Crypto Uptrend Script + Pullback//Volume CandlesDescription: his is an adaption of my Pullback candle - This works on all timeframes and Markets (Forex//Stocks//)
Crypto Uptrend Script with Pullback Candle allows traders to get into a trend when the price is at end of a pullback and entering a balance phase in the market (works on all markets). The use of Moving averages to help identify a Trends and the use of Key levels to help traders be aware of where strong areas are in the market.
This script can work really well in Crypto Bull Runs when used on HTF and with confluences
The script has key support and resistance zones which are made up of quarterly data. Price reacts to these areas but patience is required as price will take time to come into these areas
I have updated the Pullback Candle with the use of Volume to filter out the weak Pullback Candles -
There are new candles to the script.
The First candle is the Bullish Volume Candle - This candle is set to a multiplier of 2x with a crossover of 50/100 on Volume - this then will paint a purple candle.
Uses of the Bullish Volume Candle:
Breakthrough of key areas // special chart patterns
Rejection of key areas
End of a impulse wave (Profit Takers)
The second candle is a Hammer - I prefer using the Hammers on Higher Timeframes however they do work on all timeframes. .
The third candle is a Exhaustion of impulse downward move.
Uses of this candle - can denote a new trend but has to be with confluence to a demand area // support area or with any use of technical analysis - using this alone is not advised
The fourth candle is a indecision candle in the shape of a Doji - this candle can help identify if the trend is in a continuation or a reversal
This script can work really well in Crypto Bull Runs
Disclaimer: There will be Pullbacks with High Volume (Breakouts) and not go the way as intended but this script is to allow traders to get into trends at good price levels. The script can paint signals in areas where price is too expensive so please do your own due diligence on the markets as this script is to help get into good areas of price
Please leave a thumbs up if you like this script and message me for information on how to use the script.
