Aquas TrendIt’s a trend-following crossover system with:
A local fast/slow EMA cross for timing entries
A higher-timeframe EMA filter to only trade in the dominant trend
An ATR-based volatility filter so it only trades when the market is moving
ATR-based stop loss and take profit with fixed RR
It tries to catch swings in the direction of the larger trend and ignore chop.
Ortalama Gerçek Aralık (ATR)
Reward-Risk Visual Zones (RRZ)Reward–Risk Visual Zones (RRZ) – Structure-Driven Risk Mapping Engine
Most indicators tell you when to trade.
RRZ is designed to answer a different question:
“Is this setup worth the risk before I take the trade?”
RRZ is not a mashup of unrelated indicators.
It is a 3-stage risk engine that builds a complete trade “story” around each swing:
1. Market structure pivot → defines the trade idea
2. ATR volatility unit → defines the risk size
3. Projected reward → compares reward vs that risk and filters bad setups
The output is a visual trade map : entry, target, stop, and R:R, printed directly on chart at each qualified swing.
1. Market Structure Layer – Where trades are anchored
RRZ doesn’t fire signals from MA/RSI crossovers.
It begins with s wing structure :
• Uses ta.pivotlow() and ta.pivothigh() with user-controlled left/right sensitivity:
• Pivot Sensitivity (L) controls how wide a swing must be to qualify as a structural pivot.
• Pivot Confirmation (R) controls how fast/slow a pivot is confirmed (1 = almost real-time, larger values = safer but later).
• A confirmed swing low becomes the candidate anchor for a long R:R zone.
• A confirmed swing high becomes the candidate anchor for a short R:R zone.
Each pivot is stored with its exact price and bar index , so the rest of the logic is always anchored to a real swing instead of a random candle.
2. Volatility Layer – Turning ATR into a “risk unit”
Once a pivot is confirmed, RRZ measures local volatility using ATR:
• ATR length is configurable via ATR Length.
• ATR is not used as a trailing stop or overlay.
In RRZ it plays one specific role:
“One ATR = one unit of structural risk from this swing.”
From that:
Long scenario:
• Entry = pivot low
• Stop = Entry − 1 × ATR
Short scenario:
• Entry = pivot high
• Stop = Entry + 1 × ATR
This standardizes risk across different volatility regimes:
a 2R move in a quiet market and a 2R move in a volatile market are both “2 × ATR” from the structure.
3. Reward Projection Layer – Evaluating if the trade is worth it
RRZ then estimates how far price can realistically travel away from the pivot, given recent behaviour:
For longs (from swing low):
• Projects reward using the highest high in a rolling lookahead window (e.g., last 20 bars).
• Reward = HighestHigh – PivotLow
• Risk = ATR
• R:R = Reward / ATR
For shorts (from swing high):
• Projects reward using the lowest low in the window.
• Reward = PivotHigh – LowestLow
• Risk = ATR
• R:R = Reward / ATR
The user can set a minimum R:R filter via Min R:R Threshold.
• If R:R ≥ threshold → zone is tagged as “ GOOD R:R ” and highlighted in green (long) or red (short).
• If R:R < threshold → optionally still shown as “ LOW R:R ” in orange (so you can visually see “tempting but not worth it” trades).
This transforms a raw pivot + ATR into a quantified decision:
“From this swing, volatility says my stop is 1× ATR. Do I even have 2× ATR of room in my favour?”
4. Execution Map – How components work together on chart
Instead of just printing numbers, RRZ builds a full execution template for every qualifying swing:
• Entry line at the pivot price
• Target line at the reward projection price
• Stop line at pivot ± ATR
• A structured label including:
• LONG / SHORT direction
• “GOOD R:R” or “LOW R:R”
• Numerical R:R (e.g., 2.3 : 1)
• Entry, Target, Stop, current Close
A Cooldown Bars parameter prevents overlapping spam:
• After an R:R zone is created (long or short), the script waits X bars before considering another zone in the same direction.
• This keeps charts readable and focuses attention on the most recent high-quality swings.
RRZ also includes line style controls (solid/dashed/dotted) and separate colours for entry, target, and stop, so traders can quickly read the chart even without opening settings.
5. How to Use RRZ in a Trading Plan
RRZ is not a magic “buy/sell” button.
It is designed to sit on top of your existing strategy as a risk filter.
Typical workflows:
SMC / price-action traders:
• Use your own logic for BOS/CHoCH, order blocks, or liquidity sweeps.
• Use RRZ only where structure aligns and the zone shows GOOD R:R ≥ 2.0.
• Avoid setups where RRZ marks LOW R:R even if the pattern looks good.
System traders / swing traders:
• Use RRZ to standardize risk across assets and timeframes.
• Filter out trades where potential reward does not justify the stop, based on current ATR.
Beginners:
• Learn to stop taking trades where the target is too close and the stop is too wide.
• Visually understand how structural swings and volatility interact.
RRZ works across Forex, Crypto, Indices, and Stocks on intraday and higher timeframes.
Once a pivot is confirmed and a zone is plotted, its lines and labels do not repaint.
⸻
6. Why this invite-only script is more than a basic mashup
RRZ does use classic building blocks (pivots, ATR), but the value is in the way they are stitched into a single risk framework:
• It doesn’t run multiple separate indicators on chart.
Everything is computed inside one engine with a single purpose: structure-based R:R evaluation.
• ATR is not just “slapped on” as a stop line; it is treated as the core risk unit in the R:R calculation pipeline.
• Every zone is a coherent trade idea: from swing, to risk unit, to projected reward, to filtered label, to execution lines.
• The script is designed specifically to help traders do the one thing that almost no free indicator prioritizes:
“Say NO to low R:R trades automatically.”
This is what distinguishes RRZ from generic ATR-stop scripts or simple pivot overlays.
⸻
Important
• No performance promises.
• No marketing claims (“guaranteed”, “high win rate”, etc.).
• Purely a risk mapping & visualization tool.

MTRA Pro+ ScreenerMTRA Pro+ Screener an analysis tool that provides traders with critical market structure information on up to 10 instruments simultaneously. This indicator consolidates momentum direction, trend analysis, range relationships, and volatility metrics into a single dashboard.
## Key Features
- Customizable display with adjustable positioning, colors, and sizing
**Momentum & Trend Tracking**
- Real-time momentum direction via 5-period SMA slope analysis
- Short-term trend direction using 10-period SMA slope analysis
- Color-coded visual representation for quick interpretation
**Range Relationship Analysis**
- Current bar analysis relative to previous period (Inside, Outside, 2Up, 2Dn)
- Three-period historical view of recent price action patterns
- Immediate identification of breakout and consolidation scenarios
**ATR-Based Volatility Analysis**
- Real-time ATR percentage calculations showing current range vs. average
- Visual distinction between normal (<100% ATR) and extended (>100% ATR) conditions
- Identification of potential exhaustion zones for risk management
**Intraday ATR Levels**
- Dynamic support/resistance levels based on current timeframe ATR
- Real-time upper and lower boundaries for precise entries/exits
- Customizable line styles integrated with price scale
## Practical Applications
- **Context Assessment**: Quickly gauge market conditions across multiple intraday timeframes
- **Exhaustion Detection**: Identify overextended moves when ATR exceeds 100%
- **Confluence Analysis**: Spot potential setups when timeframes align
- **Risk Management**: Some traders will use ATR levels for dynamic stops and position sizing
- **Breakout Confirmation**: Distinguish false breakouts from genuine momentum shifts
## Configuration Options
- Full dashboard positioning and color customization
- Individual timeframe toggles
- Adjustable ATR periods and sensitivity thresholds
- Multiple line styles for level visualization

MTRA Intraday Pro+MTRA Pro Intraday is a multi-timeframe analysis tool that provides traders with critical market structure information across five intraday timeframes: 5m, 15m, 30m, 1h, and 4h. This indicator consolidates momentum direction, trend analysis, range relationships, and volatility metrics into a single dashboard.
***Dashboard Timeframes that are low than chart timeframes can be inaccurate - Because of this always focus attention on the details on higher timeframes for accurate data****
## Key Features
**Multi-Timeframe Analysis**
- Simultaneous analysis across 5m, 15m, 30m, 1h, and 4h timeframes
- Customizable display with adjustable positioning, colors, and sizing
**Momentum & Trend Tracking**
- Real-time momentum direction via 5-period SMA slope analysis
- Short-term trend direction using 10-period SMA slope analysis
- Color-coded visual representation for quick interpretation
**Range Relationship Analysis**
- Current bar analysis relative to previous period (Inside, Outside, 2Up, 2Dn)
- Three-period historical view of recent price action patterns
- Immediate identification of breakout and consolidation scenarios
**ATR-Based Volatility Analysis**
- Real-time ATR percentage calculations showing current range vs. average
- Visual distinction between normal (<100% ATR) and extended (>100% ATR) conditions
- Identification of potential exhaustion zones for risk management
**Intraday ATR Levels**
- Dynamic support/resistance levels based on current timeframe ATR
- Real-time upper and lower boundaries for precise entries/exits
- Customizable line styles integrated with price scale
## Practical Applications
- **Context Assessment**: Quickly gauge market conditions across multiple intraday timeframes
- **Exhaustion Detection**: Identify overextended moves when ATR exceeds 100%
- **Confluence Analysis**: Spot high-probability setups when timeframes align
- **Risk Management**: Use ATR levels for dynamic stops and position sizing
- **Breakout Confirmation**: Distinguish false breakouts from genuine momentum shifts
## Configuration Options
- Full dashboard positioning and color customization
- Individual timeframe toggles
- Adjustable ATR periods and sensitivity thresholds
- Multiple line styles for level visualization
## Who Benefits
- **Scalpers**: 5m/15m alignment for quick entries
- **Day Traders**: Multi-timeframe confluence for swing entries within the day
- **Intraday Swing Traders**: 1h/4h context for position holds
MTRA Pro Intraday transforms complex multi-timeframe analysis into clear, actionable market structure data without switching charts. This tool enhances decision-making by providing objective context across all relevant intraday timeframes in one view.

Pele CandlesPele Candles Indicator
Named after Pele, the Hawaiian goddess of volcanoes, this indicator identifies "explosive" candles with unusually large ranges that exceed a customizable ATR (Average True Range) threshold. These volcanic-like price movements often signal significant market activity where liquidity may have been swept from one side.
Pele candles appear as colored bars (blue for bullish, purple for bearish) when candle ranges surpass the ATR multiplier. While a single Pele candle doesn't guarantee direction, consecutive Pele candles in opposite directions can indicate potential trend reversals - much like volcanic eruptions that reshape the landscape.
The indicator helps traders spot moments of intense market activity and potential turning points, but should be used alongside other analysis tools for confirmation.
Features:
Customizable ATR period and multiplier
Visual highlighting of explosive price moves
Alert notifications for significant candles
No repainting - signals appear in real-time
******Make sure you go to visual order settings and bring to front******

Pua CandlesPua Candles Indicator
Named after "Pua," the Hawaiian word for flower, this indicator identifies small, delicate price movements that often precede significant market expansion. Like tiny flowers that can bloom into something magnificent, Pua candles represent seemingly insignificant moments that frequently mark exhaustion areas in the market.
Pua candles are both inside bars (contained within the previous bar's range) and small relative to the ATR threshold. These quiet, compressed price actions often signal consolidation before major moves. When price eventually expands beyond these delicate formations, it can lead to substantial directional movement.
The indicator highlights bullish Pua candles in teal and bearish ones in pink, making these critical junctures easy to spot. Pay special attention to follow-through action after Pua candles - they often mark the calm before the storm.
Features:
Identifies inside bars with small ATR-relative ranges
Customizable ATR period and smallness threshold
Visual highlighting with Hawaiian-inspired colors
Alert notifications for Pua formations and follow-through
No repainting - confirmed signals only
Perfect for spotting potential breakout setups and market turning points.
******Make sure you go to visual order settings and bring to front******

MTRA Pro+Momentum - Trend - Range - ATR Dashboard!
MTRA Pro+ is a comprehensive multi-timeframe analysis tool designed to provide traders with critical market structure information across six different timeframes. This indicator consolidates momentum direction, trend analysis, range relationships, and volatility metrics into a single, customizable dashboard.
Core Features:
Multi-Timeframe Dashboard
Simultaneous analysis across Daily, 24H, Weekly, Monthly, Quarterly, and Yearly timeframes
Customizable display options to focus on relevant timeframes for your trading style
Professional dashboard with adjustable positioning, colors, and sizing
Momentum & Trend Analysis
Real-time momentum direction based on 5-period SMA slope analysis
Short-term trend direction using 10-period SMA slope analysis
Configurable sensitivity settings to filter out market noise
Color-coded visual representation for quick interpretation
Range Relationship Analysis
Current bar analysis relative to previous period (Inside, Outside, 2Up, 2Dn)
Three-period historical view showing recent price action patterns
Immediate identification of breakout and consolidation scenarios
Context for potential continuation or reversal setups
ATR-Based Volatility Analysis
Real-time ATR percentage calculations showing current range relative to average
Visual distinction between normal (<100% ATR) and extended (>100% ATR) conditions
Identification of potential exhaustion zones when price extends beyond typical volatility
Context for position sizing and risk management decisions
Daily ATR Level Visualization
Dynamic support and resistance levels based on current daily ATR
Real-time upper and lower boundaries for intraday trading
Customizable line styles and positioning options
Price scale integration for easy reference
Comprehensive Alert System
Momentum direction changes across all timeframes
Trend direction changes for longer-term position management
Range relationship status changes for breakout/breakdown alerts
ATR percentage threshold crossings for volatility-based signals
Practical Applications:
Market Context Assessment Quickly assess whether the market is trending, consolidating, or experiencing unusual volatility across multiple timeframes. This context helps inform position sizing, entry timing, and exit strategies.
Exhaustion Detection When ATR percentages exceed 100%, price may be overextended relative to typical volatility, potentially signaling pullback opportunities or areas to reduce position size.
Confluence Analysis Identify high-probability setups when multiple timeframes align in momentum and trend direction, or spot potential reversal zones when shorter timeframes diverge from longer-term trends.
Risk Management Enhancement Use ATR-based levels for dynamic stop placement and the dashboard's range analysis to understand current market structure before entering positions.
Breakout Confirmation Range relationship analysis helps distinguish between false breakouts and genuine momentum shifts by providing context about recent price action patterns.
Configuration Options:
Visual Customization
Full dashboard positioning control (9 positions available)
Customizable colors for all elements
Adjustable text size and border styling
Toggle individual timeframes on/off
Technical Parameters
Adjustable ATR periods for each timeframe
Configurable momentum sensitivity thresholds
ATR level display options with margin controls
Multiple line style choices for level visualization
Who Benefits from MTRA Pro+:
Swing Traders: Multi-timeframe trend and momentum alignment for position entries
Day Traders: Real-time ATR levels and range analysis for intraday decision-making
Position Traders: Longer timeframe context for strategic position management
Risk Managers: Volatility-based metrics for dynamic position sizing
Important Notes:
This indicator provides market structure analysis and context - it does not generate specific buy/sell signals. Success depends on combining this information with your trading methodology, proper risk management, and market experience. The tool is designed to enhance decision-making by providing objective market structure data across multiple timeframes.
MTRA Pro+ transforms complex multi-timeframe analysis into an accessible, visual format that helps traders stay informed about market conditions without the need to manually switch between charts and timeframes.

Tripwire Pro+Tripwire – Trail-Based Trend Direction Indicator
OVERVIEW
Tripwire is a powerful, volatility-adaptive trailing indicator designed to keep traders on the right side of momentum while offering signals and alerts based on the users settings and filters.
CONCEPT & INSPIRATION
This indicator is directly inspired from the Zombie9Trail by Frosty (creator of the Zombie Pack and TickHunter for NinjaTrader).
When all filters are turned off, Tripwire replicates the core behavior of Zombie9Trail — delivering the same razor-sharp trailing logic.
Most of Frosty's testing has been done from the 1 minute time frame, while I have personally found for my style of trading the 5 minute time frame works better for me.
WHAT THIS VERSION ADDS — TradingView Enhancements
• Optional multi-layer trend filters (21, 34, 170 EMA) to separate high-probability pullbacks from actual trend changes
• Clean Buy/Sell/Pullback signal labels with alert conditions
• Real-time dashboard showing current trail value, trend state, and filter status
• Fully customizable ATR length, multiplier, source, and visual styling
• All values exported as plots — perfect for CSV download and strategy development
HOW TO USE
Filters ON (recommended for trend-following) → Take signals in the direction of the higher-timeframe trend. Great for staying in strong moves and avoiding fake outs.
Filters OFF (pure Zombie9Trail mode) → Possibly catch early reversals and ride new trends
CREDIT & RESPECT
Core trailing methodology and original genius: Frosty — creator of Zombie9Trail / Zombie Pack / TickHunter (NinjaTrader).
This TradingView adaptation was built in direct homage to his NinjaTrader work and with his encouragement. Everything beyond the base trailing logic (filters, dashboard, alerts, exportable plots, visual polish) is original.
DISCLAIMER
For educational and informational purposes only. Not financial advice. Past performance is no guarantee of future results. Test thoroughly.

WeeklyDealingRange Pro+ (Fib Edition)Weekly Dealing Range Indicator
Overview
The Weekly Dealing Range indicator identifies range + volatility based pivot levels that form at the close of the first trading session and extend for the entire week. This tool provides key reference points for both trending and range-bound market conditions.
What It Provides
Range High & Low: Weekly session extremes
Median Level: Mid-point of the weekly range
Weekly Open: First session opening price
Fibonacci Extensions: Calculated levels above the high and below the low
Practical Application
These levels serve as:
Reversal zones for mean reversion setups
Support/resistance reference points
Target levels for existing positions
Framework for building trade ideas around high-probability pivot areas
Key Features
Optional function based alerts
Traditional price crosses level alerts
Automatically updates each week
Clean, uncluttered chart display
Works across all timeframes
Suitable for all markets and instruments


Session Ranges Pro+Session Range Zones – Professional Edition
OVERVIEW
Professional visualization of the classic opening-range / Initial Balance concept across Asian, London, and Regular (US) sessions.
Displays the high/low of the user-defined opening window as thick, hierarchical filled zones with optional Fibonacci and standard-deviation extensions plus full alerting.
CONCEPT BACKGROUND
Using the high and low of the first 30–60 minutes of a session as key support/resistance is public-domain knowledge that has been standard in institutional trading for decades (Initial Balance, Opening Range, Session Range, etc.).
On TradingView the same principle was popularized under the name “Defining / DealingRange / DR/IDR” by TheMas7er and others.
IMPLEMENTATION & VALUE ADDED
This indicator follows the established, public-domain range-calculation methodology but has been completely rewritten with the following original enhancements:
• Clean, filled High / Mid / Low zones for instant visual hierarchy
• Intuitive Asian / London / Regular session labelling and fully custom timing
• Comprehensive dynamic & static Fibonacci and 50%/100% standard-deviation extensions
• Alert conditions on every zone, midline, opening level, and extension line
• Modern, modular code architecture using arrays and custom drawing functions
• No repainting, lightweight performance on any intraday timeframe
HOW TO USE
Apply to 1–15 min charts. Select desired sessions and formation period (30 or 60 min typical).
Shaded zones serve as primary support/resistance; extensions provide measured-move targets.
CREDIT & TRANSPARENCY
Core methodology: public domain (Initial Balance / Opening Range / Session Range).
Early TradingView popularization of the DR/IDR naming and feature set: TheMas7er **(with thanks to community contributors like bmsitiaan and trading-guide for refinements)**.
**Utilizes PineCoders' VisibleChart library for optimized chart rendering.**
This script uses the same foundational principle and logical input options but is an independent implementation. All visual presentation, zone system, multi-session handling, extension systems, alerting framework, and underlying code structure are original.
DISCLAIMER
For educational and informational purposes only. Not financial advice. Past performance is no guarantee of future results. Test thoroughly on your instruments and timeframes.

PonoTrading WDRWeekly Dealing Range Indicator
Overview
The Weekly Dealing Range indicator identifies range + volatility based pivot levels that form at the close of the first trading session and extend for the entire week. This tool provides key reference points for both trending and range-bound market conditions.
What It Provides
Range High & Low: Weekly session extremes
Median Level: Mid-point of the weekly range
Weekly Open: First session opening price
Standard Deviation Extensions: Calculated levels above the high and below the low
Practical Application
These levels serve as:
Reversal zones for mean reversion setups
Support/resistance reference points
Target levels for existing positions
Framework for building trade ideas around high-probability pivot areas
Key Features
Traditional price crosses level alerts
Automatically updates each week
Clean, uncluttered chart display
Works across all timeframes
Suitable for all markets and instruments

NeuraEdge ORB Professional Opening Range Breakout Indicator-15m🚀 NeuraEdge ORB - Professional Opening Range Breakout Indicator
We're excited to release this clean, effective Opening Range Breakout (ORB) indicator for the trading community. The 15-minute ORB is one of the most time-tested intraday strategies, and we've built this tool to make it simple and actionable.
━━━━━━━━━━━━━━━━━━━━━━━━━━━━━━━━━━━━━━━━━━━━━━━━━━━━
📖 WHAT IS THE 15-MINUTE ORB STRATEGY?
The Opening Range Breakout strategy captures the initial price range established in the first 15 minutes of market open (9:30-9:45 AM ET). This range often sets the tone for the trading day, as institutional order flow and overnight gap reactions play out during this window.
The concept is simple:
- Mark the HIGH and LOW of the first 15 minutes
- Trade the breakout when price breaks above or below this range
- Use the opposite side of the range as your stop loss
━━━━━━━━━━━━━━━━━━━━━━━━━━━━━━━━━━━━━━━━━━━━━━━━━━━━
⚙️ HOW TO USE THIS INDICATOR
1️⃣ SETUP
• Apply to SPY, QQQ, IWM, or any liquid stock/ETF
• Recommended timeframes: 1-minute or 5-minute charts
• The indicator automatically detects the 9:30-9:45 AM ET session
2️⃣ WAIT FOR THE RANGE
• A blue box will form showing the Opening Range
• Wait for the 15-minute period to complete (marked "✅ COMPLETE" in dashboard)
• Note the range size - larger ranges often mean stronger moves
3️⃣ TRADE THE BREAKOUT
• 🟢 LONG: When price closes above the Opening Range High
• 🔴 SHORT: When price closes below the Opening Range Low
• Signals appear automatically with entry, stop loss (SL), and take profit (TP) levels
4️⃣ MANAGE YOUR TRADE
• Stop Loss: Placed at opposite side of range (default) or midpoint
• Take Profit: Based on your selected Risk:Reward ratio
• The indicator tracks win rate automatically
━━━━━━━━━━━━━━━━━━━━━━━━━━━━━━━━━━━━━━━━━━━━━━━━━━━━
🎯 ENTRY TYPES
BREAKOUT MODE (Default)
- Enters immediately when price breaks the range
- More signals, catches the initial move
- Best for: Trending days, high momentum
RETEST MODE
- Waits for price to break out, then pull back to the range
- Fewer signals, better entry price
- Best for: Choppy days, tighter stops
━━━━━━━━━━━━━━━━━━━━━━━━━━━━━━━━━━━━━━━━━━━━━━━━━━━━
📊 SETTINGS EXPLAINED
Display Settings:
- Show Signals - Toggle buy/sell signals
- Show Opening Range Box - Visual box around the 15-min range
- Show Dashboard - Information panel with status and stats
Opening Range Settings:
- Opening Range Minutes - Default 15, adjustable 5-60
- Stop Trading After - Prevents late-day trades (default 3PM ET)
Entry Settings:
- Entry Type - Breakout or Retest
- Require Volume Confirmation - Only signals on above-average volume
- Require FVG Confluence - Adds Fair Value Gap filter for extra confirmation
Risk Management:
- Stop Loss Placement - Opposite Side / Midpoint / ATR Based
- Risk:Reward Ratio - Set your target (1.5 recommended)
━━━━━━━━━━━━━━━━━━━━━━━━━━━━━━━━━━━━━━━━━━━━━━━━━━━━
💡 TIPS FOR BEST RESULTS
✅ DO:
- Trade liquid instruments (SPY, QQQ, major stocks)
- Use 1-5 minute charts for better entry precision
- Respect the stop loss - the range defines your risk
- Pay attention to range size (0.5-1.5x ATR is ideal)
- Be patient - only 1-2 setups per day
❌ AVOID:
- Trading both directions on the same day
- Taking trades after 2-3 PM ET
- Very small ranges (likely to get chopped out)
- Low volume breakouts (often fail)
━━━━━━━━━━━━━━━━━━━━━━━━━━━━━━━━━━━━━━━━━━━━━━━━━━━━
📈 DASHBOARD INFORMATION
The dashboard shows:
- OR Status - Forming / Complete / Waiting
- OR High/Low - The range levels
- Range Size - In points and ATR multiples
- Breakout Direction - Long / Short / None
- Volume Status - High or Normal
- Win Rate - Tracked automatically
- W/L Record - Wins and losses count
━━━━━━━━━━━━━━━━━━━━━━━━━━━━━━━━━━━━━━━━━━━━━━━━━━━━
🔔 ALERTS INCLUDED
- Opening Range Complete - Notifies when the 15-min range is set
- ORB Long Signal - Buy signal triggered
- ORB Short Signal - Sell signal triggered
- Breakout Up/Down - Range broken (even without signal)
━━━━━━━━━━━━━━━━━━━━━━━━━━━━━━━━━━━━━━━━━━━━━━━━━━━━
⚠️ DISCLAIMER
This indicator is for educational and informational purposes only. Past performance does not guarantee future results. Always use proper risk management and never risk more than you can afford to lose. This is not financial advice.
━━━━━━━━━━━━━━━━━━━━━━━━━━━━━━━━━━━━━━━━━━━━━━━━━━━━
━━━━━━━━━━━━━━━━━━━━━━━━━━━━━━━━━━━━━━━━━━━━━━━━━━━━
We hope you find this indicator valuable in your trading journey!
💬 Questions or feedback? Leave a comment below.
🌐 Check out our full Indicator Suite: www.neura-edge.com
📧 Support: support@neura-edge.com
Happy Trading!

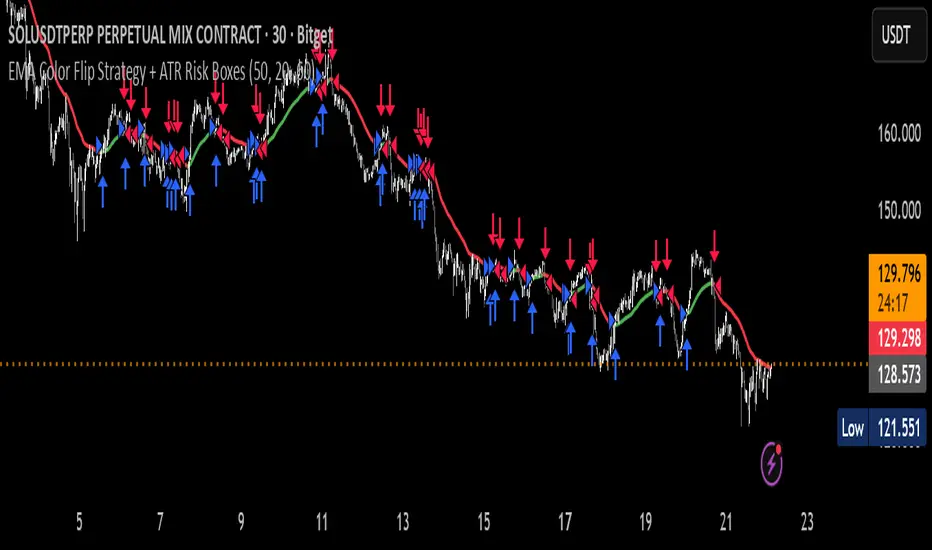
EMA Color Flip Strategy Experimenting on SOL 30 min chart, it seems good!
Let me know what you think!
WeeklyDealingRange Pro+Weekly Dealing Range Indicator
Overview
The Weekly Dealing Range indicator identifies range + volatility based pivot levels that form at the close of the first trading session and extend for the entire week. This tool provides key reference points for both trending and range-bound market conditions.
What It Provides
Range High & Low: Weekly session extremes
Median Level: Mid-point of the weekly range
Weekly Open: First session opening price
Standard Deviation Extensions: Calculated levels above the high and below the low
Practical Application
These levels serve as:
Reversal zones for mean reversion setups
Support/resistance reference points
Target levels for existing positions
Framework for building trade ideas around high-probability pivot areas
Key Features
Optional function based alerts
Traditional price crosses level alerts
Automatically updates each week
Clean, uncluttered chart display
Works across all timeframes
Suitable for all markets and instruments

SMC MTF + FVG + Trailing TP 100% [FIXED]Component Description
Entry Timeframe: H1
Trend Filter: D1 (EMA50 vs EMA200)
Trend Filter Only enter BUY orders if EMA50 > EMA200 on D1 (uptrend)
Only enter SELL orders if EMA50 < EMA200 (downtrend)
Break of Structure (BOS) Identify the previous swing high/low breakout point
Order Block (OB) The candle area before BOS is marked with an orange box
Fair Value Gap (FVG) Check for the presence of a price gap to confirm Entry
Trailing TP Trigger trailing after reaching the desired R (in pips or ATR)
ATR Volatility AlertsOverview:
This is a dynamic alert tool based on the Average True Range (ATR), designed to help traders detect sudden price movements that exceed normal volatility levels. Whether you are trading breakouts or monitoring for abnormal spikes, this indicator visualizes these events on the chart and triggers system alerts when the price move exceeds your specified ATR multiplier.
Key Features:
Fully Customizable ATR Range:
You can adjust the ATR Length (Default: 14) and the Multiplier (Default: 1.5x).
Tip: Increase the multiplier (e.g., to 2.0 or 3.0) to catch only extreme volatility, or lower it for scalping smaller moves.
Visual Chart Signals:
Visual markers appear instantly when a bar's movement exceeds the ATR threshold.
Green Triangle: Indicates an Upward Spike.
Red Triangle: Indicates a Downward Spike.
Flexible System Alerts:
Designed to integrate seamlessly with TradingView's alert system. You can choose from three specific alert directions based on your strategy:
1.Price Spike Up: Triggers only on sharp upward moves.
2.Price Spike Down: Triggers only on sharp downward moves.
3.Bidirectional Volatility Alert: Triggers on BOTH huge pumps and dumps.
How to Set Alerts:
Click the "Create Alert" button in TradingView.
Select ATR Volatility Alerts in the "Condition" dropdown.
Choose the specific logic you need:
· Select Price Spike Up for bullish monitoring.
· Select Price Spike Down for bearish monitoring.
· Select Bidirectional Volatility Alert to watch for any volatility expansion.


Two Supertrend Crossover SignalThis indicator is designed to visualize trend shifts using two Supertrend lines and a crossover-based signal system.
It also colors the area between the two Supertrend lines based on the current trend direction, making trend changes easy to identify at a glance.
How It Works
The indicator plots:
Fast Supertrend (shorter ATR length, lower factor)
Slow Supertrend (longer ATR length, higher factor)
A crossover between these two Supertrend lines indicates a possible trend shift.
Buy Signal
A BUY signal occurs when: Fast Supertrend crosses ABOVE Slow Supertrend
This suggests bullish momentum strengthening.
Sell Signal
A SELL signal occurs when: Fast Supertrend crosses BELOW Slow Supertrend
This suggests bearish momentum increasing.
Buy/Sell Signal Labels
The chart displays clear BUY (green) and SELL (red) labels at every crossover.
These signals help traders quickly pinpoint potential entries or exits.
This indicator is ideal for:
✓ Trend trading
✓ Swing trading
✓ Identifying momentum shifts
✓ Visual confirmation of market direction
✓ Combining with price action or EMA filters
You may adjust ATR length and multiplier depending on the timeframe:
For Scalping (1–5 min):
Fast ATR: 5–7
Slow ATR: 10–14
For Intraday (5–15 min):
Fast ATR: 7
Slow ATR: 10–14
For Swing Trading (1h–4h):
Fast ATR: 10
Slow ATR: 20
Important Notes
This indicator does not repaint the Supertrend values.
Signals are based on confirmed crossovers.
Use stop-loss and risk management appropriate for your strategy.
Always combine with market context (support/resistance, volume, etc.)

Scalper Pro Pattern Recognition & Price Action📘 Scalper Pro Pattern Recognition & Price Action
Overview
Scalper Pro is a dynamic multi-layer trend recognition and price action strategy that integrates Supertrend, Smart Money Concepts (SMC), and volatility-based risk control.
It adapts to market volatility in real time to enhance entry precision and optimize risk.
⚠️ This script is for educational and research purposes only.
Past performance does not guarantee future results.
🎯 Strategy Objectives
Detect structural market shifts (BOS / CHoCH) automatically.
Identify Order Blocks (OB), Fair Value Gaps (FVG), and key liquidity zones.
Plot dynamic Take-Profit (TP) and Stop-Loss (SL) levels based on ATR.
Avoid low-volatility (sideways) conditions using ADX filtering.
Combine trend-following signals with structural confirmation.
✨ Key Features
Supertrend Entry Signals — Generates precise buy/sell markers based on price crossovers with the Supertrend line.
Order Block Detection — Automatically plots both Internal and Swing Order Blocks for smart money insights.
Fair Value Gap Visualization — Highlights inefficiency zones in bullish or bearish structures.
Market Structure Labels — Marks Break of Structure (BOS) and Change of Character (CHoCH) points for clear trend shifts.
Dynamic Risk Levels — Automatically generates TP/SL lines and price labels using ATR-based distance.
📊 Trading Rules
Long Entry:
• Price crosses above the Supertrend (ta.crossover(close, supertrend))
• ADX above sideways threshold (trend condition confirmed)
• Optional confirmation from a bullish BOS or CHoCH
Short Entry:
• Price crosses below the Supertrend (ta.crossunder(close, supertrend))
• ADX above threshold
• Optional confirmation from a bearish BOS or CHoCH
Exit (or Reverse):
• Opposite Supertrend crossover
• Price hits TP/SL lines
• Trend shift confirmed by internal BOS/CHoCH
💰 Risk Management Parameters
Stop Loss & Take Profit based on ATR × risk multiplier
ATR Length: 14 (default)
Risk %: 3% per trade
Sideways Filter: ADX < 15 → no trade zone
TP1–TP3 = Entry ± (ATR × 1~3)
⚙️ Indicator Settings
Supertrend Module:
ATR Length: 10
Factor: nsensitivity × 7
ADX Module:
ADX Length: 15
Sideways Threshold: 15
EMA Set:
EMA (5, 9, 13, 34, 50) × Volatility Factor (3)
SMA Filter:
SMA(8) & SMA(9) for short-term trend confirmation
Smart Money Concepts Module:
Displays BOS/CHoCH, Order Blocks, FVGs, Equal Highs/Lows, and Premium/Discount zones
🔧 Improvements & Uniqueness
Integrates Supertrend momentum with Smart Money Concepts (SMC) structural analysis.
Dual detection layers: Internal (micro) and Swing (macro) structures.
ATR-driven auto labeling for entry, stop, and profit targets.
Premium/Discount and Equilibrium zones visualized on the chart.
Built-in ADX filter to skip low-trend market conditions.
✅ Summary
Scalper Pro Pattern Recognition & Price Action merges classical trend-following with modern market structure analytics.
It combines momentum detection, volatility control, and smart money mapping into one cohesive framework.
Unified trend, structure, and risk visualization.
Auto-marked BOS/CHoCH, OB, FVG, and liquidity zones.
Usable for scalping, intraday, or swing trading setups.
⚠️ This strategy is based on historical data and designed for educational use only.
Always apply sound risk management and forward testing before live trading.

ICT Sigma Hybrid FVGThis indicator combines three analytical components—statistical volatility modeling, ICT imbalance logic, and higher-timeframe bias filtering—to help traders interpret displacement-driven price inefficiencies. The goal is to reduce noise and highlight only meaningful FVGs that occur with sufficient volatility and directional context.
Sigma Volatility Zones
The script calculates statistically normalized deviation levels using a multi-regime standard deviation blended with ATR.
This produces adaptive volatility zones that:
Expand during trending or high-volatility periods
Contract during consolidation
Highlight extremes more accurately than fixed standard deviations
These zones help users identify where price is operating in premium/discount relative to recent volatility.
Fair Value Gaps With Displacement Scoring
Every potential FVG is evaluated using a displacement score based on candle body expansion, wick displacement, and relative move efficiency. FVGs that do not exceed the minimum score are filtered out. This ensures the script only displays gaps associated with meaningful movement, not minor pricing noise.
Optional Higher-Timeframe Bias Filter
The HTF bias engine evaluates structure using selected higher-timeframe EMAs.
When enabled, the indicator:
Shows bullish FVGs only in bullish higher-timeframe conditions
Shows bearish FVGs only in bearish conditions
Hides counter-trend FVGs that may have lower reliability
Users may disable this to see all qualifying gaps regardless of bias.
ATR-Adaptive Volatility Conditioning
ATR is blended into the model so the displacement score and sigma zones adjust automatically to sudden volatility changes such as:
Major economic releases
Earnings
High-impact market events
Overnight volatility shifts
This helps maintain consistent FVG quality during rapidly changing conditions.
How to Use the Indicator:
Use sigma levels to understand whether price is extended or discounted relative to recent volatility.
Monitor FVGs that appear within or near sigma extremes to identify potential exhaustion or continuation zones.
Combine HTF bias with LTF displacement gaps to align intraday entries with broader directional flow.
ATR-adjusted scoring helps distinguish between meaningful inefficiencies and low-quality gaps.
Example 1 — Intraday Sigma Expansion & Displacement FVG Reaction
Figure 1. Price collapses from a 4.5σ extreme during a volatility expansion event.
Only high-impact FVGs are shown due to the displacement filter, removing low-quality gaps.
Sigma bands expand dynamically as volatility increases, illustrating how the model adapts automatically.
Example 2 — Higher-Timeframe Sigma Compression After a Major Trend Leg
Figure 2. After a large macro move, sigma levels compress tightly, forming a volatility cluster.
These HTF sigma zones later act as reaction levels during continuation.
This demonstrates why the model blends HTF sigma structure with LTF displacement gaps for alignment.
Recommended Settings
Standard deviation lookback: 100
ATR length: 50
ATR blend weight: 0.5
Minimum Z-score: 1.8
Sigma levels: 1.5 / 3 / 4.5
HTF bias: Daily (optional)
FVG displacement filter: On

The Bear & Bull TieWhat it does:
Bear & Bull Tie is a moving average crossover indicator that identifies trend reversals and generates entry/exit signals based on the relationship between price and three simple moving averages (SMA 21, SMA 55, SMA 89). The indicator combines these three MAs into an Average Moving Average (AMA) to confirm directional bias, then uses ATR (Average True Range) volatility measurement for dynamic position sizing and stop-loss placement.
How it works:
The indicator operates on a simple but effective principle: it enters a bullish trend when price closes above all three moving averages simultaneously, and enters a bearish trend when price closes below all three MAs simultaneously. This "three MA alignment" approach filters out noise and confirms genuine trend changes. The indicator then plots:
Entry levels at the highest MA during uptrends or lowest MA during downtrends
Stop-loss zones calculated using 2x ATR distance from entry prices
Trend confirmation fill between price and the Average Moving Average, color-coded blue for bullish and red for bearish
The ATR-based stop-loss sizing adapts to market volatility, making it suitable for different market conditions and timeframes.
How to use it:
Monitor the filled zones to visually confirm your trend bias
Watch for alerts when new long or short setups form; entry prices and ATR-based stops are displayed on the chart
Trade the zones between your entry level and stop-loss zone, adjusting position size based on your risk tolerance
Exit when colors reverse to indicate trend termination
The indicator works best on higher timeframes (1H and above) where trend clarity is stronger and false signals are reduced.
Alerts: FOR AUTOMATION / NOTIFICATION's (create an alert for B/B tie (2, 4) that uses Any Alert / Function Call )
Long Positions:
entries ---> "Bull Tie on NVDA | Entry : 100.5 | ATR Stop : 99.5"
exits ------> "Bull Tie on NVDA | Exit : 110.1"
Short Positions:
entries ---> "Bear Tie on NVDA | Entry : 120.05 | ATR Stop : 85.05"
exits -----> "Bear Tie on NVDA | Exit : 100"
Credits:
This script incorporates concepts and code portions from @LOKEN94 with his explicit permission. Special thanks for the foundational logic that inspired this development.
Disclaimer:
This indicator is for educational and analytical purposes. It is not financial advice. Past performance does not guarantee future results. Always manage risk properly and use stops. Test thoroughly on historical data before live trading.

Energy Meter (Candle Range/ATR Ratio)Purpose:
This indicator is a simple, intuitive way to visualize auction energy — the actual force behind a price move — rather than just its appearance on the chart. It’s built on a single idea:
If a bar travels farther than normal in its fixed amount of time, something pushed harder than usual.
That “push” is auction energy, and it’s the raw material of microstructure inference: reading intent and imbalance from nothing more than candles, tempo, and volatility.
Traditional indicators focus on price patterns or volume. This one focuses on pressure — the underlying imbalance driving each bar.
How It Works
Each bar’s True Range is divided by its ATR, producing a normalized ratio:
1.0 = Average energy
>1.2 (default) = Above-normal energy
<1.0 = Quiet, low-pressure bars
This ratio is plotted as a histogram to highlight bursts of force, with a smoothed line added to show the tempo of recent energy changes.
When the histogram spikes, you’re seeing the auction flash its teeth: aggression, initiative, failed absorption, breakout ignition, or the first punch of a reversal.
When the line rolls over, you’re seeing the engine lose torque.
It’s a minimalist tool for seeing who is actually winning the auction, even when price looks deceptively calm.
Why It Matters
Price moves because of imbalance, not geometry. Two candles that look identical can represent completely different internal dynamics.
This indicator helps you see:
Breakout strength vs. fakeouts
Acceleration vs. drift
Exhaustion after extended runs
Reversal attempts with real intent
Quiet absorption before explosive moves
Shifts in aggression hidden inside consolidation
For new traders, it’s a clean introduction to microstructure inference — extracting meaningful order-flow insights without needing L2, DOM, or volume profile.
For experienced traders, it's a compact impulse detector that complements trend, volatility, and liquidity models.
Summary
This is a lightweight, first-principles tool designed to expose the energy signature of the auction: how hard the market is trying to go somewhere.
It doesn’t predict direction — it reveals pressure, so you can judge the quality of the move you’re trading.
Energy beats geometry.
Intent beats patterns.
Microstructure is hiding in every candle; this indicator makes it visible.
