ATR Report & Tool█ OVERVIEW
This indicator reports the historical probabilities of the price trading past its Average True Range (ATR).
█ CONCEPTS
It is common knowledge that the market is not likely to trade past 1x ATR. Is this true? How much unlikely exactly? The indicator reports the data in a table and tells you precisely how often the price made it past x times ATR.
You have identified two plausible entries at different price structures or two targets at significant projections; which one should you choose? While is it possible to reach them, is this indeed probable? The indicator complements your analysis for making sounds trading decisions.
█ FEATURES
Price Selection Tool
The indicator has a price selection tool embedded. You can select a price on the chart and it will show the distance relative to the ATR so you can easily refer to the historical probability table.
Multi-Timeframe
By default, the indicator uses the daily timeframe for analyzing how much price moves compared to its average volatility during a day. To the same extent, you can set it to any other timeframe.
Configurable ATR
• Pick your preferred smoothing between the Simple Moving Average (SMA) or the Relative Moving Average (RMA).
• Set the length for getting the average price movement. For example, you can set it to 20 for the daily ATR (20 trading days in a month), 12 for the weekly ATR (3 months), or 6 for the monthly ATR.
• Select the reference between “previous” or “current” ATR value (default set on previous).
Data Window
The indicator provides additional volatility-related values and reporting data.
Others
Automatically hides the indicator when the chart’s timeframe is higher than the indicator’s one.
█ NOTES
Calculation
The volatility is calculated from the selected period's low to high. It may use the previous close when the market gaps up/down.
Ortalama Gerçek Aralık (ATR)

Auto Order Block by D. BrigagliaThis indicator finds trend following engulfings, and draws order blocks based on the 1st candle's range (the first candle of the engulfing pattern).
It does filter the trend with simple moving averages of 21 and 55 periods, but it doesn't filter for retracements in the trend (you should consider only the order blocks that are coming from engulfings after a retracement)

Concept Dual SuperTrendSimple SuperTrend indicator giving you the option to display two SuperTrends on a single script plus additional customization features. Dual setup inspired by Income Sharks 🦈

EMA/Session/ATR/LotSizeSeveral indicators combined
1. 6 Exponential Moving Averages - Identifying the trend direction or using EMAs as a dynamic support/resistance.
2. Session on Chart - Highlighting session for day trading. London, New York, Tokyo, and Sydney.
3. Average True Range - display the Average True Range on recent price to calculate the volatility.
4. Lot Size Calculator - to calculate lot size based on account balance, risk per trade, atr stop-loss, and art multiplier.
5. ATRX - ATRX is an indicator that gives the value of the (close price - EMA 27)/ATR (14)
It tells how strong the trend is compared to its volatility
According to AJ. BANK FTMO Trader Thailand, if the value of ATRX is between 2X-3X or -2X-3X, you should consider trading using climax zone on timeframe H1.
If the ATRX is more than 3X or less than -3X but does not exceed 4X or -4X, you should consider trading using timeframe M15 in the climax zone.
However, if the ATRX exceeds 4X or -4X, use M5 instead.

SuperJump Turn Back Bollinger BandThis is a simple indicator using bolinger band return.
After the candle's bolinger band broke out,
Turn back inside BB is the entry point.
Usually there are more than two triangles, so you can wait after ordering a better price.
As you already know about it, it is very dangerous for the bolinger band to enter in the reverse direction when a strong trend is created.
That's why I made the Red Line. It is calculated by ATR and will suggest you an appropriate StopLoss value.

Seth_Signal
This script designed to identify up, down, and sideways trends. 200 HMA , 9 EMA , PSAR, and ATR are used to identify the strength of any instrument.
Candle Colors - Simpler approach to follow:
Green color indicates for up side trade signals
Red color indicates for down side trade signals
Yellow color can be interpreted for stop, sideways, and counter trade trade signals
Multiple Trade Setups:
Green Zone - Trading green candles within green zone has better odds of long trades
Red Zone - Trading red candles within red zone has better odds of short trades
200 HMA - Candles above 200 HMA mostly for long trades. Candles below 200 HMA usually for short trades. But the zone also very important to consider
9 EMA - Cross over above 200 HMA in Green zone, look for long trades. Cross over below 200 HMA in red zone, look for short trades
PSAR - This can be used as potential initial warning sign. Also can be used to exit partial or wait for it goes to opposite side for taking trade decisions
Candle Above all - If Green candle and above all the indicators, then very good sign of long side. If red candle and below all indicators, then very good sign of short side.
Multiple Time Frame:
This works very well with any instrument and on any time frame. Always its better to do analysis on multi time frame before entry, exit, and trade execution. Back test it with this setup and also observe it on live market. That will give edge in taking trade decisions. All the best and happy trading.
SuperTrend OptimizerHello!
This indicator attempts to optimize Supertrend parameters. To achieve this, 102 parameter combinations are tested concurrently - the top three performers are listed in descending order.
Parameters,
Factor: Changes to this parameter shifts the tested factor range. For instance, increasing the factor measure from 3.00 to 3.01 (+0.01) will remove 3.00 from the tested range - this setting controls the lower threshold of the range. The upper threshold, in all instances, is the lower Factor threshold + 3.3 (i.e. 3.0(lower) - 6.3(upper), 4.0(lower) - 7.3(upper), 2.5(lower) - 5.8(upper))
ATR period: Changes to this parameter shifts the tested ATR period range. For instance, increasing the ATR measure from 10 to 11 (+1) will remove 10 from the tested range - this setting controls the lower threshold of the range. The upper threshold, in all instances, is the lower threshold + 2 (i.e. 10(lower) - 12(upper), 11(lower) - 13(upper), 9(lower), - 11(upper))
The Factor parameter is modifiable to any positive decimal number; the ATR parameter is modifiable to any positive integer. Changing either parameter shifts the tested parameter combination range. Both parameters can be changed in the settings, to which you control the lower threshold of the range. If, for instance, you were to change the Factor measurement from 3.0 to 4.1 (+1.1) the 4.0 Factor measurement, and all Factor measures less than 4.0, will be excluded from the performance test.
Consequently, a Supertrend test will be performed with a Factor of 4.1 and an ATR period of 10 (default). This test repeats at 0.1 Factor intervals and 1.0 ATR intervals.
Therefore, assume you modify the Factor lower threshold to 3.1 and the ATR lower threshold to 10. The indicator will test three Supertrend systems with a Factor of 3.1 and an ATR period of 10.. then 11.. 12, then three systems with a Factor of 3.2 and an ATR period of 10.. then 11.. 12... until (lower Factor threshold + 3.3) and (lower ATR threshold + 2) are tested... which in this example is... a Factor of 6.4 and an ATR period of 12.
The tested Factor range and ATR range are displayed in a bottom right table alongside the top performing parameter combinations.
Of course, you can change the the lower thresholds, which means you can test numerous Supertrend parameter combinations! However, no greater than 102 parameter combinations will be tested simultaneously; the best performing Supertrend parameters are plotted on the chart automatically.
I will be working on this indicator more tomorrow! Let me know if you have questions or anything you would like included!
(I of course added something fun in the script. Be sure to try it with bar replay!)

Venky's Scalping Signals This indicator developed specifically for the use of scalping trading.
This is combination of Most powerful indicators available in the market
1. Central Pivot Range
2. Moving Average
3. Average True Range
All the above indicators are available independently, but as per my experience combination of all these will be very good support for scalping.
How to trade this setup.
Moving Average: Look for only Long trades when market is above 200 EMA and vice versa.
4 Types of EMA can be added, Standard values kept as 8, 20, 50 & 200 for identifying scalping entry
Enjoy the ride till price does not close below/upper of EMA 8.
20 EMA can be used in trending market to re-enter a trade when price takes support or rejection from 20 EMA near an important pivot zone.
Central Pivot Range: This will indicate the immediate support and resistance zones, and we can fix our entry and exit accordingly.
Available timeframes (change in inputs tab): Daily-D, Weekly -W, Monthly -M
Change from Standard Pivots / Camarilla Pivots is possible
Tomorrow pivot is added to give a framework to plan trades to carry over for the next day.
Average True Range: This indicates the market direction and look for Long trades while the market is trading above ATR curve.
if there is a signal at important Pivot points, it can prove to be a high probability trade.
For best results and trending move, if all the signals are in the same direction, it will have a most trending move on the day.
This indicator works on all time frame, but be sure that all the 3 signals are in the same direction before entering the trade.
For Long Entry
Best Time Frame = 4 Mins
ATR Line should be Green
Price to be above ATR Line
Market should be above 200 & 50 Moving Average (If from bottom 200, 50, 20 & 8 then it will excellent most probable profitable entry)
Buy signals (Yellow Up arrow mark) appears, Immediately enter the market, or you can wait for candle close.
Exit when Exit signal (Yellow Down Arrow mark).
Stop Loss - Normally entry candle low, and you can trail stop loss for every next candle low.
For short Entry
Best Time Frame = 4 Mins
ATR Line Should be Red
Price to be below ATR Line
Market should be below 200 & 50 Moving Average (If From Top 200, 50, 20 & 8 then it will excellent most probable profitable entry)
Sell Signals (Yellow Down Arrow Mark) appears, Immediately enter the market, or you can wait for candle close.
Exit when Exit signal (Yellow Up Arrow Mark).
Stop Loss - Normally entry candle low, and you can trail stop loss for every next candle low.
Trading psychology is important, if market above 200 Moving average, look for only Long Trades.
If market below 200 Moving average, look for only Short Trades.

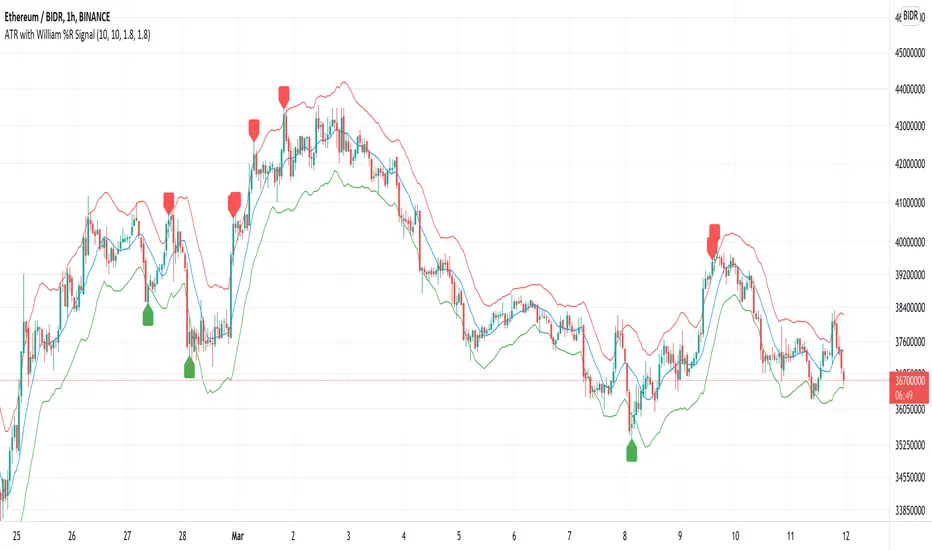
Multi-Timeframe ATR Levels█ OVERVIEW
This indicator plots the upside and downside ATR levels popularized by Trader Dante.
█ CONCEPTS
Beyond a level's boundary, a market is trading over its average volatility. The indicator adds confirmation to "reversal" setups located at likely mean reversion. Oppositely, it highlights trades with an increased risk where the price is over-extended and when the market is possibly exhausted.
Inside the levels’ boundaries, a market is trading within its average range. The indicator adds confluence to your target selection. Indeed, a target set at or nearby a level is at reasonable reach for the selected period. In addition, it can improve your stop placement. Tucking your stop-loss outside the boundary of a level adds an extra assurance that your stop is beyond reach.
█ FEATURES
Multi-Timeframe
By default, the indicator sets the timeframe to the daily for tracking how much price moves compared to its average volatility during a day. To the same extent, you can set it to any other timeframe. For example, you can use the weekly or the monthly timeframe for adjusting your trading during the week or when approaching the end of the month.
Configurable ATR
• Pick your preferred smoothing between the Simple Moving Average (SMA) or the Relative Moving Average (RMA). The SMA is used in the original MT4 indicator, and the RMA is the default in TradingView.
• Set the length for getting the average price movement. For example, you can set it to 20 for the daily ATR (20 trading days in a month), 12 for the weekly ATR (3 months), or 6 for the monthly ATR. Also, you may set a shorter length when you want to emphasize the recent price volatility.
• Apply a custom multiplier on the ATR when you want to focus on a particular price movement.
• Select the reference between “previous” or “current” ATR value (default set on previous).
Customizable Labels
• Personalize what info to show in the labels located on the right side of the levels. You can compose the data for showing the price, the ATR, both the price and the ATR or none.
• On hovering a label, a smart tooltip displays the complementary data. The less info a label displays, the more its tooltip shows.
• Choose how to display the values. In addition to the labels, the indicator can display the last values on the price scale, the status line, and the data window.
Enhanced Coloring
At a glance, see which level the price is approaching with the "Cold & Warm" coloring or quickly glimpse when the price has reached or exceeded the ATR with the "Overflow" coloring.
Others
• Automatically hides levels when the chart’s timeframe is higher than the indicator’s one.
• Alerts setting.
█ NOTES
Calculation
Upper band = low* + ATR
Lower band = high* - ATR
*The previous close is used when a gap up/down occurs.
This is a PREMIUM indicator. I also have a free version of the Daily ATR Levels .

ATR Trading SetupThis simple script base on function of ATR Trailing Stop (aka SuperTrend) to plot Trading Setup on chart with detail as below:
1. Type of Average True Range (ATR)
+ The function calculate ATR may base on 1 of 3 type of Average: RMA, SMA, EMA
2. Trading Setup
2.1 Long setup
+ SuperTrend is upTrend
+ Entry Long at (or below) last value ATR Trailing Stop of Previous Trend (DownTrend)
+ Stop loss at first value ATR Trailing Stop of now Trend (upTrend)
+ Take profit at first value ATR Trailing Stop of Previous Trend (downTrend)
+ Move stop loss follow ATR Trailing Stop (green dot)
2.1 Short setup
+ SuperTrend is downTrend
+ Entry Short at (or above) last value ATR Trailing Stop of Previous Trend (upTrend)
+ Stop loss at first value ATR Trailing Stop of now Trend (downTrend)
+ Take profit at first value ATR Trailing Stop of Previous Trend (upTrend)
+ Move stop loss follow ATR Trailing Stop (red dot)

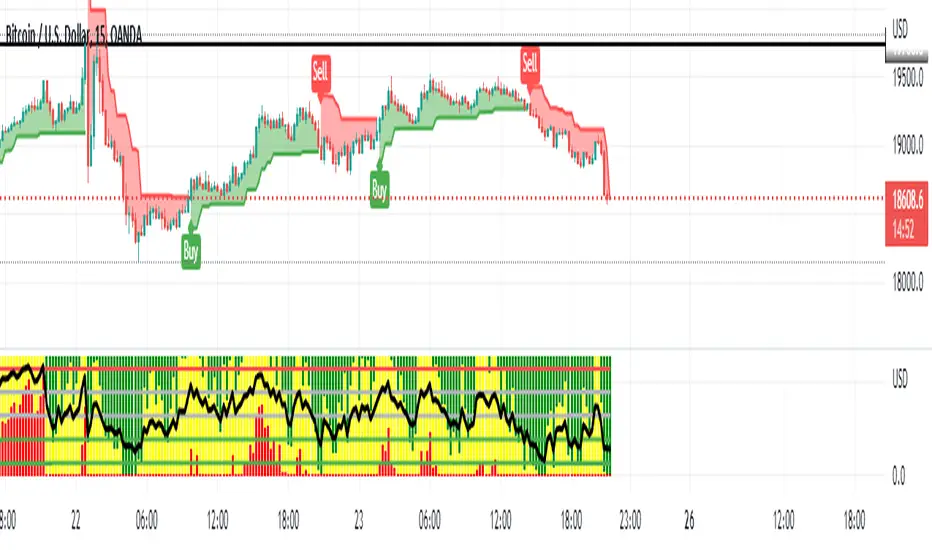
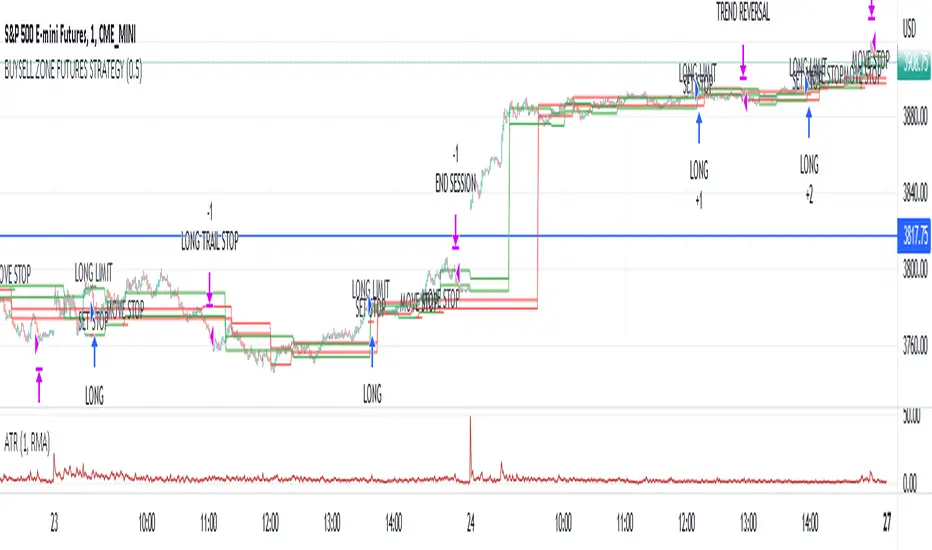
Market structure intraday ES futures strategy - BuySell ZonesThis market structure strategy for ES Mini Futures optimized for intraday market analysis ( RTH ).
Entry condition identified by bearish and bullish market structure.
Support level (Green Lines) is identified based on different variations of price fluctuations followed by the close above the range.
Resistance level (Red Lines) is identified based on different variations of price fluctuations followed by the close below the range.
The idea is to spot areas where market players were fighting for the best price and one side finally won.
Bullish trend is identified by consecutive series of support levels developing in upside direction.
Bearish trend is identified by consecutive series of resistance levels developing in downside direction.
When market develops bullish trend , strategy sets LONG limit order at fresh support level .
When market develops bearish trend , strategy sets SHORT limit order at fresh resistance level .
If there is an open position no new entries are performed.
For longs initial stop is set at previous support level adjusted by ATR.
For shorts stop is set at previous resistance level adjusted by ATR.
Stop trailing is also based on market structure.
If new support level is identified, stop moves to previous support level .
If new resistance level is identified, stop moves to previous resistance level .
There are no target. Strategy either gets stopped at current stop level or exits at session end.
Strategy calculates position size based on the previous market structure and ATR.
Strategy performs compounding position sizing so as account amount increases so does amount of traded contracts.
Usage:
Add script to your favorites and apply it on ES1! 1 minute time frame setting regular trading hours.
Script will print the limit order as well as stop levels according to the rules described above. As trade will progress, script will print levels to move the stop to.
Settings:
I added an option to disable the support and resistance lines printing if you prefer to have clean charts.
You can also change risk % to best fit your trading style.
If you just want to use the support and resistance levels as indicator you can also disable the strategy execution.
Support and Resistance indicator itself is universal and can be used on any market or timeframe.
If you want the strategy to be optimized for other markets or timeframes or have other rule set in mind feel free PM me, we will create the solution that best fits your needs and styles.
Real life trading is not get rich scheme. It is continuous process that involves various steps and dedication. If you are willing to take this path please PM me to enable the strategy for you.
Enjoy!
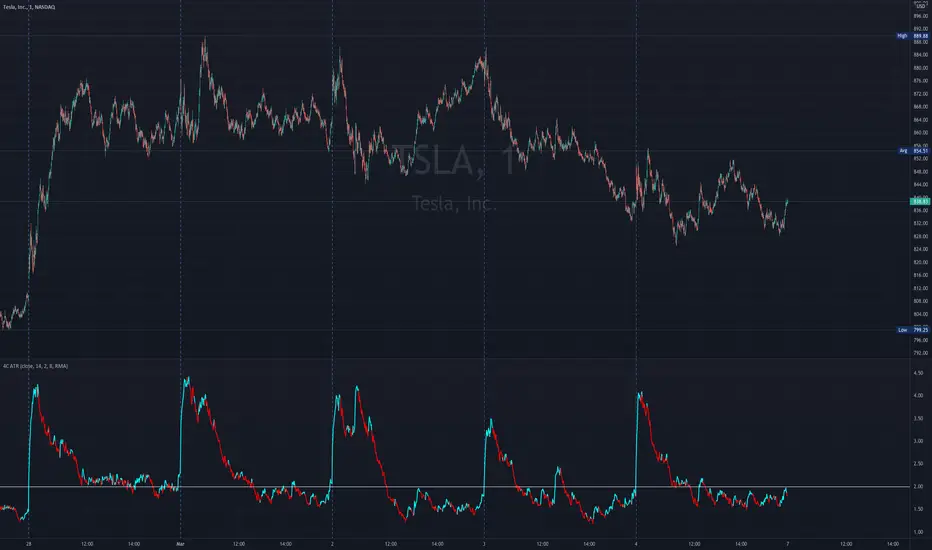
4c ATR ThresholdThe 4C ATR Threshold is a simple indicator that paints the chart background red when the ATR goes below the user defined ATR minimum.
Some trading setups have specific criteria that require a minimum ATR on a certain timeframe for the instrument to be playable.
The painting of the chart background based on the ATR value is useful as a quick visual reference.
The minimum ATR value can be adjusted to any specific level for any timeframe.
If the ATR dips below the user defined minimum, the trader can quickly see that the ATR is below the minimum criteria, and should not trade that instrument (based on their personal trade criteria).
If the background is not painted by the indicator, then the ATR is above the user defined minimum.
Parts of this script used the default/stock Tradingview ATR indicator to build from.
Volatility indicator based on ATR Hello,
I'm sharing to you a volatility indicator I've done in the last few weeks based on ATR. There is multiple functionalities on this indicator, the first one is an overlay displaying when an asset is in an "overvolatily zone"
(displayed with red cross) and when we are in an "undervolatily zone" (displayed with green cross). You can change the sensibility of the signals in the parameters if you wish to have more or less greedy signals
(it will only modify the overvolatility signals). By the way those signals are not working for week-ends because volatility works differently on week-ends and it's not a good idea to count week-ends in the calculations, so do not worry if you see no signals on weekends.
Second part of the indicator is something I called "Atr bands" it's an equivalent to the famous Bollinger-Bands but based on ATR. I haven't backtested them yet but they seems really interesting in low ut
(15 mins seems to be the best ut for those) and they seems pretty bad in high ut so they can maybe be useful for low ut scalping.
Last thing, there is a parameter allowing you to display bands on the week-ends so you can easily see where the indicator won't give signals.
I would be really happy if I could have some feedsback if you try the indicator :)
Have a wonderful day

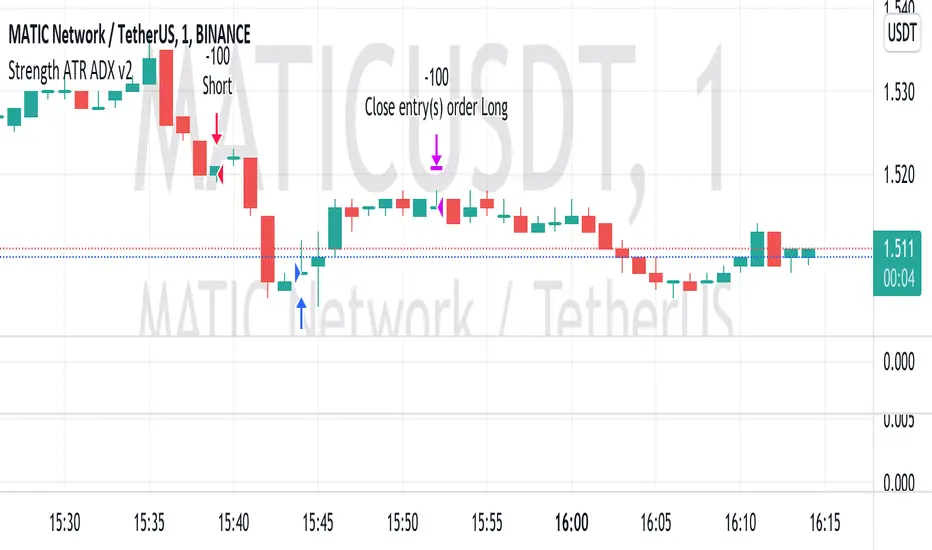
Strength ATR ADX v2This strategy looks for strong price movements with a high chance of a reversal on the difference in the rates of 6 currency pairs. A combination of ADX DI- and ATR is used for confirmation.
Added the ability to close trades by TP and SL to the strategy. (off by default)
Built-in martingale and reverse martingale (off by default)
The lot size is set in the strategy settings themselves!!!
The best results were obtained on XAUUSD 5M and on 1M cryptocurrency pairs.
4C ATR w/ Reference LineThe 4C ATR is a simple indicator that plots a horizontal line on the ATR indicator, which can be used as a minimum or maximum reference value.
Some trading setups have specific criteria that require a minimum ATR on a certain timeframe for the instrument to be playable. The horizontal line is useful as a quick visual reference, and can be adjusted to any specific level for any timeframe. If the ATR dips below the horizontal line, the trader can quickly see that the ATR is below the minimum criteria, and should not trade that instrument (based on their personal trade criteria).
This indicator also features a color change of the ATR line based on trend direction. If the ATR is trending up, it is painted blue, and if it starts to trend down, it is painted red. It uses a hidden simple moving average of the ATR, and the slope direction of the moving average paints the ATR line. The moving average length can be adjusted, and is set at a length of 8 for default. The ATR is set at a default value of 14.
Parts of this script used the default/stock Tradingview ATR indicator to build off of.
[BA] ATR Stop LineThis indicator helps you to set your stoploss levels by using ATR. Traders often use atr values in order to calculate their stoploss levels.
This indicator does the calculation for you and draw two tiny lines without messing up the chart so that you can easily see your stoploss levels and get an idea about the volatility and risk amount as well.
One line is below the last candle as a long trade stop loss level and the other one is above the last candle as a short trade stop loss level.
Calculation is simple:
For short trades, 2 times ATR added to last price;
For long trades, 2 times ATR subtracted from last price.
You can change ATR length, ATR multiplier and the line length.
Good luck.

Supertrend ATR Companion LinesThis is a full set of lines and labels for multi timeframe supertrend based ATRs that match the table in the Supertrend ATR Table indicator.
Each line and label can be individually switched on or off.
The labels have a default offset of -12 so they appear just to the right of the last bar but this is user configurable by input and so is the size of each label.
Please refer to the Supertrend ATR Table for a further description

Supertrend ATR TableThis is a multi timeframe table that shows a supertrend based ATR for timeframes from 5 minutes to monthly.
It is one half of a set of two indicators. This one is the table and the other one, Supertrend Lines Labels Full Set plots lines and labels.
The table is arranged left to right from shortest to highest timeframe
There are also alerts for each timeframe ATR that are best placed on a chart of 15 min or higher to avoid multiple repeat alerts within a short span of time.
One of the higher level uses is to track trend progression by seeing price move from timeframe ATR to another
User inputs cover colors, and how far in ticks "near" is defined as there are four colors in the table - up, down, up/near and down/near
The ATR settings are also changeable by user input

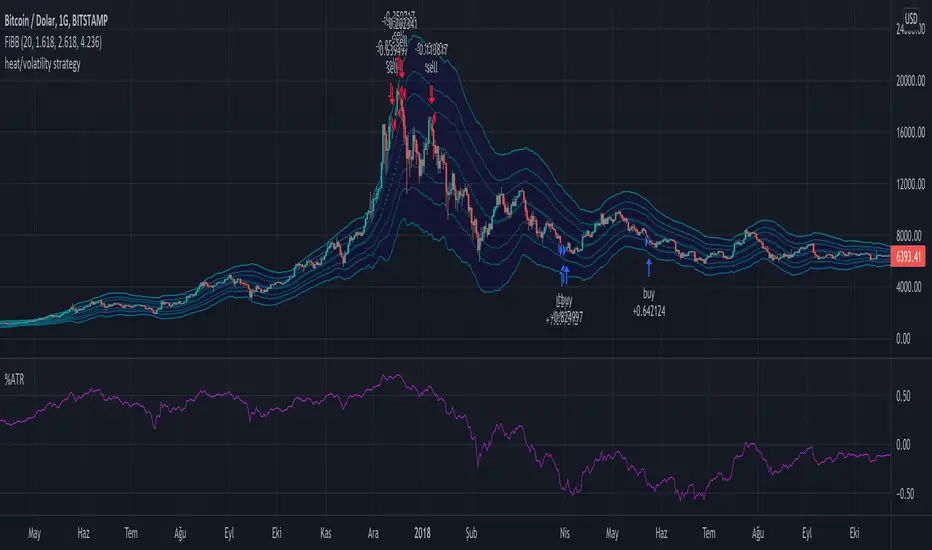
Long Term Heat/Volatility - Accumulation/Distribution v1This is a strategy specifically made for 1D BTC/USD with the aim of capturing cycle tops and bottoms. It's mainly based on two indicators: 21d average of ATR (volatility) and (BTC.price - 180d sma)/BTC.price (heat). The strategy only signals buys or sells after occurrences of high volatility, followed by extremely high or low heat values. It's optimized for utilizing accumulation and distribution at lower and higher prices respectively with respect to last 14 days. 2nd version will include dynamic dollar cost averaging during the accumulation and distribution periods.
Position Size Calc. (Risk Management Tool)Programmed this tool to help prevent overtrading.
Example of application:
Suppose you want to trade ETHUSDT on a 1 minute chart and you are only willing to risk $10 in one single trade. This way, if you get stopped out, then you will only lose $10. Say you are using ATR based stop loss at 2x current ATR to set the initial stop. All these variables are now fixed, so you must make an adjustment to the size of your position.
Quick illustration: Tolerable loss per trade is $10 , the current ATR of ETHUSDT is $4.06, the size of your stop is $8.12 (4.06*2), then your position size should be 1.2 ETH ($10/$8.12).
This script will constantly monitor the current ATR and display the optimal position size on chart. Tolerable loss (aka "Risk amount") is defined by user in settings. Lines showing the size of SL and TPs on chart are optional, it was added to the script to help users draw the long/short position measuring tools built into TradingView.
Other notes: Always consider market liquidity, size of bid-ask spreads, and the possibilities of gap ups/downs. It can never be guaranteed that stop market/limit orders will get filled at desirable prices. Actual stop losses might differ.

Volatility Cloud (SAR)Inspired by the Volatility Index from Wilder
Apply the SAR point to highs, lows ans medians and create a cloud of volatility

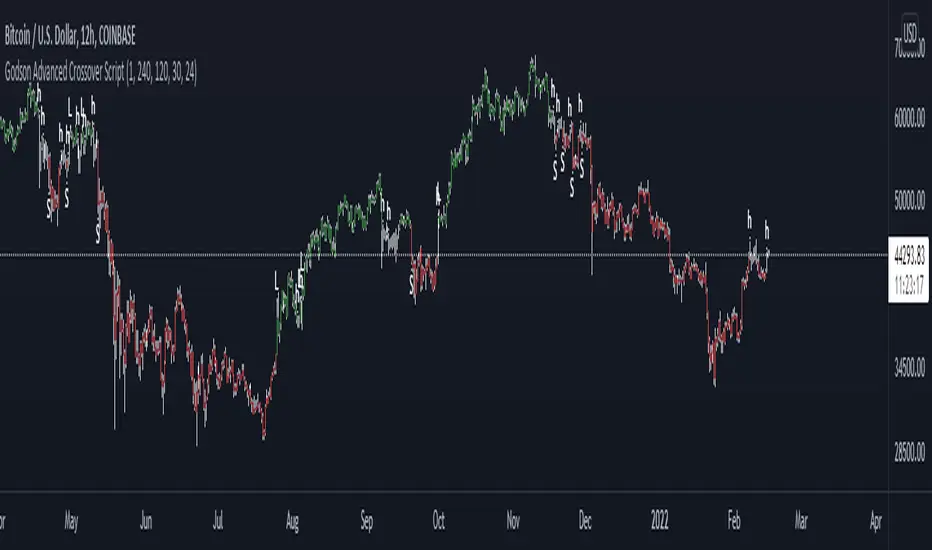
Godson Advanced Crossover ScriptThe Godson Advanced Crossover Script is advanced because it does two things
1: as a trend following indicator the script uses 2 VWAP ema's offset by 1 day(this is adjustable) and an ATR upper and lower band to find entries into larger trends.
2: it also allows you to setup alerts on a lower timeframe that follow a higher timeframe for example, if the 12hr is bearish(candles are red), you can trade shorts only in the 15min timeframe.
The script produces 3 signals
L: this is a long signal, this is signaled when the ema's crossover and the candle breakouts of the ATR bands, if the signal agrees with the upper trend
S: this is a short signal, it signals when the ema's crossunder and the candle breaks down of the ATR bands, if the signal agrees with the upper trend
H: this is for anything in-between, A is for apple, H is for Hedge.
you can set the upper trend timeframe to the same as the lower trend if you want all signals to alert
you can also turn the lines on or off if you need to visualize things
i will update this script as we progress