PRO Scalper(EN)
## What it is
**PRO Scalper** is an intraday price–action and liquidity map that helps you see where the market is likely to move **now**, not just where it has been.
It combines five building blocks that professional scalpers often watch together:
1. **Session Volume-Weighted Average Price (VWAP)** — the intraday “fair value” anchor.
2. **Opening Range** — the first minutes of the session that set the day’s balance.
3. **Trend filter** — higher-timeframe bias using **Exponential Moving Averages (EMA)** and optional **Average Directional Index (ADX)** strength.
4. **Two independent Supply/Demand zone engines** — zones are drawn from confirmed swing pivots, with midlines and **touch counters**.
5. **Order-flow style visuals**:
* **Delta bubbles** (green/red circles) show where buying or selling pressure was unusually strong, using a safe **delta proxy** (no external feeds).
* **Liquidity densities** (subtle rectangular bands) highlight clusters of large activity that often act as magnets or barriers and disappear when “eaten” by strong moves.
This mix gives you a **complete intraday picture**: the mean (VWAP), the day’s initial balance (Opening Range), the higher-timeframe push (trend filter), the nearby fuel or brakes (zones), and the live pressure points (bubbles and densities).
---
## Why these components
* **VWAP** tracks where the bulk of traded value sits. Price tends to rotate around it or accelerate away from it — a perfect compass for scalps.
* **Opening Range** frames the early auction. Many intraday breaks, fades and retests start at its boundaries.
* **EMA bias + ADX strength** separates trending conditions from chop, so you can keep only the zones that agree with the bigger push.
* **Pivot-based zones (two pairs at once)** are simple, objective and fast. Midlines help with confirmations; touch counters quantify how many times the zone was tested.
* **Bubbles and densities** add the “effort” layer: where the push appeared and where liquidity is concentrated. You see **where** a move is likely to continue or fail.
Together they reduce ambiguity: **context + level + effort** — all on one screen.
---
## How it works (plain language)
* **VWAP** resets each day and is calculated as the cumulative sum of typical price multiplied by volume divided by total volume.
* **Opening Range** is either automatic (a multiple of your chart timeframe) or a manual number of minutes. While it is forming, the highest high and lowest low are captured and plotted as the range.
* **Trend filter**
* **EMA Fast** and **EMA Slow** define directional bias.
* **ADX (optional)** adds “trend strength”: only when the Average Directional Index is above the chosen threshold do we treat the move as strong. You can source this from a higher timeframe.
* **Zones**
* There are **two independent pairs** of pivots at the same time (for example 10-left 10-right and 5-left 5-right).
* Each detected pivot creates a **Supply** (from a swing high) or **Demand** (from a swing low) box. Box depth = **zone depth × Average True Range** for adaptive sizing; the boxes **extend forward**.
* Midline (optional dashed line inside the box) is the “balance” of the zone.
* **“Only in trend”** mode can hide boxes that go against the higher-timeframe bias.
* The **touch counter** increases when price revisits the box. Labels show the pair name and the number of touches.
* **Bubbles**
* A safe **delta proxy** measures bar pressure (for example, range-weighted close vs open).
* A **quantile filter** shows only unusually large pressure: choose lookback and percentile, and the script draws a circle sized by intensity (green = bullish pressure, red = bearish).
* **Densities**
* The script marks heavy activity clusters as **subtle bands** around price (depth = fraction of Average True Range).
* If price **breaks** a density with volume above its moving average, the band **disappears** (“eaten”), which often precedes continuation.
---
## How to use — practical playbooks
> Recommended chart: crypto or index futures, one to five minutes. Use **one hour** or **fifteen minutes** for the higher-timeframe bias.
### 1) Trend pullback scalp (continuation)
1. Enable **Only in trend** zones.
2. In an uptrend: wait for a pullback into a **Demand** zone that overlaps with VWAP or sits just below the Opening Range midpoint.
3. Look for **green bubbles** near the zone’s bottom or a fresh **density** under price.
4. Enter on a candle closing **back above the zone midline**.
5. Stop-loss: below the bottom of the zone or a small multiple of Average True Range.
6. Targets: previous swing high, Opening Range high, fixed risk multiples, or VWAP.
Mirror the logic for downtrends using Supply zones, red bubbles and densities above price.
### 2) Reversion with liquidity sweep (fade)
1. Bias neutral or countertrend allowed.
2. Price **wicks through** a zone boundary (or an Opening Range line) and **closes back inside** the zone.
3. The bubble color often flips (absorption).
4. Enter toward the **inside** of the zone; stop beyond the sweep wick; first target = zone midline, second = opposite side of the zone or VWAP.
### 3) Opening Range break and retest
1. Wait for the Opening Range to complete.
2. A break with a large bubble suggests intent.
3. Look for a **retest** into a nearby zone aligned with VWAP.
4. Trade continuation toward the next zone or the session extremes.
### 4) Density “eaten” continuation
1. When a density band **disappears** on high volume, it often means the resting liquidity was consumed.
2. Trade in the direction of the break, toward the nearest opposing zone.
---
## Settings — quick guide
**Core**
* *ATR Length* — used for zone and density depths.
* *Show VWAP / Show Opening Range*.
* *Opening Range*: Auto (multiple of timeframe minutes) or Manual minutes.
**Trend Filter**
* *Mode*: Off, EMA only, or EMA with ADX strength.
* *Use higher timeframe* and its value.
* *EMA Fast / EMA Slow*, *ADX Length*, *ADX threshold*.
* *Plot EMA filter* to display the moving averages.
**Zones (two pairs)**
* *Pivot A Left / Right* and *Pivot B Left / Right*.
* *Zone depth × ATR*, *Extend bars*.
* *Show zone midline*, *Only in trend zones*.
* Labels automatically show the touch counters.
**Bubbles**
* *Show Bubbles*.
* *Quantile lookback* and *Quantile percent* (higher percent = stricter filter, fewer bubbles).
**Densities**
* *Metric*: absolute delta proxy or raw volume.
* *Quantile lookback / percent*.
* *Depth × ATR*, *Extend bars*, *Merge distance* (in ATR),
* *Break condition*: volume moving average length and multiplier,
* *Midline for densities* (optional dashed line).
---
## Tips and risk management
* This script **does not use external order-flow feeds**. Delta is a **proxy** suitable for TradingView; tune quantiles per symbol and timeframe.
* Do not trade every bubble. Combine **context (trend + VWAP + Opening Range)** with **level (zone)** and **effort (bubble/density)**.
* Set stop-losses beyond the zone or at a fraction of Average True Range. Predefine risk per trade.
* Backtest your rules with a strategy script before using real funds.
* Markets differ. Parameters that work on Bitcoin may not transfer to low-liquidity altcoins or stocks.
* Nothing here is financial advice. Scalping is high-risk; slippage and over-trading can quickly damage your account.
---
## What makes PRO Scalper unique
* Two **independent** zone engines run in parallel, so you can see both **larger structure** and **fine intraday levels** at the same time.
* Clean **“only in trend” rendering** — zones and midlines against the bias can be hidden, reducing clutter and hesitation.
* **Touch counters** convert “feel” into numbers.
* **Self-contained order-flow visuals** (bubbles and densities) that require no extra data sources.
* Careful defaults: subtle colors for densities, clearer zones, and responsive auto Opening Range.
---
(RU)
## Что это такое
**PRO Scalper** — это индикатор для внутридневной торговли, который показывает **контекст и ликвидность прямо сейчас**.
Он объединяет пять модулей, которыми профессиональные скальперы пользуются вместе:
1. **VWAP** — средневзвешенная по объему цена за сессию, «справедливая стоимость» дня.
2. **Opening Range** — первая часть сессии, задающая баланс дня.
3. **Фильтр тренда** — направление старшего таймфрейма по **экспоненциальным средним** и при желании по силе тренда **Average Directional Index**.
4. **Две независимые системы зон спроса/предложения** — зоны строятся от подтвержденных экстремумов (пивотов), имеют **среднюю линию** и **счетчик касаний**.
5. **Визуализация «ордер-флоу»**:
* **Пузыри дельты** (зеленые/красные круги) — места повышенного покупательного/продажного давления, рассчитанные через безопасный **прокси-дельты**.
* **Плотности ликвидности** (ненавязчивые прямоугольные ленты) — скопления объема, которые нередко притягивают цену или удерживают ее и исчезают, когда «разъедаются» сильным движением.
Итог — **полная картинка момента**: среднее (VWAP), баланс дня (Opening Range), старшая сила (фильтр тренда), ближайшие уровни топлива/тормозов (зоны), текущие точки усилия (пузыри и плотности).
---
## Почему именно эти элементы
* **VWAP** показывает, где сосредоточена стоимость; цена либо вращается вокруг него, либо быстро уходит — идеальный ориентир скальпера.
* **Opening Range** фиксирует ранний аукцион — от его границ часто начинаются пробои, возвраты и ретесты.
* **EMA + ADX** отделяют тренд от «пилы», позволяя оставлять на графике только зоны по направлению старшего таймфрейма.
* **Зоны от пивотов** просты, объективны и быстры; средняя линия помогает подтверждать разворот, счетчик касаний переводит субъективность в цифры.
* **Пузыри и плотности** добавляют слой «усилия»: где именно возник толчок и где сконцентрирована ликвидность.
Комбинация **контекста + уровня + усилия** уменьшает двусмысленность и ускоряет принятие решения.
---
## Как это работает (простыми словами)
* **VWAP** каждый день стартует заново: сумма «типичной цены × объем» делится на суммарный объем.
* **Opening Range** — автоматический (кратный минутам вашего таймфрейма) или вручную заданный период; пока он формируется, фиксируются максимум и минимум.
* **Фильтр тренда**
* Две экспоненциальные средние задают направление.
* **ADX** (по желанию) добавляет «силу». Источник можно взять со старшего таймфрейма.
* **Зоны**
* Одновременно работает **две пары** пивотов (например 10-лево 10-право и 5-лево 5-право).
* От пивота строится зона **предложения** (от максимума) или **спроса** (от минимума). Глубина зоны = **коэффициент × Average True Range**; зона тянется вперед.
* Внутри рисуется **средняя линия** (по желанию).
* Режим **«только по тренду»** скрывает зоны против старшего направления.
* **Счетчик касаний** увеличивается, когда цена снова входит в зону; подпись показывает пару и количество касаний.
* **Пузыри**
* Используется безопасный **прокси-дельты** — измерение «напряжения» внутри свечи.
* Через **квантильный фильтр** выводятся только необычно сильные места: настраиваются окно и процент квантиля; размер кружка — сила, цвет: зеленый покупатели, красный продавцы.
* **Плотности**
* Крупные активности отмечаются **ненавязчивыми прямоугольниками** (глубина — доля Average True Range).
* Если плотность **пробивается** объемом выше среднего, она **исчезает** — часто это предвещает продолжение.
---
## Как пользоваться — практические схемы
> Рекомендация: крипто или фьючерсы, таймфрейм 1–5 минут. Для старшего фильтра удобно взять **1 час** или **15 минут**.
### 1) Скальп на откат по тренду
1. Включите **«только по тренду»**.
2. В восходящем тренде дождитесь отката в **зону спроса**, желательно рядом с **VWAP** или серединой **Opening Range**.
3. Подтверждение — **зеленые пузыри** у нижней границы зоны или свежая **плотность** под ценой.
4. Вход после закрытия свечи **выше средней линии** зоны.
5. Стоп-лосс: за нижнюю границу зоны или небольшой множитель Average True Range.
6. Цели: предыдущий максимум, верх Opening Range, фиксированные R-множители, либо VWAP.
Для нисходящего тренда зеркально: зоны предложения, красные пузыри и плотности над ценой.
### 2) Контрдвижение с «выбиванием ликвидности»
1. Нейтральный или контртрендовый режим.
2. Цена **выносит хвостом** границу зоны (или линию Opening Range) и **закрывается обратно внутри**.
3. Цвет пузыря часто меняется (поглощение).
4. Вход внутрь зоны; стоп — за хвост выбивания; цели: средняя линия, противоположная граница зоны или VWAP.
### 3) Пробой Opening Range + ретест
1. Дождитесь завершения диапазона.
2. Сильный пробой с крупным пузырем — признак намерения.
3. Ищите **ретест** в зоне по тренду рядом с линией диапазона и VWAP.
4. Торгуйте продолжение к следующей зоне.
### 4) Продолжение после «съеденной» плотности
1. Когда прямоугольник плотности **исчезает** на повышенном объеме, это значит, что ликвидность поглощена.
2. Торгуйте в сторону пробоя к ближайшей противоположной зоне.
---
## Настройки — краткая шпаргалка
**Core**
— Длина Average True Range (для размеров зон и плотностей).
— Включение VWAP и Opening Range.
— Длина Opening Range: автоматическая (кратная минутам ТФ) или ручная.
**Trend Filter**
— Режим: выкл., только средние, либо средние + ADX.
— Источник со старшего таймфрейма и его значение.
— Длины средних, длина ADX и порог силы.
— Показать/скрыть линий средних.
**Zones (две пары одновременно)**
— Пара A: лев/прав; Пара B: лев/прав.
— Глубина зоны × Average True Range, продление по барам.
— Средняя линия, режим **«только по тренду»**.
— Подписи со счетчиком касаний.
**Bubbles**
— Вкл./выкл., окно поиска и процент квантиля (чем выше процент — тем реже пузыри).
**Densities**
— Метрика: абсолютная прокси-дельты или чистый объем.
— Окно/квантиль, глубина × Average True Range, продление,
— Порог объединения (в Average True Range),
— Условие «разъедания» по объему,
— Средняя линия плотности (по желанию).
---
## Советы и риски
* Индикатор **не использует внешние потоки ордер-флоу**. Дельта — **прокси**, подходящая для TradingView; подбирайте квантили под инструмент и таймфрейм.
* Не торгуйте каждый пузырь. Склейте **контекст (тренд + VWAP + Opening Range)** с **уровнем (зона)** и **усилием (пузырь/плотность)**.
* Стоп-лосс — за границей зоны или по Average True Range. Риск на сделку задавайте заранее.
* Перед реальными деньгами протестируйте правила в стратегии.
* Разные рынки ведут себя по-разному; настройки из Биткоина могут не подойти малоликвидным альткоинам или акциям.
* Это не инвестиционная рекомендация. Скальпинг — высокий риск; проскальзывание и переизбыток сделок быстро наносят ущерб капиталу.
---
## Чем уникален PRO Scalper
* Две **одновременные** системы зон показывают и **крупную структуру**, и **точные локальные уровни**.
* Режим **«только по тренду»** чистит экран от лишних уровней и ускоряет решение.
* **Счетчики касаний** дают количественную опору.
* **Самодостаточные визуализации усилия** (пузыри и плотности) — без сторонних источников данных.
* Аккуратная цветовая схема: плотности — мягко, зоны — ясно; Opening Range — адаптивный.
Пусть он станет вашей «картой местности» для быстрых и дисциплинированных решений внутри дня.
Hacim

Trend Profit Tracking——JackFinanceTrend Profit Tracking Indicator Usage Guide1. Chart Interpretation and UsageSignals: Green "Buy" (below bar) for long entry; red "Sell" (above bar) for short entry or close long. Based on ATR stop reversal.
Trend Line: Green = bullish (support); red = bearish (resistance); gray = neutral.
Background: Light green/red = trend environment.
Filter Band: Green fill confirms bullish; red confirms bearish. Signals more accurate when price is inside the band.
Volume: Yellow bars = unusual volume spike; combine with signals for reversal hints.
Table (top-right): Bullish; Bearish; Neutral.
2. Trading ApplicationEntry: Signal + matching filter band color (green for long, red for short).
Exit: Reverse signal or price hits trend line/band edge.
Stop-Loss: Use built-in trailing stop; ATR multiplier for position sizing.
Best For: Daily/4H trend charts; avoid choppy markets.
Backtest: Verify in strategy tester (~55-65% win rate with defaults).
3. TipsCombine with RSI for filters.
Trading involves risk; decide at your own discretion.

ZS Game Changer Pump & Dump DetectorZS GAME CHANGER PUMP AND DUMP DETECTOR - TOP 2 MOMENTUM TRACKER
Created by Zakaria Safri
An intelligent indicator specifically designed to identify and highlight the two most significant pump and dump candles within your selected lookback period. Perfect for traders who want to focus on the game-changing moves that truly matter in volatile markets like cryptocurrency, stocks, and forex.
CORE FEATURES
AUTOMATIC GAME CHANGER DETECTION
The indicator continuously scans your specified lookback period and automatically identifies the top 2 strongest pump candles and top 2 strongest dump candles. These game-changing candles are highlighted with distinctive gold labels and horizontal reference lines, making them instantly visible on your chart. Unlike other indicators that show every small move, this focuses exclusively on the market-moving moments that define trends and create opportunities.
INTELLIGENT PUMP AND DUMP CLASSIFICATION
Uses advanced percentage-based calculations to classify candles as pumps when price surges significantly upward and dumps when price plunges sharply downward. The detection system accounts for candle body size, wick proportions, and volume confirmation to ensure only legitimate momentum moves trigger signals. Customizable thresholds allow adaptation to any market volatility profile from calm stocks to wild altcoins.
ADVANCED WICK EXCLUSION FILTER
Eliminates false signals caused by candles with large wicks and small bodies. This filter focuses analysis exclusively on candles with substantial body sizes that indicate genuine directional conviction rather than temporary spikes followed by rejection. The body to candle ratio is fully adjustable to match your preferred signal quality standards.
VOLUME CONFIRMATION SYSTEM
Optional volume filter ensures detected pumps and dumps are backed by real market participation. The indicator compares current volume against a moving average and only triggers signals when volume exceeds your specified multiplier threshold. This eliminates low-volume noise and focuses on moves supported by institutional or crowd participation.
RALLY SEQUENCE DETECTION
Identifies and highlights consecutive sequences of pump or dump candles with colored background overlays. Green background indicates sustained buying pressure across multiple candles while red background shows sustained selling pressure. The rally detection system includes an optional one-miss allowance that prevents the sequence from breaking due to a single neutral candle.
HORIZONTAL REFERENCE LINES
Draws dashed lines from each game changer candle extending to the current bar, providing constant visual reference to the most significant support and resistance levels created by extreme momentum. The top game changer gets a thick dashed line while the second gets a dotted line for easy differentiation. Labels on the right side display the exact percentage move.
COMPREHENSIVE STATISTICS DASHBOARD
Real-time information panel showing current market status as pumping, dumping, or neutral along with the current candle percentage change. Displays the exact percentage values for top pump number 1, top pump number 2, top dump number 1, and top dump number 2. Shows running totals of all pumps and dumps detected since chart load. Tracks consecutive candle counts during active rally sequences.
TESTING AND VERIFICATION MODE
Built-in debug mode displays percentage change directly on each qualifying pump and dump candle, allowing instant verification that calculations are accurate. Shows which filters are currently active with a simple code in the dashboard. Helps traders understand exactly why certain candles qualified as game changers.
HOW THE GAME CHANGER DETECTION WORKS
SCANNING ALGORITHM
Every bar close, the indicator scans backward through your specified lookback period examining every candle's percentage change from its previous close. For bullish moves, it identifies the two candles with the largest positive percentage change that meet your threshold requirements. For bearish moves, it identifies the two candles with the largest negative percentage change meeting threshold requirements.
RANKING SYSTEM
Candles are ranked purely by their percentage move magnitude. The number 1 game changer is always the single strongest move in the lookback period. The number 2 game changer is the second strongest move. Rankings update dynamically as new candles form and old candles exit the lookback window.
VISUAL IDENTIFICATION
Game changer number 1 for both pumps and dumps receives a large gold label reading GAME CHANGER NUMBER 1 with zero transparency for maximum visibility. Game changer number 2 receives a slightly smaller gold label with partial transparency. The candle bars themselves are colored in gold instead of the standard green or red. Horizontal lines extend from the game changer price level to current bar.
FILTER APPLICATION
Only candles that pass your configured filters qualify for game changer consideration. If wick exclusion is enabled, candles with large wicks and small bodies are ignored. If volume confirmation is enabled, only candles with above-average volume qualify. This ensures game changers represent legitimate market moves rather than aberrations.
PRACTICAL APPLICATIONS
FOR CRYPTOCURRENCY TRADERS
Crypto markets experience extreme volatility with occasional massive pump and dump candles that define entire trends. This indicator instantly identifies which candles represent true market structure shifts versus normal noise. Use the game changer levels as key support and resistance for entries, exits, and stop placement. The top pump often marks the local high to watch for breakouts while the top dump marks the local low for reversal trades.
FOR DAY TRADERS
Intraday charts contain hundreds of candles but only a few truly matter for the session outcome. Game changer detection filters out 98 percent of candles to show you the 2 percent that drove the actual price movement. Enter trades on the side of the strongest recent game changer. Use game changer levels as magnet prices where algorithmic trading often returns.
FOR SWING TRADERS
On daily and four-hour timeframes, game changers represent major institutional activity or news-driven moves. The top dump often marks capitulation selling that creates reversal opportunities. The top pump often marks FOMO buying that creates resistance levels. Swing traders can build positions knowing these levels will be defended or tested multiple times.
FOR VOLATILITY ANALYSIS
Understanding which candles created the most volatility helps assess market risk. Multiple game changers clustered together indicate unstable choppy conditions. Game changers separated by many neutral candles indicate trending stable conditions. Use this context to adjust position sizing and stop distances appropriately.
FOR SUPPORT AND RESISTANCE TRADING
Game changer candles create the strongest support and resistance levels because they represent prices where massive volume transacted in short time periods. These levels have higher probability of holding on retest compared to arbitrary moving averages or pivot points. Trade bounces off game changer levels or breakouts through them.
RECOMMENDED SETTINGS BY MARKET
CRYPTOCURRENCY 15-MINUTE TO 1-HOUR CHARTS
Candle Size Threshold: 2.0 percent
Body to Candle Ratio: 0.5
Volume Multiplier: 1.5 times average
Game Changer Lookback: 100 bars
Extreme Threshold: 3.5 percent
Enable Wick Filter: Yes
Enable Volume Confirmation: Yes
Minimum Rally Candles: 3
STOCKS DAILY CHARTS
Candle Size Threshold: 1.0 percent
Body to Candle Ratio: 0.6
Volume Multiplier: 2.0 times average
Game Changer Lookback: 50 bars
Extreme Threshold: 2.5 percent
Enable Wick Filter: Yes
Enable Volume Confirmation: Yes
Minimum Rally Candles: 2
FOREX 1-HOUR TO 4-HOUR CHARTS
Candle Size Threshold: 0.5 percent
Body to Candle Ratio: 0.5
Volume Multiplier: Not applicable
Game Changer Lookback: 80 bars
Extreme Threshold: 1.0 percent
Enable Wick Filter: Yes
Enable Volume Confirmation: No
Minimum Rally Candles: 3
SCALPING 1-MINUTE TO 5-MINUTE CHARTS
Candle Size Threshold: 0.8 percent
Body to Candle Ratio: 0.4
Volume Multiplier: 1.2 times average
Game Changer Lookback: 50 bars
Extreme Threshold: 1.5 percent
Enable Wick Filter: No
Enable Volume Confirmation: Yes
Minimum Rally Candles: 2
WHAT IS INCLUDED
Automatic identification of top 2 pump candles
Automatic identification of top 2 dump candles
Gold colored game changer labels with size differentiation
Gold colored candle bars for game changers
Horizontal reference lines from game changers to current price
Regular pump and dump detection with green and red candles
Rally sequence detection with background highlighting
Extreme move detection and labeling system
Real-time statistics dashboard with all key metrics
Percentage change debug mode for verification
Volume confirmation filter with adjustable multiplier
Wick exclusion filter with adjustable body ratio
Customizable lookback period from 20 to 500 bars
Consecutive candle counter for rally tracking
Alert system for game changers, pumps, dumps, and rallies
Works on all timeframes from 1 minute to monthly
Compatible with stocks, forex, cryptocurrency, and futures
UNDERSTANDING GAME CHANGERS
WHAT MAKES A CANDLE A GAME CHANGER
A game changer is not just a large move but the largest move within context. In a volatile crypto market, a 5 percent pump might not rank in the top 2. In a stable stock, a 2 percent pump could be the number 1 game changer. The indicator adapts to your specific instrument and timeframe to find what truly matters in that context.
WHY FOCUS ON TOP 2 ONLY
Markets are driven by a small number of significant moves rather than the average of all moves. By focusing exclusively on the top 2 in each direction, traders can ignore noise and concentrate on the price levels that actually matter for support, resistance, and momentum. This creates clarity in decision making.
GAME CHANGERS AS MARKET STRUCTURE
The top pump often marks the recent high that bulls must break to continue uptrend. The top dump often marks the recent low that bears must break to continue downtrend. These become the key levels around which all other price action rotates. Understanding this structure is essential for profitable trading.
GAME CHANGERS AS SENTIMENT INDICATORS
Consecutive pump game changers signal strong bullish sentiment and FOMO conditions. Consecutive dump game changers signal fear and capitulation. Alternating pump and dump game changers signal indecision and range conditions. Read the pattern of game changers to gauge market psychology.
VERIFICATION AND TESTING
HOW TO VERIFY ACCURACY
Enable Show Debug Info on Chart in the Testing and Debug settings group. This displays the percentage change calculation directly on every qualifying pump and dump candle. Manually verify by calculating open minus close divided by close multiplied by 100. The debug percentage should match your manual calculation exactly.
HOW TO TEST FILTERS
Toggle wick exclusion filter on and off while watching how many candles qualify. With filter on, candles with long wicks and small bodies should disappear. Toggle volume confirmation on and off to see how low-volume candles get excluded. Adjust the thresholds and watch the real-time impact on signal count.
HOW TO VERIFY GAME CHANGERS
Look at your chart and visually identify which candle had the biggest green body in the lookback period. The game changer number 1 pump label should be on that exact candle. Repeat for the biggest red candle to verify game changer number 1 dump. The rankings should match your visual assessment.
LOOKBACK PERIOD EFFECTS
Decrease the lookback period to 20 bars and watch game changers update to only recent moves. Increase to 500 bars and watch game changers potentially change to older historic moves. The optimal lookback balances recency with significance. Too short misses important levels, too long includes irrelevant history.
DASHBOARD INFORMATION GUIDE
STATUS ROW
Shows PUMPING when current candle qualifies as a pump, DUMPING when current candle qualifies as a dump, or NEUTRAL when current candle does not meet threshold requirements. This updates in real-time on every bar close.
CURRENT CHANGE ROW
Displays the percentage change of the current candle from its previous close. Positive percentages indicate bullish candle, negative indicate bearish candle. This number may or may not meet your threshold to qualify as pump or dump.
TOP PUMP NUMBER 1
The highest positive percentage change found in your lookback period. This candle is marked with the large gold GAME CHANGER NUMBER 1 label below it. Shows N/A if no pumps exist in the lookback period.
TOP PUMP NUMBER 2
The second highest positive percentage change found in your lookback period. Marked with smaller gold GAME CHANGER NUMBER 2 label. Shows N/A if only one or zero pumps exist.
TOP DUMP NUMBER 1
The highest negative percentage change magnitude found in your lookback period. This candle is marked with the large gold GAME CHANGER NUMBER 1 label above it. Shows N/A if no dumps exist.
TOP DUMP NUMBER 2
The second highest negative percentage change magnitude found in your lookback period. Marked with smaller gold GAME CHANGER NUMBER 2 label. Shows N/A if only one or zero dumps exist.
TOTAL PUMPS
Running count of all pump candles detected since you loaded the indicator on this chart. This number continuously increases as new qualifying pumps form. Resets when you reload the chart.
TOTAL DUMPS
Running count of all dump candles detected since chart load. Increases as new qualifying dumps form and resets on chart reload.
CONSECUTIVE
Shows the current count of consecutive pump or dump candles during an active rally. Displays 3 UP during a 3-candle pump rally or 5 DN during a 5-candle dump rally. Shows 0 when no rally is active.
ALERT SYSTEM
GAME CHANGER DETECTED ALERT
Triggers whenever the current candle becomes one of the top 2 pumps or top 2 dumps. This is the highest priority alert indicating a market-moving event just occurred. Use this alert for immediate notification of significant opportunities.
PUMP DETECTED ALERT
Triggers on every candle that qualifies as a pump according to your threshold and filter settings. This includes regular pumps and extreme pumps but excludes game changers which have their separate alert. Use for general upward momentum monitoring.
DUMP DETECTED ALERT
Triggers on every candle that qualifies as a dump according to your settings. Includes regular and extreme dumps but excludes game changers. Use for general downward momentum monitoring.
PUMP RALLY STARTED ALERT
Triggers when consecutive pump candles reach your minimum rally threshold. Indicates the beginning of a sustained upward movement sequence. Use to catch trends early.
DUMP RALLY STARTED ALERT
Triggers when consecutive dump candles reach your minimum rally threshold. Indicates the beginning of a sustained downward movement sequence. Use for trend following or reversal timing.
ALERT MESSAGE FORMAT
All alerts include the ticker symbol and current price using TradingView placeholders. Messages are descriptive and specify which type of signal triggered. Alerts work with TradingView notification system including email, SMS, webhook, and app notifications.
TECHNICAL SPECIFICATIONS
CALCULATION METHODOLOGY
Percentage change calculated as current close minus previous close divided by previous close multiplied by 100. Body ratio calculated as absolute value of close minus open divided by high minus low. Volume elevation calculated as current volume divided by 20-period simple moving average of volume. Game changer ranking uses absolute value comparison across entire lookback array.
PERFORMANCE CHARACTERISTICS
Lightweight calculations optimized for speed on all timeframes. No repainting of signals ensuring all triggers are final on bar close. Variables properly scoped with var keyword for memory efficiency. Maximum bars back set to 500 to prevent excessive historical loading. Updates in real-time on every bar close without lag.
COMPATIBILITY
Works on all TradingView plans including free, pro, and premium. Compatible with stocks, forex, cryptocurrency, futures, indices, and commodities. Functions correctly on all timeframes from 1 second to monthly. No external data requests ensuring fast loading. Overlay true setting places directly on price chart.
RISK DISCLAIMER
This indicator is a technical analysis tool for identifying momentum and should not be used as the sole basis for trading decisions. Game changer levels can be broken during strong trends and are not guaranteed support or resistance. Pump and dump detection does not predict future price direction. Always use proper risk management with stop losses on every trade. Combine this indicator with other forms of analysis including fundamentals, market context, and risk assessment. Practice on demo accounts before live trading. Past performance of game changer signals does not guarantee future results. Trading carries substantial risk of loss and is not suitable for all investors. The creator is not responsible for trading losses incurred while using this tool.
SUPPORT AND UPDATES
Regular updates based on user feedback and market evolution. Built following PineCoders industry standards and best practices for code quality. Clean well-documented code structure for transparency and auditability. Optimized performance across all timeframes and instruments. Active development with continuous improvements and feature additions.
WHY CHOOSE ZS GAME CHANGER PUMP AND DUMP DETECTOR
Focuses on what matters by highlighting only the top 2 moves in each direction instead of cluttering your chart with every small fluctuation. Saves time by automatically identifying the most significant candles rather than requiring manual scanning. Provides clarity through visual gold labels and reference lines that make game changers unmistakable. Adapts to any market with customizable thresholds for volatility and volume. Eliminates noise with advanced wick and volume filters ensuring signal quality. Offers verification through debug mode proving calculations are accurate and trustworthy. Includes comprehensive statistics showing exact percentages and counts. Works everywhere across all markets, timeframes, and instruments without modification.
Transform your chart analysis by focusing exclusively on the game-changing moments that define trends and create opportunities.
Version 1.1 | Created by Zakaria Safri | Pine Script Version 5 | PineCoders Compliant

Trader Jumblo Apex Pro Signal — Confirmed The Trader Jumblo Apex Signal Pro indicator is a precision-based market reversal tool designed to identify potential turning points in price with a strong confirmation logic.
Unlike standard momentum or crossover systems, this tool focuses on confirmed reaction zones, allowing traders to anticipate high-probability shifts in market direction.
Built with adaptive multi-filter logic and confirmation weighting, it minimizes false signals and only triggers entries under specific structural conditions.
The indicator integrates dynamic volatility levels for automatic stop-loss and take-profit projection using a fixed risk-reward calibration (2:4), maintaining consistency and discipline in trade management.
Key Features:
• Smart confirmation logic for precision entries
• Adaptive 2:4 risk-reward framework
• Automatic SL/TP projection
• Candle-confirmation filtering for stronger setups
• Fully compatible with alerts (BUY, SELL, TP, SL)
Best used on: 1-5 minute or 15-minute charts for short-term confirmation trading.
⚠️ Note: This tool is optimized for traders who prioritize precision entries over frequent signals. Each signal represents a confirmed market reaction — not a predictive guess.
A precision reversal confirmation system designed to catch high-probability turning points with strict entry logic and fixed 2:4 risk-reward control.

Volume Profile - Previous Day Levels The green lines and area represent previous day Value Area. The values are not completely identical to Trading View default levels because of difference in calculation.
The white lines represent the min-max prices during the initial balance (9:30 to 10:30 EST). The diagnoal lines cannot be removed unfortunately.
You can also see same day evolving Valuea area and POC for momentum analysis.

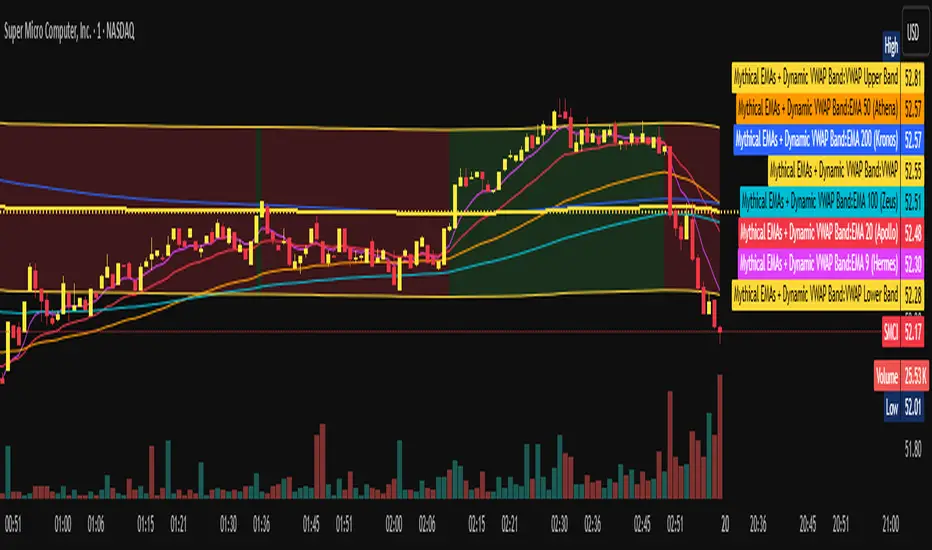
Mythical EMAs + Dynamic VWAP BandThis indicator titled "Mythical EMAs + Dynamic VWAP Band." It overlays several volatility-adjusted Exponential Moving Averages (EMAs) on the chart, along with a Volume Weighted Average Price (VWAP) line and a dynamic band around it.
Additionally, it uses background coloring (clouds) to visualize bullish or bearish trends, with intensity modulated by the price's position relative to the VWAP.
The EMAs are themed with mythical names (e.g., Hermes for the 9-period EMA), but this is just stylistic flavoring and doesn't affect functionality.
I'll break it down section by section, explaining what each part does, how it works, and its purpose in the context of technical analysis. This indicator is designed for traders to identify trends, momentum, and price fairness relative to volume-weighted averages, with volatility adjustments to make the EMAs more responsive in volatile markets.
### 1. **Volatility Calculation (ATR)**
```pine
atrLength = 14
volatility = ta.atr(atrLength)
```
- **What it does**: Calculates the Average True Range (ATR) over 14 periods (a common default). ATR measures market volatility by averaging the true range (the greatest of: high-low, |high-previous close|, |low-previous close|).
- **Purpose**: This volatility value is used later to dynamically adjust the EMAs, making them more sensitive in high-volatility conditions (e.g., during market swings) and smoother in low-volatility periods. It helps the indicator adapt to changing market environments rather than using static EMAs.
### 2. **Custom Mythical EMA Function**
```pine
mythical_ema(src, length, base_alpha, vol_factor) =>
alpha = (2 / (length + 1)) * base_alpha * (1 + vol_factor * (volatility / src))
ema = 0.0
ema := na(ema ) ? src : alpha * src + (1 - alpha) * ema
ema
```
- **What it does**: Defines a custom function to compute a modified EMA.
- It starts with the standard EMA smoothing factor formula: `2 / (length + 1)`.
- Multiplies it by a `base_alpha` (a user-defined multiplier to tweak responsiveness).
- Adjusts further for volatility: Adds a term `(1 + vol_factor * (volatility / src))`, where `vol_factor` scales the impact, and `volatility / src` normalizes ATR relative to the source price (making it scale-invariant).
- The EMA is then calculated recursively: If the previous EMA is NA (e.g., at the start), it uses the current source value; otherwise, it weights the current source by `alpha` and the prior EMA by `(1 - alpha)`.
- **Purpose**: This creates "adaptive" EMAs that react faster in volatile markets (higher alpha when volatility is high relative to price) without overreacting in calm periods. It's an enhancement over standard EMAs, which use fixed alphas and can lag in choppy conditions. The mythical theme is just naming—functionally, it's a volatility-weighted EMA.
### 3. **Calculating the EMAs**
```pine
ema9 = mythical_ema(close, 9, 1.2, 0.5) // Hermes - quick & nimble
ema20 = mythical_ema(close, 20, 1.0, 0.3) // Apollo - short-term foresight
ema50 = mythical_ema(close, 50, 0.9, 0.2) // Athena - wise strategist
ema100 = mythical_ema(close, 100, 0.8, 0.1) // Zeus - powerful oversight
ema200 = mythical_ema(close, 200, 0.7, 0.05) // Kronos - long-term patience
```
- **What it does**: Applies the custom EMA function to the close price with varying lengths (9, 20, 50, 100, 200 periods), base alphas (decreasing from 1.2 to 0.7 for longer periods to make shorter ones more responsive), and volatility factors (decreasing from 0.5 to 0.05 to reduce volatility influence on longer-term EMAs).
- **Purpose**: These form a multi-timeframe EMA ribbon:
- Shorter EMAs (e.g., 9 and 20) capture short-term momentum.
- Longer ones (e.g., 200) show long-term trends.
- Crossovers (e.g., short EMA crossing above long EMA) can signal buy/sell opportunities. The volatility adjustment makes them "mythical" by adding dynamism, potentially improving signal quality in real markets.
### 4. **VWAP Calculation**
```pine
vwap_val = ta.vwap(close) // VWAP based on close price
```
- **What it does**: Computes the Volume Weighted Average Price (VWAP) using the built-in `ta.vwap` function, anchored to the close price. VWAP is the average price weighted by volume over the session (resets daily by default in Pine Script).
- **Purpose**: VWAP acts as a benchmark for "fair value." Prices above VWAP suggest bullishness (buyers in control), below indicate bearishness (sellers dominant). It's commonly used by institutional traders to assess entry/exit points.
### 5. **Plotting EMAs and VWAP**
```pine
plot(ema9, color=color.fuchsia, title='EMA 9 (Hermes)')
plot(ema20, color=color.red, title='EMA 20 (Apollo)')
plot(ema50, color=color.orange, title='EMA 50 (Athena)')
plot(ema100, color=color.aqua, title='EMA 100 (Zeus)')
plot(ema200, color=color.blue, title='EMA 200 (Kronos)')
plot(vwap_val, color=color.yellow, linewidth=2, title='VWAP')
```
- **What it does**: Overlays the EMAs and VWAP on the chart with distinct colors and titles for easy identification in TradingView's legend.
- **Purpose**: Visualizes the EMA ribbon and VWAP line. Traders can watch for EMA alignments (e.g., all sloping up for uptrend) or price interactions with VWAP.
### 6. **Dynamic VWAP Band**
```pine
band_pct = 0.005
vwap_upper = vwap_val * (1 + band_pct)
vwap_lower = vwap_val * (1 - band_pct)
p1 = plot(vwap_upper, color=color.new(color.yellow, 0), title="VWAP Upper Band")
p2 = plot(vwap_lower, color=color.new(color.yellow, 0), title="VWAP Lower Band")
fill_color = close >= vwap_val ? color.new(color.green, 80) : color.new(color.red, 80)
fill(p1, p2, color=fill_color, title="Dynamic VWAP Band")
```
- **What it does**: Creates a band ±0.5% around the VWAP.
- Plots the upper/lower bands with full transparency (color opacity 0, so lines are invisible).
- Fills the area between them dynamically: Semi-transparent green (opacity 80) if close ≥ VWAP (bullish bias), red if below (bearish bias).
- **Purpose**: Highlights deviations from VWAP visually. The color change provides an at-a-glance sentiment indicator—green for "above fair value" (potential strength), red for "below" (potential weakness). The narrow band (0.5%) focuses on short-term fairness, and the fill makes it easier to spot than just the line.
### 7. **Trend Clouds with VWAP Interaction**
```pine
bullish = ema9 > ema20 and ema20 > ema50
bearish = ema9 < ema20 and ema20 < ema50
bullish_above_vwap = bullish and close > vwap_val
bullish_below_vwap = bullish and close <= vwap_val
bearish_below_vwap = bearish and close < vwap_val
bearish_above_vwap = bearish and close >= vwap_val
bgcolor(bullish_above_vwap ? color.new(color.green, 50) : na, title="Bullish Above VWAP")
bgcolor(bullish_below_vwap ? color.new(color.green, 80) : na, title="Bullish Below VWAP")
bgcolor(bearish_below_vwap ? color.new(color.red, 50) : na, title="Bearish Below VWAP")
bgcolor(bearish_above_vwap ? color.new(color.red, 80) : na, title="Bearish Above VWAP")
```
- **What it does**: Defines trend conditions based on EMA alignments:
- Bullish: Shorter EMAs stacked above longer ones (9 > 20 > 50, indicating upward momentum).
- Bearish: The opposite (downward momentum).
- Sub-conditions combine with VWAP: E.g., bullish_above_vwap is true only if bullish and price > VWAP.
- Applies background colors (bgcolor) to the entire chart pane:
- Strong bullish (above VWAP): Green with opacity 50 (less transparent, more intense).
- Weak bullish (below VWAP): Green with opacity 80 (more transparent, less intense).
- Strong bearish (below VWAP): Red with opacity 50.
- Weak bearish (above VWAP): Red with opacity 80.
- If no condition matches, no color (na).
- **Purpose**: Creates "clouds" for trend visualization, enhanced by VWAP context. This helps traders confirm trends—e.g., a strong bullish cloud (darker green) suggests a high-conviction uptrend when price is above VWAP. The varying opacity differentiates signal strength: Darker for aligned conditions (trend + VWAP agreement), lighter for misaligned (potential weakening or reversal).
### Overall Indicator Usage and Limitations
- **How to use it**: Add this to a TradingView chart (e.g., stocks, crypto, forex). Look for EMA crossovers, price bouncing off EMAs/VWAP, or cloud color changes as signals. Bullish clouds with price above VWAP might signal buys; bearish below for sells.
- **Strengths**: Combines momentum (EMAs), volume (VWAP), and volatility adaptation for a multi-layered view. Dynamic colors make it intuitive.
- **Limitations**:
- EMAs lag in ranging markets; volatility adjustment helps but doesn't eliminate whipsaws.
- VWAP resets daily (standard behavior), so it's best for intraday/session trading.
- No alerts or inputs for customization (e.g., changeable lengths)—it's hardcoded.
- Performance depends on the asset/timeframe; backtest before using.
- **License**: Mozilla Public License 2.0, so it's open-source and modifiable.
Triple Impulsive Candle Detector (with Midpoint Lines)Triple Impulsive Candle Detector (with Midpoint Lines)
This script expands upon the original Triple Impulsive Candle Detector by adding anchored midpoint lines that visually project potential reaction levels following impulsive candles. Impulsive candles are detected systematically using three configurable detectors based on candle range, volume, and body-to-wick ratio.
Each detected impulsive candle anchors a horizontal midpoint line (either body midpoint or full candle midpoint) that can extend for a fixed number of bars or dynamically until price revisits it, with user-defined controls for both behavior and visual styling.
Credit: Original impulse candle logic by GreatestUsername and published by ProfMichaelG.
(Impulsive-Candle-Detector-Prof-Michael-G)

VWAP Entry Assistant (v1.0)Description:
Anchored VWAP with a lightweight assistant for VWAP reversion trades.
It shows the distance to VWAP, an estimated hit probability for the current bar, the expected number of bars to reach VWAP, and a recommended entry price.
If the chance of touching VWAP is low, the script suggests an adjusted limit using a fraction of ATR.
The VWAP line is white by default, and a compact summary table appears at the bottom-left.
Educational tool. Not financial advice. Not affiliated with TradingView or any exchange. Always backtest before use.

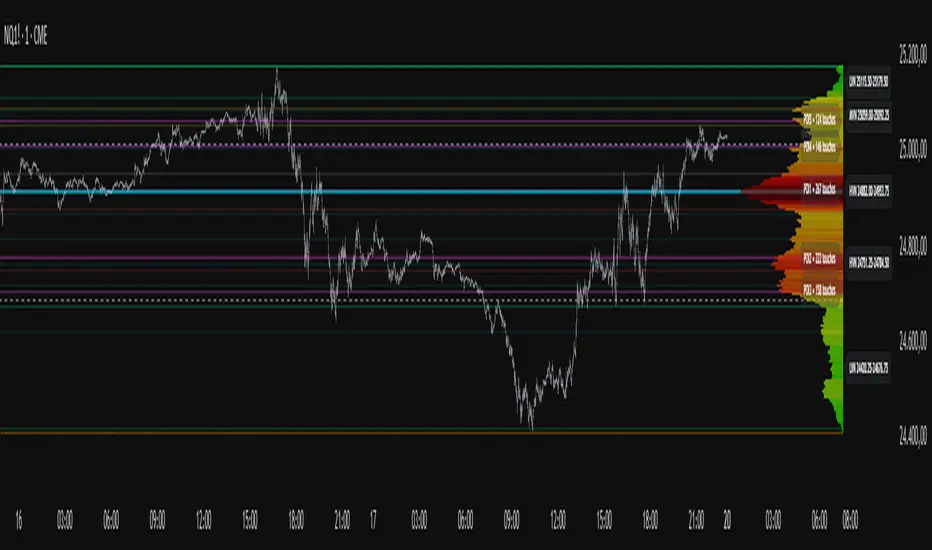
Volume Profile, Pivot Anchored by DGT - reviewedVolume Profile, Pivot Anchored by DGT - reviewed
This indicator, “Volume Profile, Pivot Anchored”, builds a volume profile between swing highs and lows (pivot points) to show where trading activity is concentrated.
It highlights:
Value Area (VAH / VAL) and Point of Control (POC)
Volume distribution by price level
Pivot-based labels showing price, % change, and volume
Optional colored candles based on volume strength relative to the average
Essentially, it visualizes how volume is distributed between market pivots to reveal key price zones and volume imbalances.

AI Money FlowAI Money Flow is a revolutionary trading indicator that combines cutting-edge artificial intelligence technologies with traditional Smart Money concepts. This indicator provides comprehensive market analysis with emphasis on signal accuracy and reliability.
Key Features:
Volume Profile with Smart Money Analysis - Displays real money flow instead of just volume, identifying key support and resistance levels based on actual trader activity.
Volatility-Based Support & Resistance - Intelligent support and resistance levels that dynamically adapt to market volatility in real-time for maximum accuracy.
Order Flow Analysis - Advanced detection of buying and selling pressure that reveals the true intentions of large market players.
Machine Learning Optimization - Futuristic AI technology that automatically learns and optimizes settings for each specific asset and timeframe.
Risk Management - Advanced volatility and price spike detection for better risk management and capital protection.
Real-time Dashboard - Modern dashboard with color-coded signals provides instant overview of market conditions and trends.
Accuracy: 88-93%

Bull vs Bear Volume(Simplified)Bull vs Bear Volume
After experimenting with countless volume-based indicators, I sought a simple way to visualize buying and selling pressure with just two lines—an indicator that stays closely coupled with price action.
I went through endless trial and error, building extremely complex volume indicators, only to find that in live trading, errors kept arising and the tools became more hindrance than help. Yet, to enhance the reliability of price indicators, a trustworthy volume measure is indispensable. Even after testing numerous community-shared indicators, I could not find one that met my needs.
This led me to a simple idea: process volume only when Close > Open for buying pressure, and Close < Open for selling pressure, while cleaning out the noise. By reflecting only the volume contributing to price movement, the indicator remains stable and intuitive.
Implementing this concept, I created an indicator that, among countless volume tools, stands out for its clarity and lack of extraneous functions. Users can freely adjust the sum periods of the Bull and Bear lines, choose line styles, and even enjoy the dynamic color changes when the lines cross.
If this indicator can provide even a little assistance in trading, then my purpose is fulfilled.

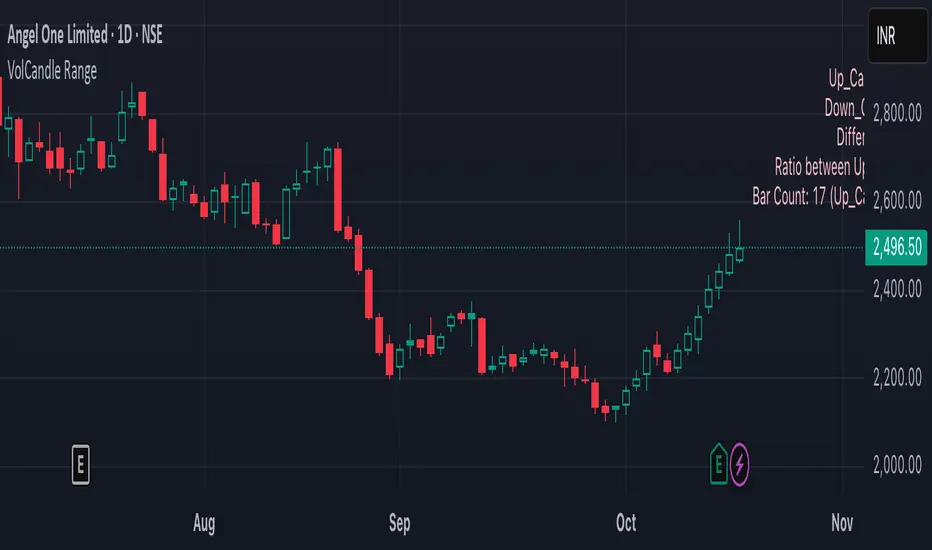
VolCandle_Start_End BarsThe “VolCandle_Start_End Bars” Pine Script is a custom TradingView indicator designed to calculate and display volume-based candle statistics between two user-defined time points. It visually summarizes trading activity across a specific date range by comparing up-candle and down-candle volumes.
Functionality
The script allows users to select a start and end bar (dates) using the input fields “Select starting Bar” and “Select ending Bar.” It then examines all candles within this range to calculate:
Total volume for up candles (candles where the close is higher than the previous candle).
Total volume for down candles (candles where the close is lower than the previous candle).
Difference and ratio between up and down volumes.
Count of up and down candles within the period.
Calculation Logic
A loop checks each bar's closing price and compares it with the previous one.
For every matching bar within the chosen time range:
If the close increases → its volume is added to up volume.
If the close decreases → its volume is added to down volume.
The process continues for up to 1000 historical bars, counting each bar type and accumulating total volumes.
Display and Labeling
The script calculates an appropriate label position using recent highs and lows, then dynamically creates a label on the chart showing:
Up_Candles volume
Down_Candles volume
Volume difference and ratio
Total bar count with up/down candle counts
The text is displayed in a soft pink tone using the label.new() function for visual clarity.
Utility
This indicator helps traders easily analyze buying vs. selling volume pressure across custom time intervals. It is particularly useful for comparing sentiment in specific trading phases (for example, before and after a consolidation or breakout).
All computations are done locally on the chart — the indicator does not place trades or alter candles.
In short, this script provides a compact visual and statistical summary of market volume distribution between rising and falling candles in a chosen date window, offering insight into the dominant market force during that time range.
Khusan Pullback & Mean-Reversion (Manual ADX, Clean)Description
The indicator combines two logics in one tool:
Trend Pullback: Entries in the direction of the dominant trend after a short-term pullback to the EMA.
Return to the mean (Mean-Reversal): countertrend trades from external Bollinger bands with an RSI filter.
Key Features
Manual ADX (Wilder calculation): more precisely, it controls the strength of the trend without hidden smoothing.
There is a clear separation of market modes: the background of the chart highlights the condition: trend up/down or sideways (range).
Signal tags: Long TPB / Short TPB for pullbacks in the trend, Long MR / Short MR for a return to the average.
A minimum of “noise": neat colors, clear captions, without unnecessary graphics.
How to read signals
Trend Pullback
Long TPB — ADX ≥ threshold, price returns above fast EMA, RSI > 45.
Short TPB — ADX ≥ threshold, price goes below fast EMA, RSI < 55.
Mean-Reversion
Long MR — sideways (ADX < threshold), price below lower BB, RSI < 30, confirmation of reversal.
Short MR — sideways (ADX < threshold), price above upper BB, RSI > 70, reversal confirmation.
Parameters (Inputs)
EMA fast / EMA slow — fast and slow EMA (default 20/50).
ADX length / threshold — period and trend strength threshold.
BB length / mult — period and Bollinger Bands multiplier.
RSI length — RSI period.
Show labels/background — enable mode signatures and highlighting.
Recommendations for use
Timeframes: from M15 to H4. On lower TF, add a filter by the higher trend (e.g. H1/H4 EMA).
Instruments: XAUUSD, FX majors, indices, liquid futures and crypto pairs.
Risk management: for TPB, use SL behind the local swing extremum/below the EMA zone; for MR, use SL behind the external BB.
Filters: avoid entering against strong news; prioritize MR when volatility is low, and TPB when volatility is high.
Alerts
Create standard alerts based on the appearance of Long/Short TPB and Long/Short MR labels — the indicator provides clear conditions for auto-entry/notifications.
Important
The indicator is not

Quadruple AlphaTrendKivancOzbilgi's 'Alpha Trend' indicator has been developed as 'Quadruple Alpha Trend'.
It has been extended to AlphaTrend1,2,3,4, and each line allows users to freely choose colors.
Each of the AT1 to 2 and AT3 to 4 was again color-transformed at the crossing point, respectively.
We believe that the value of AT can compensate a lot for all the shortcomings of a regular moving average.
It can show the support and resistance of the low and high points at each horizontal section and
pressed neck point at the same time
Draw a horizontal line type.
These advantages make it easy to visually break through and collapse support and resistance on the monthly, weekly, and daily charts
It makes it possible to distinguish. I think it's an excellent indicator design by Kivanc Ozbilgi.
The most similar indicator to this one is the "UT BOT", which is close to the moving average in terms of support and resistance
Because it gives a euphemism, the value of "Alpha Trend" as an index that includes horizontal support and resistance
Very highly appreciated. If you have any issues or need to develop further, please leave a note.
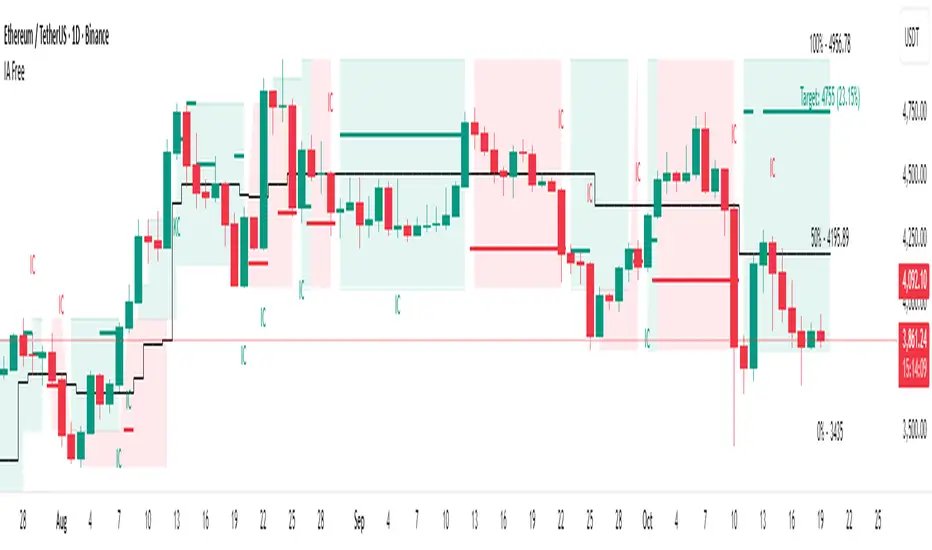
IA FreeInitiative Analysis (IA) is a concept of visual market analysis based on the idea that every price move is formed by the interaction of two forces — buyers and sellers.
The method structures price movements into a clear system of initiatives and reactions, helping you act with logic.
IA helps you see who is taking initiative, where the key levels and interest zones of both sides are, and where the balance of power may shift.
💡 How the method works
IA focuses on known price ranges — the areas where buyer or seller activity has previously appeared.
These ranges show the balance of power: this is where moves started, reactions happened, and initiative shifted.
Within these ranges, the method makes a forecast — identifying which side is now taking control (buyers or sellers) and calculating the target area for the potential move.
The goal of the method is to simplify analysis while keeping the full context, so traders and investors can see the logic behind market movement.
The method works for both short-term trading and long-term investing.
________________________________________
IA Free — Visualization of the Initiative Analysis Method
IA Free forecasts initiative on the market: which side — buyers or sellers — will take control, and calculates the target price for the potential move.
Each initiative has a beginning and an end — both in time and in price.
The indicator defines the upper and lower boundaries of the initiative, which serve as key contextual reference points for further analysis.
Forecasted initiatives are displayed on the chart and remain visible even if the move does not play out.
This allows you to:
• see when conditions for an initiative shift appeared;
• define possible correction levels.
________________________________________
Main Visualization Elements
• Buyer and seller initiative zones — show who is in control and define the upper and lower boundaries of each initiative on the chart.
• Target levels — projected direction of movement.
• Key candles (KC, IC) — candles with the highest volume inside an initiative.
KC — candle with the highest volume inside a trending initiative. Determined only after the initiative is formed and remains unchanged thereafter.
IC — candle with the highest volume inside a sideways initiative. It may change within the initiative: each new candle with higher volume inside the same initiative becomes the new IC.
• Internal range levels — the inner structure of an initiative (five adjustable user-defined levels).
You can customize the elements:
• show or hide initiative zones and targets;
• change line thickness and background transparency;
• select colors for dark or light chart themes.
________________________________________
Highlighted Settings (focus points)
• Include sideways markets in the analysis — includes ranges in initiative analysis (enabled by default).
• Sideways market activation point — the number of points after which the market is recognized as sideways (default: 4; values 6–7 filter out minor consolidations).
• Color parameters — allow you to adjust visuals for your style and chart theme.
________________________________________
Market Structure in IA
IA helps visualize three key phases of the market:
• Trend — one side dominates. On the chart, consecutive initiatives of the same color represent a continuation of the same side’s control.
• Range — balance of power; on the chart, initiatives alternate within a limited price range that may gradually expand.
• Transitional — shift of initiative and the start of a new move. On the chart within one time interval, there are two initiatives: the buyer’s initiative appears above, and the seller’s initiative appears below.
________________________________________
5 Steps for Working with IA Free
1. Identify the initiative — buyers or sellers: who controls the market and where the move is heading.
2. Check the higher timeframe context — make sure the higher timeframe doesn’t contradict the initiative on the lower one.
3. Confirm initiative strength — look for wide candles with volume, absorptions, and protection of initiative edges.
4. Define your entry trigger — retest, false breakout, KC/IC reaction, candle pattern, or your own system signal.
5. Manage risks — When trading with leverage, a stop-loss is mandatory! Define stop-loss placement according to your system (for example, beyond the initiative’s border), take profits near the target, and manage the trade following market structure.
________________________________________
Practice and Testing
Test your ideas on historical data: observe how initiatives and targets played out, how initiative edges were defended (candle patterns), and how price reacted when returning to KC/IC candles.
This helps you develop a clear understanding of market logic and confidence in decision-making.
________________________________________
Limitations
• Displays initiatives and targets only on the selected chart timeframe.
• Some IA method elements — such as internal buyer/seller zones or false breakout pattern recognition — are not implemented.
• Platform functions for alerts and data output (for custom algo strategies) are not supported.
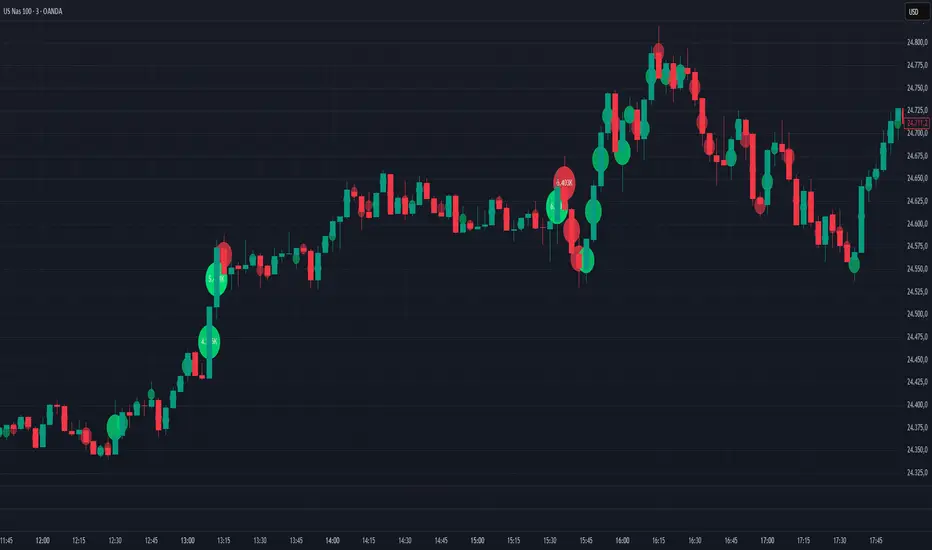
Volume Bubbles Delta Coloring Pro V1.0OVERVIEW
Bubbles Volume — Delta Pro extends the Classic concept with directional volume coloring and practical filters. It visualizes where volume concentrates inside each candle and which side (buyers or sellers) dominated. Ideal for intraday traders who want to see both intensity and direction of market activity.
HOW IT WORKS
Each bubble represents the candle’s volume normalized by volatility. Bubble size reflects relative volume; color reflects directional bias:
• Green = Buyer dominance (close > open)
• Red = Seller dominance (close < open)
• Yellow = Neutral (balanced candle)
A built-in delta proxy ((close – open) / range × volume) estimates directional strength — not true bid/ask delta, but a reliable approximation for chart volume.
FEATURES
• Delta coloring with adjustable Buy/Sell/Neutral colors
• Volume and delta thresholds to filter weak signals
• Session filter (e.g., 09:30–16:00) and lookback limit for speed
• Bubble position modes: HL2, Close, Body Mid, or High/Low by Delta
• Optional labels/lines for extreme volume
• Alerts for high-volume or strong delta spikes
USE CASES
Identify areas where aggressive buyers or sellers appeared, confirm breakouts with volume direction, or filter noise during low-activity periods. Combine with structure or VWAP for context.
NOTES
• Uses candle-based approximation, not orderflow.
• Visualization tool only; not a standalone signal.
• Original concept by BigBeluga, enhanced with delta logic and performance filters.
Licensed under CC BY-NC-SA 4.0.
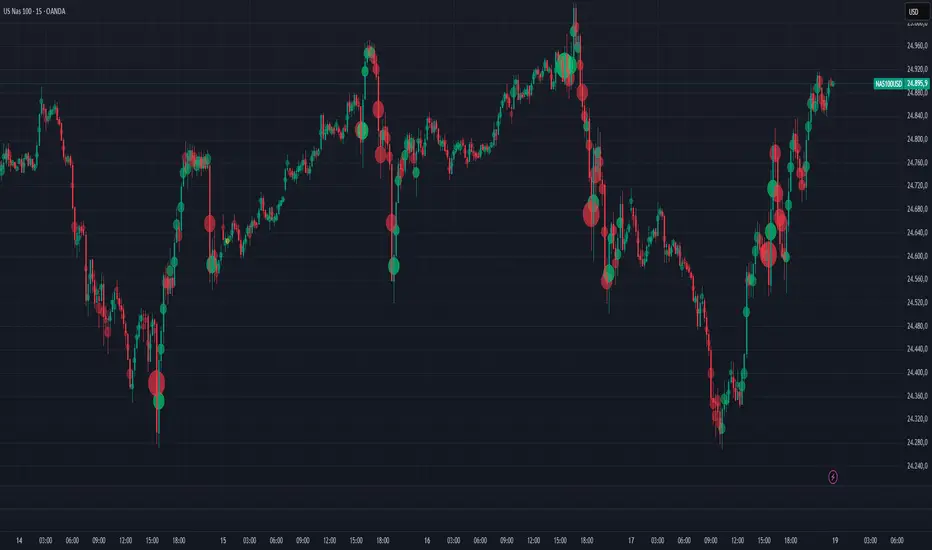
Volume Bubbles Delta Coloring Classic V1.0OVERVIEW
Bubbles Volume — Classic plots volume bubbles directly on the price chart. Bubble size scales with normalized volume, helping to visualize where trading activity concentrates. Optional heatmap coloring and significant-volume levels are included.
HOW IT WORKS
• Normalizes volume by its standard deviation to highlight unusually high participation.
• Draws circles ("bubbles") whose size corresponds to the normalized volume.
• Optional heatmap gradient emphasizes different volume regimes.
• Optional significant levels display labels or horizontal lines at the highest-volume bars.
INPUTS
• Bubbles / Threshold — Enable bubbles and set volume sensitivity.
• HeatMap — Enable gradient coloring by volume intensity.
• Significant Levels — Display labels or lines for the strongest volume bars.
• Levels Qty — Limit the number of labels or lines to display.
USE CASES
• Identify bars with unusually high trading activity.
• Spot reaction zones where large participants may have acted.
• Complement to price structure and trend analysis.
NOTES
• Uses chart volume only — not bid/ask orderflow.
• Visualization and educational tool, not a signal generator.
• Reduce visible bars if performance slows down.
CREDITS
Original concept by BigBeluga. Published under CC BY-NC-SA 4.0 license.
This is the unmodified, reference version.
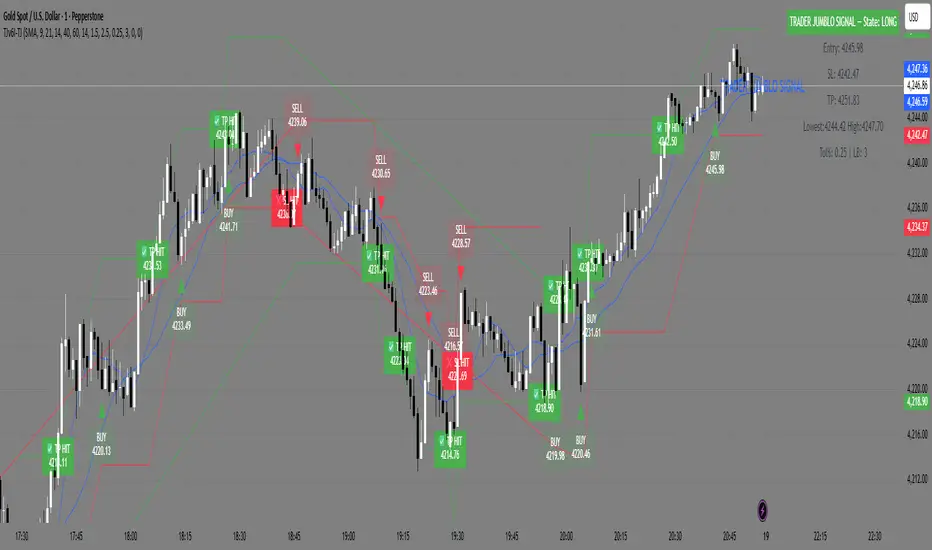
TRADER JUMBLO SIGNAL — Dip & Rally System“Buy from the roots, sell from the peaks.”
A precision-built smart trading system that detects market dips and rallies — allowing you to catch reversals right from the turning points, not halfway through the move.
🧠 How It Works (Concept Overview — no code)
The TRADER JUMBLO SIGNAL system combines trend-following and reversal-detection logic into one tool.
It analyses the last few bars (adjustable Lookback Period) to identify local extremes — the “roots” and “peaks” — and confirms entries using price structure and moving averages.
When conditions align:
-🟢 BUY Signal: Detected near the local lowest low within the lookback period during an uptrend.
-🔴 SELL Signal: Detected near the highest high during a downtrend.
-Each trade automatically sets a dynamic Stop Loss and Take Profit using the ATR (volatility-based).
-Intrabar or close-confirmed entries can be toggled for aggressive or conservative trading styles.
This system ensures you don’t chase candles — instead, it times entries at the core reversal points of the market structure.
⚙️ Key Features
-Dip & Rally Detection: Finds local highs/lows (roots and peaks) within an adjustable lookback window.
-Trend Filter: Only trades in the direction of the dominant moving-average trend.
-Intrabar Mode: Option to allow real-time entries before the candle closes.
-RSI Filter (optional): Filters out weak or overbought/oversold setups.
- ATR-based SL & TP: Automatic volatility-adjusted Stop Loss and Take Profit.
- Smart Table Display: Real-time info panel showing Entry, SL, TP, Lowest, Highest, Tolerance %, and Lookback bars.
-Customizable UI: Enable/disable labels, markers, and SL/TP lines.
Built-in Alerts:
✅ Buy (Dip) Trigger
❌ Sell (Rally) Trigger
🎯 TP Hit
🛑 SL Hit
📊 What Makes It Unique
Unlike basic crossover or RSI systems, this indicator focuses on price reaction around extremes — meaning you enter where reversals start, not after they’ve already moved.
It helps prevent:
Late entries after momentum is gone
Buying tops / selling bottoms
Random entries without market structure context
Instead, you’ll see:
Clean entries from the “roots” (local dips)
Exits or reversals from the “peaks” (local rallies)
Visual feedback for SL/TP hits — so you learn from each setup instantly.
📈 Visuals
🟢 Green markers = BUY entries near local lows.
🔴 Red markers = SELL entries near local highs.
✅ “TP Hit” or ❌ “SL Hit” labels appear on price touch.
🟦 Floating table on chart shows live trade info and state (LONG / SHORT / FLAT).
Project Pegasus SideMap • VRP Heatmap • Volume Node DetectionDescription CME_MINI:NQ1!
Project Pegasus – Volume SideMap V 1.0 builds a right-anchored horizontal volume heatmap silhouette, visualizing buy/sell participation per price level over any chosen lookback or visible range. It automatically detects Low-Volume Nodes (LVN), Medium-Volume Nodes (MVN), and High-Volume Nodes (HVN), while also marking Top Volume Peaks, POI Lines (Most-Touched Levels), and complete Value Area Levels (POC / VAH / VAL) including optional session highs/lows.
What’s Unique
Right-Fixed Rendering – All profile rows are anchored to the chart’s right edge, creating a consistent visual reference during live trading.
Gap-Free Silhouette – Each price row blends seamlessly with its neighbors, producing a clean and continuous volume shape.
Triple-Tier Node Detection (LVN / MVN / HVN) – Automatically highlights zones of rejection, transition, and acceptance based on relative volume strength.
Dynamic Binning System – Adapts to price range and lookback while preserving proportional per-row volume distribution.
POI Finder (Most Touches) – Highlights price rows that have been touched most frequently by bars (traffic clusters).
Top-N Peaks – Sorts and draws the strongest single-price clusters by total volume while respecting minimum spacing.
Integrated Value Area Metrics – Calculates and plots POC, VAH, and VAL with optional session High/Low markers.
Color Modes – Choose between heatmap intensity (volume-based) or buy/sell ratio blending for directional context.
Performance Optimized – Rebuilds only when structure changes, ensuring smooth operation even with large histories.
Technical Overview
1. Binning & Aggregation
The full price range is divided into a user-defined number of rows (bins) of equal height.
For each bar, traded volume is distributed across all intersecting bins proportionally to price overlap.
A buy/sell proxy is estimated based on candle close position, producing per-row Buy, Sell, and Total Volume arrays.
2. Silhouette Rendering
Each row’s strength = total volume ÷ maximum volume.
Two color modes:
• Volume Mode → intensity scales by relative volume (heatmap).
• Ratio Mode → blend between sell and buy base colors based on dominance (close position).
Weak or neutral rows can be faded or forced to minimum width via strength and ratio-deviation filters.
3. Node Detection (LVN / MVN / HVN)
Relative bands are defined by lower/upper % thresholds.
Consecutive rows meeting criteria are grouped into “bands.”
Optional gap-merge unifies nearby bands separated by small gaps (in ticks).
Quality filters:
• Min. Average in Band (%) → enforces minimum average participation.
• Min. Prominence vs. Neighbors (%) → compares contrast against adjacent volume peaks.
Enforces minimum center distance (in ticks) to prevent overlap.
Each valid band draws a Top/Bottom line pair and optional mid-label (LVN/MVN/HVN).
4. Volume Peaks
Ranks all rows by total volume (descending) and selects top N peaks with spacing filters.
Drawn as horizontal lines or labeled markers (P1, P2, etc.).
5. POI Lines (Most Touches)
During aggregation, each row counts how many bars overlap it.
The top X rows with highest touch counts are drawn as POI lines—often strong participation or mean-retest zones.
6. Value Area (POC / VAH / VAL)
POC = row with highest total volume.
Expands outward symmetrically until the configured Value Area % of total volume is covered.
VAH and VAL mark the acceptance range; optional High/Low lines outline total range boundaries.
7. Right-Fix Layout
All components are rendered relative to the chart’s rightmost bar.
Width dynamically scales with visible bars × % width setting, ensuring proportional scaling across zoom levels.
How to Use
Read market structure:
HVNs = high acceptance or balance areas → likely mean-reversion zones.
LVNs = thin participation → breakout or rejection points (“air pockets”).
MVNs = transition areas between acceptance and rejection.
Trade around POC / VAH / VAL:
These levels represent fair-value boundaries and rotational pivots.
POI & Peaks:
Use them as strong reference lines for responsive trading decisions.
Ratio-Color Mode:
Exposes directional imbalance and potential absorption zones visually.
Best practice:
Live trading → right-fix active, moderate row count.
Post-session analysis → higher granularity, LVN/HVN/MVN and peaks enabled with labels.
Key Settings
Core
Lookback length or visible-range mode
Row count (granularity)
Profile width (% of visible bars)
Right offset, minimum box width, transparency
Date Filter
Aggregate only bars from a defined start date onward.
Coloring
Buy/Sell ratio mode toggle
Base colors for buy and sell volume
Filters
Minimum ratio deviation (±) → ignore nearly balanced rows
Minimum volume strength (%) → fade weak rows
LVN / MVN / HVN Detection
Independent enable toggles
Lower/upper % thresholds
Minimum band height (rows)
Merge small gaps (ticks)
Minimum average in band (%)
Minimum prominence vs. neighbors (%)
Minimum distance between bands (ticks)
Line color, width, style, and label options
Peaks
Number of peaks (0–20)
Minimum distance between peaks (ticks)
Color, width, style, label placement
POI Lines
Enable toggle
POI count (1–5)
Minimum gap between POIs (rows)
Color, width, style, label offset
Value Levels (POC / VAH / VAL)
Show/hide Value Area Levels
Value Area % coverage
POC / VAH / VAL line styles, widths, colors
Optional Session High/Low lines
Notes & Limitations
Optimized for intraday and swing data; accuracy depends on chart volume granularity.
Large lookbacks with high row counts and all detection layers enabled may impact performance—adjust parameters for balance.
Buy/Sell ratio is a visual approximation based on candle structure, not actual order-book delta.
Designed as a contextual visualization tool, not a trade signal generator.
Disclaimer
For educational and informational purposes only.
Not financial advice.
Vector Candles - By BlockheadWhat this script does:
Vector Candles highlights moments of intense market participation by coloring “climax” candles — bars where trading activity surges beyond normal conditions. These colored candles make it easy to visualize bursts of liquidity, directional momentum, or exhaustion zones across any market.
⸻
How this script works:
The indicator scans each bar for abnormal behavior in volume and range expansion.
If volume exceeds 2× the 10-bar average or if volume × range reaches a short-term extreme, that candle is marked as a “climax” — lime for bullish momentum or red for bearish pressure.
This provides a clean, real-time visual of where institutional volume or aggressive participation enters the market.
⸻
How to use this script:
Apply Vector Candles to any chart to spot areas of heavy buying or selling interest.
Optionally, enable the “Override Chart Symbol” setting to pull data from a reference market (e.g., QQQ for tech stocks, DXY for gold, BTC index for altcoins).
This allows you to identify when a symbol’s move is part of a sector rotation, broader flow, or inverse correlation, rather than isolated price action.
⸻
What makes this script original:
Unlike traditional vector candle indicators, this version introduces a cross-symbol volume engine — letting you visualize climax activity from one market directly on another.
This unlocks a powerful new layer of contextual analysis, ideal for spotting rotations, correlation breaks, and macro-driven liquidity shifts in real time.
It’s not just about where momentum appears — it’s about where it originates.
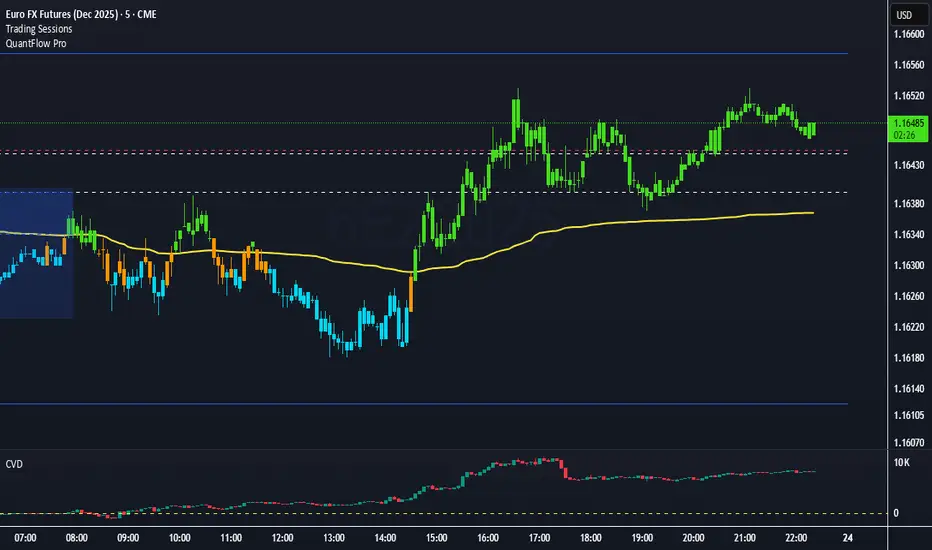
QuantFlow ProQuantFlow Pro
QuantFlow Pro is an advanced institutional indicator designed to detect bias shifts, liquidity imbalances, and real-time flow transitions.
Built on an adaptive architecture, it combines institutional flow analysis, multi-timeframe liquidity levels, and structural reference points to provide a clear and precise view of market dynamics.
Unlike conventional indicators that repaint or produce noisy signals, QuantFlow Pro relies on robust calculations based on volume, delta imbalance, and the detection of structural dislocations.
⚙️ Optimized for Futures markets, QuantFlow Pro helps traders identify market turning points with institutional precision and consistent reliability over time.
Volume Pressure Oscillator (VPO)🔹 Core Logic
VPO Calculation:
The indicator measures price momentum weighted by volume, smoothed by EMA, and normalized within a dynamic range to highlight relative pressure extremes.
Signal Line:
A secondary EMA of VPO acts as a signal baseline for crossovers and trend confirmation.
Entry Triggers:
Zero-line Crossovers: Momentum shifts from bearish to bullish (or vice versa).
Signal Crossovers: Confirmation of sustained directional momentum.
Filters:
Volume Filter: Only trades when volume is above the moving average.
VWAP Slope Filter: Ensures trades align with intraday institutional flow.
Higher Timeframe VWAP: Confirms multi-timeframe directional bias.
RSI Filter: Avoids overextended entries.
Optional Divergence Confirmation: Adds precision in reversal environments.

Dollar Volume Ownership Gauge Dollar Volume Ownership Gauge (DVOG)
By: Mando4_27
Version: 1.0 — Pine Script® v6
Overview
The Dollar Volume Ownership Gauge (DVOG) is designed to measure the intensity of real money participation behind each price bar.
Instead of tracking raw share volume, this tool converts every bar’s trading activity into dollar volume (price × volume) and highlights the transition points where institutional capital begins to take control of a move.
DVOG’s mission is simple:
Show when the crowd is trading vs. when the institutions are buying control.
Core Concept
Most retail traders focus on share count (volume) — but institutions think in dollar exposure.
A small-cap printing a 1-million-share candle at $1 is very different from a 1-million-share candle at $10.
DVOG normalizes this by displaying total traded dollar value per bar, then color-codes and alerts when the volume of money crosses key thresholds.
This exposes the exact moments when ownership is shifting — often before major breakouts, reclaims, or exhaustion reversals.
How It Works
Dollar Volume Calculation
Each candle’s dollar volume is computed as close × volume.
Data is aggregated from the 5-minute timeframe regardless of your current chart, allowing consistent institutional-flow detection on any resolution.
Threshold Logic
Two customizable levels define interest zones:
$500K Threshold → Early or moderate institutional attention.
$1M Threshold → High-conviction or aggressive accumulation.
Both levels can be edited to fit different market caps or trading styles.
Bar Coloring Scheme
Red = Dollar Volume ≥ $1,000,000 → Significant institutional activity / control bar.
Green = Dollar Volume ≥ $500,000 and < $1,000,000 → Emerging accumulation / transition bar.
Black = Below $500,000 → Retail or low-interest zone.
(Colors are intentionally inverted from standard expectation: when volume intensity spikes, the bar turns hotter in tone.)
Plot Display
Histogram style plot displays 5-minute aggregated dollar volume per bar.
Dotted reference lines mark $500K and $1M levels, with live right-hand labels for quick reading.
Optional debug label shows current bar’s dollar value, closing price, and raw volume for transparency.
Alerts & Conditions
DVOG includes three alert triggers for hands-off monitoring:
Alert Name Trigger Message Purpose
Green Bar Alert – Dollar Volume ≥ $500K When dollar volume first crosses $500K “Institutional interest starting on ” Signals early money entering.
Dollar Volume ≥ $500K Same as above, configurable “Early institutional interest detected…” Broad alert option.
Dollar Volume ≥ $1M When dollar volume first crosses $1M “Significant money flow detected…” Indicates heavy institutional presence or ignition bar.
You can enable or disable alerts via checkbox inputs, allowing you to monitor just the levels that fit your style.
Interpretation & Use Cases
Identify Institutional “Ignition” Points:
Watch for sudden green or red DVOG bars after long low-volume consolidation — these often precede explosive continuation moves.
Confirm Breakouts & Reclaims:
If price reclaims a key level (HOD, neckline, or coil top) and DVOG flashes green/red, odds strongly favor follow-through.
Spot Trap Exhaustion:
After a flush or low-volume fade, the first strong green/red DVOG bar can mark the institutional reclaim — the moment retail control ends.
Filter Noise:
Ignore standard volume spikes. DVOG only reacts when dollar ownership materially changes hands, not when small traders churn shares.
Customization
Setting Default Description
$500K Threshold 500,000 Lower limit for “Green” institutional attention.
$1M Threshold 1,000,000 Upper limit for “Red” heavy institutional control.
Show Alerts ✅ Enable or disable global alerts.
Alert on Green Bars ✅ Toggle only the $500K crossover alerts.
Adjust thresholds to match the liquidity of your preferred tickers — for example, micro-caps may use $100K/$300K, while large-caps might use $5M/$20M.
Reading the Output
Black baseline = Noise / retail chop.
First Green bar = Smart money starts building position.
Red bar(s) = Ownership shift confirmed — institutions active.
Flat-to-rising pattern in DVOG = Sustained accumulation; often aligns with strong trend continuation.
Summary
DVOG transforms raw volume into actionable context — showing you when capital, not hype, is moving.
It’s particularly effective for:
Momentum and breakout traders
Liquidity trap reclaims (Kuiper-style setups)
Identifying early ignition bars before halts
Confirming frontside strength in micro-caps
Use DVOG as your ownership radar — the visual cue for when the market stops being retail and starts being real.