Volume Profile S/R + OB/OS + BreaksAs a support resistance trader I have created this indicator that shows SR lines. RSI over bought and over sold. I also added momentum candle.
It's easy to use. The arrows show over bought and over sold, that's where I start to be interested. Confirmation is if we are near a support/resistance area. shown as a red/green line.
Don't just trade the RSI, Be patient and only take the perfekt setups.
I't clean, it's simple it works.
Hacim

DTR Volume FVGDTR Volume FVG detects bullish and bearish Fair Value Gaps and shows how much volume occurred inside each gap. Instead of only drawing the imbalance, the indicator analyzes a lower timeframe and builds a small volume profile inside every FVG. This helps you understand which gaps are strong, weak, likely to hold, or likely to fill.
How It Works:
- The indicator finds FVGs using a lower timeframe (Auto mode or manual selection).
- Each FVG is drawn as a colored zone: green for bullish, purple for bearish.
- Inside the gap, the script shows volume distribution using horizontal boxes.
- The FVG extends forward in time until the gap is fully filled or invalidated.
- Once price closes through the gap, the zone is removed automatically.
How to Use:
- High volume inside the FVG suggests strong interest and possible support or resistance.
- Low volume suggests the gap may fill more easily.
- Bullish FVGs are used as retracement zones in uptrends.
- Bearish FVGs are used as retracement zones in downtrends.
- Use the Display option to hide the volume boxes if you want a cleaner chart.
Best For:
- Finding strong retracement zones
- Identifying which gaps matter
- Understanding how price and volume behaved during displacement
- Improving entries and stop placement with volume levels inside FVGs
This indicator gives a clearer view of which imbalances are important by combining FVG structure with real volume data.

DTR Volume TrendDTR Volume Trend is a volume-based oscillator designed to measure trend strength, momentum shifts, and mean-reversion opportunities using volume-weighted price data. The indicator analyzes recent volume profiles, VWAP deviation, and smoothed signals to create a responsive oscillator that adapts to market conditions.
Key Features:
- Volume-weighted oscillator based on VWAP and volume distribution.
- Mean reversion mode to detect when price deviates strongly from its volume-weighted average.
- Adaptive midline that adjusts automatically to recent oscillator behavior.
- Bull and bear zones that highlight potential exhaustion or reversal areas.
- Fast and slow signal lines to show momentum changes through crossovers.
- Optional bar coloring to highlight bullish or bearish conditions on the chart.
How to Use:
- When the oscillator is above the midline, momentum tends to be bullish.
- When it is below the midline, momentum tends to be bearish.
- Upper zones may indicate overbought or exhaustion levels.
- Lower zones may indicate oversold or accumulation levels.
- Crossovers between fast and slow signals can highlight early trend or momentum shifts.
Best For:
- Trend confirmation
- Mean-reversion strategies
- Identifying momentum changes
- Spotting volume-driven extremes

VCP Base Detector
📊 VCP BASE DETECTOR - AUTO-DETECT CONSOLIDATION ZONES
🎯 WHAT IS THIS INDICATOR?
This indicator automatically detects and marks ALL consolidation bases (VCP bases) on your chart. It:
✅ Auto-detects when price enters consolidation
✅ Measures base tightness (volatility contraction)
✅ Tracks base duration (how long consolidating)
✅ Rates base quality (1-5 stars)
✅ Shows volume drying confirmation
✅ Detects base breakouts
✅ Shows progression of multiple bases (VCP pattern)
Use this WITH the "Mark Minervini SEPA Balanced" indicator for complete trading setups!
✅ Mark Minervini SEPA Balanced = Trend + RS + Stage
✅ VCP Base Detector = Base Quality + Progression
Combined = Complete professional trading system!
🎨 WHAT YOU SEE ON YOUR CHART
1️⃣ COLORED BOXES (Base Zones):
🟦 Aqua Box = ⭐⭐⭐⭐⭐ Excellent base (tightest)
🔵 Blue Box = ⭐⭐⭐⭐ Very good base
🟣 Purple Box = ⭐⭐⭐ Good base
🟠 Orange Box = ⭐⭐ Fair base
⬜ Gray Box = ⭐ Weak base
2️⃣ BASE LABELS (With Metrics):
Shows above each base:
• Duration: 20 days
• Tightness: 0.9%
• Quality: ⭐⭐⭐⭐⭐
3️⃣ BREAKOUT LABELS (When price exits base):
Green "BREAKOUT ✓" label shows:
• Price: ₹800
• Volume: 1.6x
4️⃣ DASHBOARD (Top-Left Panel):
Real-time base metrics showing:
• In Base: YES/NO
• Tightness: 0.8%
• Duration: 22 days
• Range: 3.5%
• Volume: Drying/Normal
• Quality: ⭐⭐⭐⭐
📊 UNDERSTANDING BASE QUALITY (⭐ Rating System)
⭐⭐⭐⭐⭐ (EXCELLENT)
├─ Tightness: < 0.8% ATR
├─ Duration: 15-40 days
├─ Volume: Significantly drying
├─ Price Range: < 5%
└─ Result: Most explosive breakouts (best quality)
⭐⭐⭐⭐ (VERY GOOD)
├─ Tightness: 0.8-1.0% ATR
├─ Duration: 15-35 days
├─ Volume: Very dry
├─ Price Range: < 7%
└─ Result: High probability breakouts
⭐⭐⭐ (GOOD)
├─ Tightness: 1.0-1.3% ATR
├─ Duration: 15-30 days
├─ Volume: Drying
├─ Price Range: < 8%
└─ Result: Decent breakout probability
⭐⭐ (FAIR)
├─ Tightness: 1.3-1.5% ATR
├─ Duration: 15-25 days
├─ Volume: Moderate drying
├─ Price Range: < 10%
└─ Result: Lower quality, riskier
⭐ (WEAK)
├─ Tightness: > 1.5% ATR
├─ Duration: Varies
├─ Volume: Not drying enough
├─ Price Range: > 10%
└─ Result: Low quality, skip these
📈 HOW TO USE - STEP BY STEP
STEP 1: ADD INDICATOR TO CHART
────────────────────────────────
1. Open any stock chart (use 1D timeframe for swing trading)
2. Click "Indicators"
3. Search "VCP Base Detector"
4. Click to add to chart
5. Wait a moment for boxes to appear
STEP 2: SCAN FOR BASES
───────────────────────
Look for:
✓ Colored boxes appearing on chart (bases forming)
✓ Dashboard showing "In Base: YES"
✓ Tightness below 1.5%
✓ Volume Dry: YES
STEP 3: MONITOR BASE QUALITY
──────────────────────────────
Dashboard shows stars:
⭐⭐⭐⭐⭐ = Wait for breakout (best setup)
⭐⭐⭐⭐ = Good quality, watch for breakout
⭐⭐⭐ = Decent, but not ideal
⭐⭐ or ⭐ = Skip (lower probability)
STEP 4: WAIT FOR BREAKOUT
──────────────────────────
When price breaks above the box:
✓ Green "BREAKOUT ✓" label appears
✓ Shows breakout price and volume
✓ If volume shows 1.3x+, breakout is confirmed
✓ This is your entry signal!
STEP 5: CHECK MINERVINI CRITERIA (Use Both Indicators)
───────────────────────────────────────────────────────
Before entering:
✓ VCP Base Detector shows ⭐⭐⭐⭐+ quality base
✓ Mark Minervini indicator shows BUY SIGNAL
✓ Dashboard shows 10+ criteria GREEN
✓ Stage shows S2
Result: HIGH-PROBABILITY SETUP! 🎯
📋 DASHBOARD INDICATORS - WHAT EACH MEANS
BASE METRICS SECTION:
─────────────────────
In Base = ✓ YES or ✗ NO
Show if price is currently consolidating
Tightness = 0-3% (lower = tighter = better)
< 0.8% = ⭐⭐⭐⭐⭐ (excellent)
0.8-1.0% = ⭐⭐⭐⭐ (very good)
1.0-1.3% = ⭐⭐⭐ (good)
1.3-1.5% = ⭐⭐ (fair)
> 1.5% = ⭐ (weak)
Duration = Number of days in consolidation
15 days = ⭐ (too short, weak)
20 days = ⭐⭐⭐ (ideal)
30 days = ⭐⭐⭐⭐ (very long, strong)
> 40 days = ⚠️ (too long, may break down)
Range = % movement within the base
< 5% = ⭐⭐⭐⭐⭐ (excellent, very tight)
5-8% = ⭐⭐⭐ (good)
> 10% = ⭐ (loose, not ideal)
Vol Dry = Volume status during consolidation
✓ YES = Volume contracting (good)
✗ NO = Normal/high volume (weak setup)
QUALITY SECTION:
────────────────
Stars = Overall base quality rating
⭐⭐⭐⭐⭐ = Best quality bases (most explosive)
⭐⭐⭐⭐ = Excellent quality
⭐⭐⭐ = Good quality
⭐⭐ = Fair quality
⭐ = Weak quality (skip)
52W INFO SECTION:
─────────────────
From 52W Hi = How far below 52-week high is price?
< 25% = In sweet zone ✓
> 25% = Too far from highs ✗
From 52W Lo = How far above 52-week low is price?
> 30% = In sweet zone ✓
< 30% = Too close to lows ✗
⚙️ CUSTOMIZATION GUIDE
Click ⚙️ gear icon next to indicator to adjust:
MINIMUM BASE DAYS (Default: 15)
──────────────────────────────
Current: 15 = Include shorter bases
Change to 20 = Longer bases only (higher quality)
Change to 10 = Include very short bases (more frequent)
Why: Longer bases = better breakouts, but fewer opportunities
ATR% TIGHTNESS THRESHOLD (Default: 1.5)
────────────────────────────────────────
Current: 1.5 = BALANCED for Indian stocks
Change to 1.0 = ONLY very tight bases (⭐⭐⭐⭐⭐)
Change to 2.0 = Looser bases included (more frequent)
Why: Lower = tighter bases = better quality, fewer signals
VOLUME DRYING THRESHOLD (Default: 0.7)
──────────────────────────────────────
Current: 0.7 = Volume at 70% of average (good drying)
Change to 0.6 = Stricter (more volume drying required)
Change to 0.8 = Looser (less volume drying required)
Why: Volume drying = consolidation confirmation
52W PERIOD (Default: 252)
─────────────────────────
Current: 252 = Full year lookback
Don't change unless you know what you're doing
📈 REAL TRADING EXAMPLE
SCENARIO: Trading MARUTI over 6 weeks
WEEK 1: Nothing happening
─────────────────────────
- No boxes on chart
- Dashboard: "In Base: NO"
- Action: SKIP (not consolidating)
WEEK 2: Base Starting to Form
─────────────────────────────
- Purple box appears (⭐⭐⭐ quality)
- Dashboard: "In Base: YES"
- Tightness: 1.2%
- Duration: 3 days (too new)
- Action: MONITOR (let it develop)
WEEK 3-4: Base Tightening
──────────────────────────
- Box color changes from Purple → Blue (⭐⭐⭐⭐ quality)
- Dashboard: Duration: 12 days
- Tightness: 0.9%
- Vol Dry: YES
- Action: GET READY (high-quality base forming)
WEEK 4-5: Perfect Base Formed
──────────────────────────────
- Box changes to Aqua (⭐⭐⭐⭐⭐ EXCELLENT!)
- Dashboard: Duration: 22 days ✓
- Tightness: 0.8% ✓
- Vol Dry: YES ✓
- Range: 4.2% ✓
- Action: WATCH FOR BREAKOUT
WEEK 5: BREAKOUT HAPPENS!
──────────────────────────
- Price closes above box
- Green "BREAKOUT ✓" label appears
- Shows: Price ₹850, Volume 1.6x
- Mark Minervini indicator: BUY SIGNAL ✓
- Dashboard all GREEN ✓
- Action: ENTER TRADE
Entry: ₹850
Stop: Box low (₹820)
Target: ₹980 (20% move)
RESULT: +15.3% profit in 2 weeks! ✅
💡 PRO TIPS FOR BEST RESULTS
1. COMBINE WITH MINERVINI INDICATOR
Use BOTH indicators together:
✓ VCP Detector = Base quality
✓ Minervini = Trend + RS + Volume
Result = Best high-probability setups
2. PREFER ⭐⭐⭐⭐+ QUALITY BASES
Don't trade ⭐⭐ or ⭐ quality bases
Only trade ⭐⭐⭐+ (ideally ⭐⭐⭐⭐+)
Higher quality = Higher win rate
3. WAIT FOR VOLUME CONFIRMATION
Base must show "Vol Dry: YES"
Breakout must have 1.3x+ volume
Low volume breakouts fail often
4. USE 1D TIMEFRAME ONLY
This indicator optimized for daily charts
Intraday = Too many false signals
Weekly = Misses good setups
5. MONITOR MULTIPLE BASES (VCP PATTERN)
Multiple bases getting tighter = VCP pattern
Each base should be better quality than last
Tightest base = Biggest breakout
6. COMBINE WITH 52W CONTEXT
Dashboard shows "From 52W Hi" and "From 52W Lo"
Price should be in sweet zone:
< 25% from 52W high (uptrend territory)
> 30% above 52W low (not oversold)
7. BACKTEST FIRST
Use TradingView Replay
Go back 6-12 months
See how many bases appeared
See which were profitable
❌ BASES TO SKIP (Lower Probability)
Skip if:
❌ Quality rating < ⭐⭐⭐ (only 1-2 stars)
❌ Tightness > 1.5% (too loose)
❌ Duration < 10 days (too short, weak)
❌ Duration > 50 days (too long, may break down)
❌ Vol Dry: NO (volume not contracting)
❌ Range > 10% (not tight consolidation)
❌ Price < 30% from 52W low (too weak)
❌ Price > 30% from 52W high (too far up, late entry)
⚠️ IMPORTANT DISCLAIMERS
✓ This indicator is for educational purposes only
✓ Past performance does not guarantee future results
✓ Always use proper risk management (position sizing, stop loss)
✓ Never risk more than 2% of your account on one trade
✓ Base detection is technical analysis, not investment advice
✓ Losses can occur - trade at your own risk
✓ Combine with other indicators for best results
🎓 LEARNING RESOURCES
To understand VCP bases better:
→ Study "Trade Like a Stock Market Wizard" by Mark Minervini
→ Watch: "VCP Pattern" videos on YouTube
→ Practice: Backtest on 1-2 years of historical data
→ Learn: How consolidation precedes breakouts
🚀 YOU'RE READY!
Happy trading! 📈🎯

Crypto Grail Crypto Grail — Advanced Multi-Factor Market Intelligence System
Crypto Grail is an institutional-grade multi-factor trading system designed to identify high-probability market conditions through structured trend analysis, volatility modeling, volume diagnostics and candle-level momentum evaluation. The tool operates as an adaptive decision framework that highlights only the most meaningful market alignments while filtering out low-quality noise.
Core Trend Architecture
Crypto Grail builds directional bias using a layered trend framework that integrates:
• EMA21, EMA50 and EMA200 structural mapping
• SuperTrend confirmation
• ADX trend-strength assessment
• EMA-spread evaluation for macro bias
This architecture allows Crypto Grail to distinguish impulsive directional movement from non-directional consolidation phases with high precision.
Quality Scoring Engine
Every potential long or short setup is processed through a quantitative scoring model that evaluates:
• Trend alignment across EMA structure
• SuperTrend directional confirmation
• ADX intensity
• RSI zone positioning
• Candle delta (close-location value)
• Volume deviation relative to baseline
• Volatility state (compressed / normal / explosive)
• Movement percentage vs recent history
• Impulse strength within the current bar
Only setups that satisfy the required quality threshold are eligible for display.
Volatility Regime Modeling
The system dynamically identifies volatility regimes by analyzing:
• ATR-based volatility gradient
• Recent movement amplitude
• Candle impulse relative to volatility envelope
• Expansion and compression cycles
• Chaotic transitions and unstable bursts
This allows the script to identify when the market environment supports sustained follow-through versus when conditions are structurally noisy.
Volume Deviation Framework
Crypto Grail evaluates volume behavior using a rolling baseline to detect:
• Genuine volume expansion
• Volume contraction
• Spike clusters
• Impulse confirmation with volume alignment
Volume states are incorporated directly into the quality-scoring engine, ensuring signals appear only when supported by underlying market participation.
Early & Hybrid Entry Logic
Two optional entry modes expand the system’s capability during dynamic phases:
• Early Mode: identifies strong impulse shifts confirmed by volume + delta
• Hybrid Mode: merges early detection with trend-filtered confirmation
These modes enable more aggressive entries without compromising structural integrity.
Sideways Market Filter
The system includes a consolidation-detection layer that restricts signal generation during:
• Flat ranges
• Low-energy volatility clusters
• ADX-weak trend environments
• EMA compression zones
This significantly increases average signal reliability.
Integrated Trade Simulation Engine
Crypto Grail includes a full visual trade-simulation module featuring:
• ATR-based dynamic stop loss
• Risk-to-reward take profit engine
• Optional ATR trailing stop
• Trade cooldown control
• Complete entry/exit marking
• SL/TP visualization
• Automatic exit-reason tagging
This makes each signal structurally transparent and easy to analyze.
Market Condition Panel
A real-time performance and condition dashboard displays:
• Total trades
• Wins and losses
• Long/short distribution
• Early-entry analytics
• Volume regime
• Volatility regime
• Trend condition
• Current directional bias
This provides ongoing contextual insight during live market conditions.
System Purpose
Crypto Grail is designed as a professional decision-support system that isolates high-probability market structures through multi-layer technical validation. The tool does not guarantee results and should be used with proper risk management.

EVS BTC V1Overview
The "EVS BTC V1" is a momentum-based trading strategy designed for Bitcoin (BTC) or similar volatile assets on TradingView. It combines Exponential Moving Averages (EMAs) for trend direction, volume confirmation to filter for strong moves, and an optional Relative Strength Index (RSI) filter to avoid overextended entries. The strategy uses a trailing stop for exits to lock in profits dynamically. It's set up for backtesting with an initial capital of $10,000, risking 10% of equity per trade, and accounting for 0.1% commissions.This is a crossover strategy: it goes long on bullish EMA crossovers with high volume (and RSI not overbought) and short on bearish crossunders (with high volume and RSI not oversold). It's overlayed on the main price chart for easy visualization.Key Parameters (User-Adjustable)Fast EMA Period: 9 (default) – Shorter-term trend line.
Slow EMA Period: 21 (default) – Longer-term trend line.
Volume Multiplier: 1.5 (default) – Requires volume to be 1.5x the 20-period average for signal validation.
Use RSI Filter?: Enabled (default) – Optional toggle to apply RSI conditions.
RSI Period: 14 (default), with overbought threshold at 70 and oversold at 30.
Trailing Stop Profit: 50 points (default) – Activates trailing once this profit level is hit.
Trailing Stop Offset: 20 points (default) – Distance from the high/low to trail the stop-loss.
Indicators UsedEMAs: 9-period (fast, blue line) and 21-period (slow, red line) on close prices.
Volume Filter: Compares current volume to a 20-period SMA; signals only trigger if volume exceeds the average by the multiplier (highlighted in yellow bars).
RSI: 14-period on close; plotted in purple on a sub-panel if enabled, with dashed horizontal lines at 70 (overbought) and 30 (oversold).
Entry RulesEntries are triggered only when all conditions align on a bar close:Direction
Conditions
Long (Buy)
- Fast EMA crosses over Slow EMA (bullish trend shift).
- Volume is "high" (> 1.5x 20-period avg).
- RSI < 70 (not overbought; skipped if filter disabled).
Short (Sell)
- Fast EMA crosses under Slow EMA (bearish trend shift).
- Volume is "high" (> 1.5x 20-period avg).
- RSI > 30 (not oversold; skipped if filter disabled).
On entry: Places a market order using 10% of current equity.
Alerts: Fires a one-time alert per bar (e.g., "Long Signal: EMA Crossover + High Volume!").
Exit RulesNo fixed take-profit or stop-loss on entry.
Uses a trailing stop for both long and short positions:Trails the stop-loss 20 points below the highest high (for longs) or 20 points above the lowest low (for shorts), but only activates after 50 points of unrealized profit.
This allows winners to run while protecting gains dynamically.
Positions close automatically on opposite signals or trailing stop hits (no pyramiding; only one position per direction at a time).
VisualizationMain Chart: Blue fast EMA and red slow EMA lines. Green background tint on long signals, red on short signals.
Volume Sub-Panel: Gray columns for normal volume, yellow for high-volume bars; zero line for reference.
RSI Sub-Panel (if enabled): Purple RSI line with overbought/oversold dashed lines.
Strengths and ConsiderationsStrengths: Simple, trend-following with volume to avoid weak signals; RSI adds mean-reversion protection; trailing stops suit trending markets like BTC.
Risks: Whipsaws in sideways markets (EMA crossovers can false-signal); volume filter may miss low-volume breakouts; trailing parameters (50/20 points) assume a specific price scale (e.g., BTC/USD in dollars—adjust for other pairs).
Best For: Higher timeframes (e.g., 1H or 4H) on volatile crypto pairs. Backtest on historical data to tune parameters.

Magic Swing Suite: Trend, Pullback & Risk DashboardMagic Swing Suite: Trend, Pullback & Risk Dashboard
This indicator is a complete Swing Trading System designed to identify high-probability trend continuation setups. It combines classic trend-following principles with a unique "3-Bar Retest" logic and provides a real-time Strategy Dashboard to help you manage positions without needing a separate strategy script.
How it Works:
The system looks for a "Confluence" of factors before generating a signal. It scores every bar out of 140 points based on the following criteria:
Trend Alignment: Price must be above EMA 10, and EMA 10 must be above EMA 20.
Momentum (RSI): RSI must be in the "Bullish Control Zone" (60-80) and above its SMA.
Volume: Volume must be significantly higher than the average (1.5x by default).
The "Magic" Retest: The script checks the last 2-5 bars to see if the price has pulled back to "kiss" the EMA 10. This ensures we are buying a dip in a trend, not chasing a top.
Breakout Confirmation: Checks for Darvas Box breakouts and price position relative to Pivot R1.
Features:
🎯 Virtual Strategy Dashboard: A table that mimics a strategy tester. It tracks Entry, Stop Loss (Trailing), Target 1, and Target 2 in real-time.
📊 Confluence Scorecard: A detailed table showing exactly why a signal was (or wasn't) generated (Trend, Retest, RSI, Volume, etc.).
🛡️ Risk Management: automatically calculates a Trailing Stop (EMA 10) and fixed Risk:Reward targets based on recent highs.
📉 Multi-Layered Overlays: Includes Auto-Pivots (Traditional, Fib, Woodie, etc.) and Darvas Boxes to identify support/resistance levels.
How to Use:
Wait for a Signal:
"FULL BUY SIGNAL" (Green): All conditions are met, including a recent retest of the EMA. This is the highest probability setup.
"BUY - NO RETEST" (Orange): Trend and momentum are strong, but price hasn't pulled back recently. Use caution, as this may be a breakout trade.
Monitor the Dashboard: Once a trade is active, the dashboard will change to "IN POSITION." Follow the "Action" row.
If the trend weakens, the Trailing Stop (EMA 10) will move up to protect profits.
Targets:
T1: Previous Swing High (or 5% if no high found).
T2: 1:1.6 Risk/Reward extension.
Settings:
Volume Spike Factor: Adjust how much volume is needed to confirm a move. Default is 1.2.
Retest Tolerance: Adjust how close the price needs to get to the EMA 10 to count as a "retest."
Dashboard Toggles: You can hide the tables if you prefer a clean chart.
Pivot Timeframes: customizable lookback for S/R levels.
FAQ:
Does this repaint?
No. All signals trigger only on confirmed bars.
Can I use this intraday?
Yes. Works great from 5m to 1D.
Are exits manual or automated?
The indicator tracks SL, T1, and T2, and marks them on the chart.
Does retest affect the buy signal?
Retest is optional. The buy logic does not require it, but adds weight to the score.
Disclaimer: This tool is for educational purposes only. The "Strategy Dashboard" is a simulation based on script calculations and does not execute real trades. Always manage your own risk.

BT Volume & Volatility Spike
The BT Spike Indicator is aimed at identifying significant spikes in trading volume and price volatility on cryptocurrency or futures charts. It helps traders spot potential reversal or momentum shifts by combining volume analysis with volatility measures. The core logic revolves around detecting when volume surges above its historical average while volatility (measured via ATR) also spikes, signaling unusual market activity that could precede breakouts, pullbacks, or trend changes.
Key features include:
Inputs: Customizable parameters like lookback periods for averages (e.g., 14-bar EMA for volume), ATR length (default 14), and spike thresholds (e.g., volume multiplier of 2x the average).
Visuals: Plots bars or shapes on the chart for spike detections (e.g., green for bullish spikes, red for bearish), with optional alerts for real-time notifications.
Versions: We iterated on it, adding features like better alert conditions and visual signals, but rolled back to a simplified v0.1 for reliability, removing some experimental bug-prone elements like multi-timeframe checks.
BT Spike is a volume & volatility signal meant to alert traders that a move could begin soon, and is a supplementary tool to highlight confluence for existing high-probability setups.

Bull/Bear/Consolidation Zones Hariss 369This indicator helps to identify bullish, bearish, and consolidation zones using EMA and ATR-based calculations. It visually highlights zones on the chart and provides buy and sell signals with ATR-based stop-loss (SL) and take-profit (TP) levels.
Key Features:
EMA Trend Filter: Determines the direction of the market.
Bull / Bear / Consolidation Zones: Colored zones to easily spot market phases.
ATR-Based SL & TP: Automatic calculation for each trade signal.
Buy / Sell Signals: Based on price relative to EMA and consolidation zones.
Relative Volume (RVOL) Filter: Optional filter to trade only when volume is significant, helping reduce low-probability signals.
Extended Zones: Option to extend zones forward until a breakout occurs.
Customizable Inputs: EMA length, ATR length, multipliers, RVOL period & multiplier, and toggle RVOL filter.
How to Use:
Identify bull/bear/consolidation zones on your chart. (These are already there) You can change the line as well zone color according to your needs.
Look for buy signals above EMA and consolidation zone, or sell signals below EMA and consolidation zone. The buy and sell labels are already there.
Confirm with RVOL filter (optional) to ensure higher volume support.
Use the plotted SL and TP levels for trade management.
This tool is designed for trend-following and market structure traders who want a visual guide to high-probability trading zones combined with volume confirmation.
One can also trail with EMA in trending market.

MaruMaroo's Multi-MA & BB & Ichimoku매매할 때 가장 기본적으로 세팅하는 이동평균선, 볼린저 밴드, 일목균형표를 스크립트 하나로 합쳤습니다.
무료 계정이라 지표 개수 제한(3개) 때문에 불편하셨거나, 이것저것 추가해서 차트 지저분해지는 거 싫으신 분들 쓰시면 됩니다. 복잡한 거 싹 빼고 딱 필요한 기능만 넣어서 최적화했습니다.
7줄 이동평균선 (Rainbow MA): 단기부터 장기까지 7개 라인을 한 번에 보여줍니다. 설정에서 단순(SMA), 지수(EMA)뿐만 아니라 가중(WMA), 거래량가중(VWMA) 등으로 바꿀 수 있습니다.
헷갈림 방지 라벨: 이평선이 많으면 뭐가 60일선이고 120일선인지 헷갈리는데, 선 끝자락에 숫자(기간)가 뜨도록 해서 보기 편하게 만들었습니다. (글자 크기도 키워둠)
볼린저 밴드 & 일목균형표: 표준편차 1, 2배수 밴드랑 일목 구름대까지 다 포함되어 있습니다.
커스텀: 안 쓰는 기능은 설정에서 체크 해제하면 깔끔하게 사라집니다. 입맛대로 세팅해서 쓰세요.
I combined the most essential trading indicators into a single script to keep the chart clean and bypass the indicator limit.
If you are tired of switching between indicators or have a cluttered screen, this "All-in-One" setup is for you. It includes everything you need for trend and volatility analysis.
7 Moving Averages: Covers short to long-term trends (Rainbow setup). You can switch types between SMA, EMA, SMMA, WMA, and VWMA in the settings.
Smart Labels: Added labels at the end of each MA line so you can instantly see which line corresponds to which period (e.g., 20, 60, 120).
Bollinger Bands & Ichimoku: Includes Double Bollinger Bands (StdDev 1 & 2) and the full Ichimoku Cloud system.
Fully Customizable: You can toggle each component ON or OFF in the settings.

VWAP & EMA9 Cross AlertAlerts the user when VWAP and EMA 9 cross. It gives a general direction of the market to help make decisions.
VWAP & EMA9 Cross AlertAlerts when EMA9 and VWAP Cross. This provides an indicator of general market direction based on these 2 indicators.

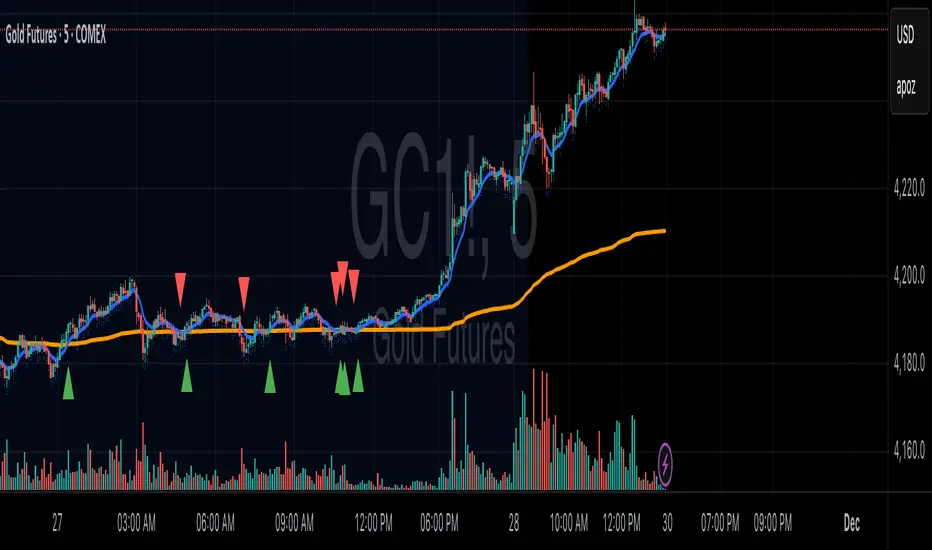
MTProChart XAUUSD⭐ MTProChart XAUUSD — Quick Professional Description
MTProChart XAUUSD is a professional trading indicator designed specifically for Gold (XAUUSD).
It combines trend detection, market structure analysis, and dynamic price zones to deliver clear, reliable trading signals with minimal noise.
✔ Accurate Trend Detection
Identifies the true market direction (uptrend or downtrend) using a refined trend-filtering algorithm.
✔ Dynamic Support & Resistance Zone
Displays a real-time adaptive zone (green band) that acts as:
• Dynamic support in uptrends
• Dynamic resistance in downtrends
This helps traders avoid false breakouts and stay aligned with market structure.
✔ Clear Buy & Sell Signals
The indicator highlights strategic entry and exit points using:
• Trend flips
• Retests
• Momentum confirmations
This gives traders a structured approach instead of guessing.
✔ Optimized for 1M Scalping & Intraday Trading
Perfect for fast-paced XAUUSD conditions with low lag and high accuracy.
⸻
💡 In short:
MTProChart XAUUSD simplifies gold trading by showing:
• Where the trend is
• Where price should bounce
• When to enter
• When to exit
with clean, visually clear signals suitable for both beginners and professional day traders.

Nexural OrderFlow MatrixNexural OrderFlow Matrix
### Professional Order Flow Analysis for Index Futures on TradingView
**Specifically Engineered for:** ES, NQ, YM, RTY, and other high-liquidity index futures
---
## Before You Read Any Further
I need to be upfront with you about something important.
**True order flow analysis—the kind used by institutional traders and prop firms—is not possible on TradingView.**
When professionals talk about order flow, they're referring to the raw tape: every single trade, the exact price, the exact size, and whether it was a buyer lifting the offer or a seller hitting the bid. That level of data simply doesn't exist in TradingView's infrastructure.
So why did I build this indicator? Because TradingView *does* provide meaningful volume delta data through their official functions, and when presented correctly, it can still give you a genuine edge in understanding buying and selling pressure—especially on **index futures** where liquidity is deep and the uptick/downtick methodology works best.
This indicator was specifically engineered with index futures traders in mind. The data sources, the color thresholds, the activity calculations—all of it is optimized for the characteristics of ES, NQ, YM, and RTY. It can work on other instruments, but index futures are where it shines.
I'm not here to oversell you. I'm here to give you the best tool possible within the platform's limitations—and to be completely transparent about what those limitations are.
---
## What This Indicator Actually Does
Nexural OrderFlow Matrix uses TradingView's most advanced volume analysis functions under the hood:
- `ta.requestUpAndDownVolume()` — Samples lower timeframe data to estimate volume on upticks vs downticks
- `ta.requestVolumeDelta()` — TradingView's official cumulative volume delta calculation
The indicator presents this data in two ways:
**1. The Matrix Table**
A heatmap grid aligned beneath each candle showing:
- **Volume** — Total bar volume with yellow/gold intensity gradient
- **Bar VWAP** — Volume-weighted average price within the bar
- **Delta** — Net difference between buying and selling volume
- **Delta %** — Delta as a percentage of total volume (the most important metric)
- **Bar Δ CVD** — How much cumulative volume delta changed this bar
- **Buy Volume** — Estimated volume on upticks
- **Sell Volume** — Estimated volume on downticks
**2. The Imbalance Bars**
A visual stacked bar chart showing the proportional split between buyers and sellers. Green on top represents buying volume, red on bottom represents selling volume. The split is proportional—so a 70/30 bar instantly shows you the imbalance without reading numbers.
**3. The Nexural Flow Meter**
A real-time panel showing:
- Current bias (BUYERS/SELLERS/NEUTRAL)
- Intensity classification (EXTREME/STRONG/MODERATE/WEAK)
- Imbalance ratio (e.g., "BUY 2.3:1")
- Live delta, volume, and VWAP readings
---
## The Color System
I spent considerable time on this because it matters.
Most indicators treat all bars equally. That's noise. In reality, a bar with 8% delta imbalance tells you almost nothing, while a bar with 65% imbalance is screaming information at you.
**The Activity Threshold System:**
- Bars below your threshold (default 25% delta) fade to muted gray tones
- As imbalance increases, colors transition from gray → muted color → vibrant color
- High-activity bars pop with bright greens and reds
- Low-activity bars fade into the background where they belong
**Volume uses a separate yellow/gold gradient:**
- Low volume: Faint, dark yellow-brown
- High volume: Rich, vibrant amber/gold
- This lets you instantly spot volume spikes without reading numbers
The result: your eye is naturally drawn to the bars that matter.
---
## Honest Accuracy Assessment
Based on extensive comparison testing against TradingView's own Volume Footprint and CVD indicators, this indicator achieves approximately **85-90% correlation** with official TradingView tools.
Let me put that in perspective:
| Platform | Data Source | Typical Accuracy |
|----------|-------------|------------------|
| Sierra Chart (Denali feed) | Actual bid/ask tape | 99%+ |
| Bookmap | Actual bid/ask tape | 99%+ |
| NinjaTrader + Kinetick | Tick-level data | 95-99% |
| Jigsaw Daytradr | Reconstructed tape | 95-99% |
| **TradingView (this indicator)** | **Aggregated LTF sampling** | **85-90%** |
| Generic volume indicators | Basic volume only | 50-60% |
We're at the ceiling of what TradingView can provide. The dual data source approach, official library functions, and lower timeframe sampling squeeze out every drop of accuracy the platform allows.
But if you're a dedicated tape reader who needs to see every lot hitting the book, this isn't the tool for that. No TradingView indicator is. That's not a criticism—it's just the reality of the platform's architecture.
---
## Where This Indicator Works Best
### Primary Use Case: Index Futures
This indicator was built specifically for index futures traders. These instruments have the characteristics that make order flow analysis most reliable:
**The Big Four:**
| Symbol | Name | Why It Works |
|--------|------|--------------|
| **ES** | E-mini S&P 500 | Deepest liquidity in the world, tight spreads, clean delta readings |
| **NQ** | E-mini NASDAQ-100 | Massive volume, excellent uptick/downtick correlation |
| **YM** | E-mini Dow | Strong institutional participation, reliable volume data |
| **RTY** | E-mini Russell 2000 | Good liquidity, solid delta accuracy |
Index futures are ideal because:
- **Deep liquidity** — Thousands of contracts per minute means meaningful sample sizes
- **Tight spreads** — Usually 1 tick, so bid/ask attribution is more accurate
- **Continuous trading** — No gaps during RTH, consistent data flow
- **Institutional participation** — Real order flow, not retail noise
- **Official CME volume** — Accurate, exchange-reported data
If you're trading ES, NQ, YM, or RTY on TradingView, this indicator will give you the most accurate order flow approximation the platform can provide.
---
### Secondary Use Cases
**Other Liquid Futures:**
- CL, GC, SI (commodities) — Work well but slightly less optimized
- 6E, 6B, 6J (currency futures) — Decent accuracy with good liquidity
**Large-Cap Stocks & ETFs:**
- SPY, QQQ, IWM
- AAPL, MSFT, NVDA, TSLA, AMD
- Any stock trading millions of shares daily
**Crypto (with caveats):**
- BTC, ETH on major exchanges
- Works best during active hours
- Quality varies by exchange data feed
**Best Timeframes:**
- 1-minute to 15-minute for active intraday trading
- The indicator automatically selects appropriate lower timeframe sampling
- Can work on higher timeframes but edge diminishes
---
## Where This Indicator Struggles
I could hide this section and let you figure it out the hard way. I'd rather just tell you.
**Low-Volume Stocks:**
If a stock trades 50,000 shares a day, the delta readings will be noisy and inconsistent. The uptick/downtick estimation needs sufficient trade activity to be meaningful.
**Wide-Spread Instruments:**
When spreads are 10+ cents wide, a trade at the ask doesn't necessarily indicate aggressive buying. The bid/ask classification becomes less reliable.
**Forex:**
TradingView shows broker-specific volume for forex, not actual market volume. Readings will vary wildly depending on your data provider. Use with extreme caution, or not at all.
**Pre-Market & After-Hours:**
Liquidity thins dramatically. Estimations become less reliable. I'd trust regular session data far more.
**Daily/Weekly/Monthly Charts:**
The aggregation becomes so smoothed that the edge largely disappears. This is designed for intraday analysis.
---
## How to Actually Use This
### Focus on Delta %, Not Raw Delta
Raw delta is influenced by overall volume. A 500-lot delta sounds significant until you realize the bar traded 50,000 lots—that's just 1% imbalance, which is noise.
Delta % normalizes this. Look for readings above ±30% to identify meaningful pressure. Above ±50% is strong. Above ±70% is extreme.
### Let the Colors Guide You
If a bar is gray, the market isn't showing its hand. Don't overanalyze it. When you see bright green or red cells, that's when something is happening.
### Confirm With Price Action
Order flow data is context, not a signal generator. A strong bullish delta at a key support level means something different than the same reading in the middle of nowhere.
Use this alongside your existing analysis—levels, structure, momentum—not as a replacement.
### Watch for Divergences
Price making new highs while delta turns negative? That's absorption—sellers stepping in but price hasn't reacted yet.
Price dropping but delta stays positive? Buyers are defending.
These divergences often precede reversals. They're where order flow analysis provides genuine edge.
### Adjust the Activity Threshold
The default is 25%. For volatile instruments like NQ futures, you might lower it to 20%. For calmer instruments, raise it to 30-35%. The goal is filtering noise while keeping meaningful signals visible.
---
## Understanding the Metrics
| Metric | What It Tells You |
|--------|-------------------|
| **Volume** | Total contracts/shares traded |
| **Delta** | Net buying minus selling volume |
| **Delta %** | How imbalanced the bar is (key metric) |
| **Bar Δ CVD** | Cumulative delta change for this bar |
| **Imbalance Ratio** | Buy:Sell ratio (e.g., 2.1:1 or 1:1.8) |
| **Bar VWAP** | Where most volume transacted within the bar |
| Delta % Range | Interpretation |
|---------------|----------------|
| 0-15% | Neutral, no clear pressure |
| 15-30% | Weak directional bias |
| 30-50% | Moderate pressure |
| 50-70% | Strong imbalance |
| 70%+ | Extreme one-sided flow |
| Color | Meaning |
|-------|---------|
| Gray | Low activity, likely noise |
| Muted Green | Mild buying pressure |
| Bright Green | Strong buying pressure |
| Muted Red | Mild selling pressure |
| Bright Red | Strong selling pressure |
| Yellow/Gold | Volume intensity (separate scale) |
---
## Settings Breakdown
**Display Settings:**
- *Show Matrix Table* — Toggle the data heatmap on/off
- *Show Imbalance Bars* — Toggle the stacked visual bars on/off
- *Row Height* — Adjust the matrix row sizing
- *Activity Threshold* — Delta % below which bars fade to gray
**Imbalance Bars:**
- *Bar Height* — Vertical size of the stacked bars
- *Show Volume Labels* — Display buy/sell volume numbers
- *Show Percentage* — Display buy/sell percentages
**Timeframe Mode:**
- *Auto* — Sensible defaults based on your chart timeframe
- *Aggressive* — Samples from lowest possible timeframe (more granular)
- *Conservative* — Samples from slightly higher timeframe (smoother)
- *Custom* — You choose the exact lower timeframe
**CVD Reset:**
- *Daily* — Standard for intraday trading
- *Weekly/Monthly* — Useful for swing analysis
- *None* — Running cumulative total
---
## A Note on Expectations
I built this to be the best possible order flow tool within TradingView's constraints. It uses every optimization available, presents data in a clean and functional way, and doesn't pretend to be something it's not.
But I want to be clear: if order flow is central to your strategy and you're making decisions based on tape reading, you should seriously consider platforms designed for that purpose. Sierra Chart, Bookmap, Jigsaw—these tools show you the actual order book and time & sales. The difference is substantial.
Think of Nexural OrderFlow Matrix as a bridge. It gives TradingView users access to order flow concepts with reasonable accuracy. For many traders, especially those combining multiple analysis methods, that's enough. For dedicated tape readers, it's a starting point that might inspire you to explore deeper tools.
---
## What You're Getting
- **Dual visualization modes** — Matrix table and/or Imbalance bars
- **Activity-based color system** — Noise fades, signals pop
- **Real-time Nexural Flow Meter** — Live imbalance readings
- **Flexible configuration** — Show what you need, hide what you don't
- **Honest accuracy** — 85-90% correlation with official TradingView data
- **Clean, professional presentation** — Designed for actual trading, not screenshots
---
## What You're Not Getting
- Raw tick data (TradingView limitation)
- Bid/ask tape attribution (TradingView limitation)
- Order book depth (TradingView limitation)
- 99% accuracy (impossible on this platform)
- Magic signals (this is a tool, not a strategy)
---
## Final Thoughts
Trading is hard enough without tools that overpromise and underdeliver. I'd rather give you something that works within its limitations and be honest about those limitations than sell you a fantasy.
Nexural OrderFlow Matrix does what it says. It presents TradingView's best volume delta data in a clear, heatmap format with intelligent color coding. It's accurate within the platform's constraints. It's clean, it's fast, and it doesn't clutter your chart with noise.
Use it wisely. Combine it with price action, levels, and your own market understanding. And if you ever feel limited by what TradingView offers, know that there are deeper tools waiting for you when you're ready.
Trade well.
*— Nexural Trading*
---
## Quick Reference Card
**Built For:** Index Futures (ES, NQ, YM, RTY)
**Also Works On:** CL, GC, SPY, QQQ, large-cap stocks
**Avoid On:** Low-volume stocks, forex, illiquid instruments
**Best Timeframes:** 1-min to 15-min intraday
**Key Metric:** Delta % (not raw delta)
**Accuracy:** ~85-90% vs TradingView official tools
**Edge:** Divergences between price and delta
---
*Nexural OrderFlow Matrix — Engineered for index futures. Maximum accuracy within TradingView's limits.*

Aggressive VS Passive Orders Depletion @MaxMaserati 3.0Aggressive VS Passive Orders Depletion Indicator
Overview
This institutional-grade order flow analysis tool identifies and tracks limit order accumulation zones where significant buy and sell orders are placed in the market. It combines Highest Volume Candle Profile analysis with Market Structure detection to reveal where institutional traders have positioned their orders, and monitors in real-time whether these orders are being absorbed (depleted) or defended.
Core Concept: Order Block Detection & Depletion
This tool tracks the actual limit orders at key price levels and shows you:
Where institutional orders are placed (Buy Order Blocks vs Sell Order Blocks)
How strong these order zones are (original volume strength as %)
Real-time order flow activity (aggressive buyers vs aggressive sellers)
Depletion status (are the orders being consumed or defended?)
How It Works: Dual-Engine System
Engine 1: Volume Profile Analysis - Point of Control (POC) Detection
Divides price range into 25 horizontal levels (configurable)
Analyzes the last 120 bars (configurable lookback)
Distributes volume across price levels based on where each bar traded
Identifies the Point of Control (POC) - the price level with highest traded volume
Determines market bias: Bullish if price above POC, Bearish if below
Purpose: Shows where the majority of volume has been traded, indicating institutional accumulation zones and fair value areas.
Engine 2: Market Structure Analysis (PHL - Pivot High/Low)
Uses fractal pivot detection (configurable strength)
Identifies swing highs and lows that create market structure
Tracks Break of Structure (BOS) - price breaks recent swing in trend direction
Tracks Market Structure Shift (MSS) - price breaks swing points against trend
Maintains a trailing price at the most recent significant swing point
Purpose: Identifies where smart money is likely defending key structural levels with limit orders.
Key Innovation #1: Dynamic Confluence Zone Detection
When the Volume Profile POC and Market Structure trail price align within a configurable sensitivity threshold (default 1.0%), the indicator creates an Order Block Zone.
The Algorithm:
Monitors both engines continuously
Creates zones ONLY when POC is within X% of the structural swing point
Both engines must agree on the significance of the price level
Optional volume confirmation filter
This dual-confirmation approach filters out weak levels and highlights only the highest-probability zones where institutional orders are likely clustered.
Zone Types:
🟢 Buy Order Blocks (Support) - Created when confluence occurs with price above the zone. Represents accumulated buy limit orders waiting to support price.
🔴 Sell Order Blocks (Resistance) - Created when confluence occurs with price below the zone. Represents accumulated sell limit orders waiting to resist price.
Key Innovation #2: Real-Time Aggressive VS Passive Order Flow Analysis
The indicator performs sophisticated order flow decomposition on each candle that interacts with a zone, separating market activity into distinct categories:
Order Flow Categories:
1. Aggressive Orders - Market orders that consume liquidity
Aggressive Buy Volume: Market buys hitting sell limits (taking offers)
Aggressive Sell Volume: Market sells hitting buy limits (hitting bids)
Marked with (AGG) label when detected
Indicates urgent traders willing to pay the spread
2. Passive Orders - Limit orders adding liquidity
Passive Buy Volume: New buy limits being placed (making bids)
Passive Sell Volume: New sell limits being placed (making offers)
Shows patient traders providing liquidity
3. New Order Flow - Fresh buying/selling pressure
New Buyers: Total new buying activity (aggressive + passive)
New Sellers: Total new selling activity (aggressive + passive)
Net pressure indicator for zone health
Key Innovation #3: Advanced Order Flow Decomposition Algorithm
The indicator uses a proprietary candle analysis formula to separate aggressive from passive orders based on two key metrics:
Key Metrics:
Body Strength = |Close - Open| / (High - Low)
Close Position = (Close - Low) / (High - Low)
Bullish Candle Analysis:
Strong Aggressive Buying (Close Position ≥ 0.8 AND Body Strength ≥ 0.7):
90% aggressive buying, 10% passive selling, 90% new buyers
Moderate Aggressive Buying (Close Position ≥ 0.6 AND Body Strength ≥ 0.5):
70% aggressive buying, 20% passive selling, 80% new buyers, 20% new sellers
Weak Bullish (Close Position ≥ 0.5):
0-30% aggressive buying, 20-30% passive selling, 60% new buyers, 40% new sellers
Very Weak Bullish (Close Position < 0.5):
0% aggressive buying, 40% passive selling, 40% new buyers, 60% new sellers
Bearish Candle Analysis:
Strong Aggressive Selling (Close Position ≤ 0.2 AND Body Strength ≥ 0.7):
90% aggressive selling, 10% passive buying, 90% new sellers
Moderate Aggressive Selling (Close Position ≤ 0.4 AND Body Strength ≥ 0.5):
70% aggressive selling, 20% passive buying, 80% new sellers, 20% new buyers
Weak Bearish (Close Position ≤ 0.5):
0-30% aggressive selling, 20-30% passive buying, 60% new sellers, 40% new buyers
Very Weak Bearish (Close Position > 0.5):
0% aggressive selling, 40% passive buying, 40% new sellers, 60% new buyers
What This Reveals:
High close position + strong body = Aggressive buying overwhelming sellers
Low close position + strong body = Aggressive selling overwhelming buyers
Mid-range close = Battle between buyers and sellers
Small body = Passive orders dominating (limit orders being placed, not filled)
Key Innovation #4: Dynamic Depletion System with Intelligent Thresholds
The indicator adapts depletion thresholds based on zone strength:
High Liquidity Zones (>300% volume strength):
Depletion at 40% consumption - Massive clusters considered broken early because partial depletion indicates institutional withdrawal
Medium Liquidity Zones (150-300% volume strength):
Depletion at 60% consumption - Standard institutional behavior, majority must be consumed
Normal Liquidity Zones (75-150% volume strength):
Depletion at 80% consumption - Retail and smaller institutional zones need near-complete absorption
Low Liquidity Zones (<75% volume strength):
Depletion at 100% consumption - Weak zones must be fully absorbed before marked depleted
Why This Matters:
Strong zones failing early = powerful reversal signal (institutions gave up)
Weak zones holding = hidden strength (more orders being added)
Adaptive logic prevents false signals from fixed thresholds
Depletion Formula:
For Buy Order Zones:
Zone Liquidity % = (Original Buy Volume / Average Volume) × 100
Consumed % = (Sell Volume Absorbed / Average Volume) × 100
If Consumed Volume > Dynamic Threshold → Zone DEPLETED
For Sell Order Zones:
Zone Liquidity % = (Original Sell Volume / Average Volume) × 100
Consumed % = (Buy Volume Absorbed / Average Volume) × 100
If Consumed Volume > Dynamic Threshold → Zone DEPLETED
Key Innovation #5: Absorption Detection & Battle Analysis
The indicator identifies when one side is overwhelming the other using a configurable Absorption Threshold (default 1.5x = 50% more volume).
Battle States for Buy Order Blocks:
New Buyers Dominating (New Buyers > New Sellers × 1.5):
Label: ↑ New Buyers: +X% - Buy orders successfully defended
Sellers Attacking (New Sellers > New Buyers × 1.5):
Label: ↓ Sellers Attack: +X% (AGG) - Sell orders overwhelming the zone
Active Battle (Both active, <1.5x ratio):
Label: Battle: B+X% vs S+Y% - Active two-way order flow
Quiet Zone (Minimal activity):
Label: ↔ Quiet: X% - Zone untested or ignored
Battle States for Sell Order Blocks:
New Sellers Dominating (New Sellers > New Buyers × 1.5):
Label: ↓ New Sellers: +X% - Sell orders successfully defended
Buyers Absorbing (New Buyers > New Sellers × 1.5):
Label: ↑ Buyers Absorb: +X% (AGG) - Buy orders overwhelming the zone
Active Battle (Both active, <1.5x ratio):
Label: Battle: S+X% vs B+Y% - Active two-way order flow
Quiet Zone (Minimal activity):
Label: ↔ Quiet: X% - Zone untested or ignored
The (AGG) Marker:
Appears when aggressive market orders are detected (high body strength + extreme close position). Indicates institutional-sized urgency—someone is willing to pay market price NOW. Often precedes breakouts or strong continuations.
Label System Explained
No Label = Untested Zone
When a zone is first created, you see ONLY the colored box with NO label. This means:
Price has NOT yet reached this order block
The limit orders are still pending/resting
The zone is a future area of interest
Labels only appear after first price contact
Label Format (After First Touch):
Line 1: ● XX% Order Type
Line 2: Flow Analysis
Example Labels:
Buy Order Blocks:
● 150% Buy Orders + ↑ New Buyers: +85%
● 150% Buy Orders + ↑ New Buyers: +120% (AGG)
● 150% Buy Orders + Battle: B+45% vs S+38%
● 150% Buy Orders + ↓ Sellers Attack: +95% (AGG)
● 150% Buy Orders + ↓ Sellers Attack: +95% (AGG)
● 150% Buy Orders
Sell Order Blocks:
● 200% Sell Orders + ↓ New Sellers: +110%
● 200% Sell Orders + ↓ New Sellers: +140% (AGG)
● 200% Sell Orders + Battle: S+62% vs B+41%
● 200% Sell Orders + ↑ Buyers Absorb: +88% (AGG)
● 200% Sell Orders + ↑ Buyers Absorb: +88% (AGG)
● 200% Sell Orders
Status Indicators:
- Price penetrated through the zone
- Orders fully consumed, zone exhausted
Gray color - Zone no longer active
Directional Arrows:
↑ - Upward pressure (buyers stronger)
↓ - Downward pressure (sellers stronger)
↔ - Balanced/quiet (low activity)
↗ / ↘ - Mixed battle with bias
Point of Control (POC) Sub-Level Analysis
Each order block contains advanced volume distribution tracking:
Multi-Level Analysis (default 5 levels): Zones subdivided into horizontal price levels
Volume Distribution: Every candle's volume distributed across sub-levels based on price overlap
Buy/Sell Separation: Each level tracks buy vs sell volume independently
Dynamic POC Line: Marks the price level with highest traded volume within the zone
Real-Time Updates: POC adjusts as new volume enters, showing where "fairest price" is migrating
Style Options: Solid, Dashed, or Dotted lines (configurable width 1-5)
POC Trading Significance:
Represents the most accepted price within the order block
Often the best entry price for limit orders (highest liquidity)
POC migration shows whether zone is being "worked higher" or "worked lower"
Breaking through POC often signals zone failure
Key Settings
Volume Profile:
Lookback Period: 120 bars (historical period for POC)
Price Rows: 25 levels (granularity of volume distribution)
Volume Confirmation: Require structure breaks to align with volume bias
Market Structure:
Pivot Strength: 1 (swing detection sensitivity)
Show Trail: Optional trailing price visualization
Confluence Detection:
Sensitivity: 1.0% (distance threshold for POC/Structure alignment)
Lower = Stricter confluence, fewer zones
Higher = More zones detected
Order Flow Analysis:
Show Real-Time Order Flow: Live buyer/seller activity
Show Aggressive Markers: (AGG) labels for market orders
Show Directional Arrows: Price direction indicators (↑↓↔↗↘)
Absorption Threshold: 1.5x (when one side overwhelms the other)
1.5 = 50% more volume needed
2.0 = 100% more (stricter)
1.2 = 20% more (more sensitive)
Visual Options:
Hide Depleted Zones: Auto-remove exhausted blocks
Smart Bar Coloring: Color candles based on signal alignment
Zone Colors: Customize buy/sell colors
Label Text Size: Tiny, Small, Normal, Large
POC Settings:
Show POC Lines: Toggle Point of Control display
POC Analysis Levels: 3-10 levels
Line Width: 1-5 pixels
Line Style: Solid, Dashed, or Dotted
Trading Applications
1. Institutional Order Detection - Identify where large players positioned limit orders using Volume Profile POC + Market Structure confluence
2. Support/Resistance Validation - Dual confirmation filters weak levels, highlights high-probability reversal areas
3. Order Flow Imbalance Trading - Trade in direction of aggressive flow using (AGG) markers, fade zones showing absorption
4. Breakout/Breakdown Confirmation - and statuses validate moves through key levels
5. Liquidity Hunting - Track stop-loss clusters, anticipate stop runs based on depletion patterns
6. Entry Refinement - Use POC lines for precise limit placement at "fairest price" within zones
Combined Signal System
HVN Volume Profile × Market Structure Signals:
STRONG BUY: Both engines bullish + structure break up + volume confirmation
BUY: Bullish bias with partial confirmation
WEAK BUY: Early bullish signals
STRONG SELL: Both engines bearish + structure break down + volume confirmation
SELL: Bearish bias with partial confirmation
WEAK SELL: Early bearish signals
Alert Conditions:
Strong Buy/Sell signals (with volume confirmation)
Confluence zone activation (new order block created)
Order block depletion (zone exhausted)
What Makes This Indicator Unique
Industry-Standard Foundation:
Volume Profile POC detection + Market Structure analysis (swing pivots, BOS/MSS) + Point of Control tracking
Unique Innovations:
Dynamic Confluence Algorithm + Aggressive vs Passive Order Flow Decomposition + Adaptive Depletion Thresholds + Real-Time Absorption Detection + Battle Analysis with (AGG) markers + Complete Unified Methodology
Technical Excellence:
Resource-optimized (max 50 zones), comprehensive safety checks, multi-tier labeling, flexible customization
Best Practices
Wait for first touch - No label = untested zone
Watch (AGG) markers - Institutional urgency signal
Trust adaptive depletion - Strong zones failing early = major reversal
Use POC for entries - Best price within zone
Combine higher timeframes - Daily/4H zones strongest
Respect zones - Failed support becomes resistance
Follow battle labels - Contested areas show stop clusters
Adjust sensitivity - Tight ranges = lower %, trending = higher %
Performance Notes
Maximum Active Zones: 50 (automatic cleanup)
Maximum Lines: 400 (POC managed dynamically)
Lookback Cap: 1000 bars for optimization
Updates: All calculations on bar close for confirmed signals

Auction Theory Support & Resistance Flipper @MaxMaserati 3.0The Auction Theory Support & Resistance Flipper @MaxMaserati 3.0 indicator identifies and tracks volume-based support and resistance levels using an auction market theory approach. It automatically detects price swing points and creates dynamic "defense zones" where significant volume activity occurred, then monitors these zones to determine if they're being defended or overwhelmed by market participants.
Key Features:
1. Automatic Level Detection
Uses fractal swing detection to identify key reversal points
Creates support zones at swing lows where buyers defended price
Creates resistance zones at swing highs where sellers defended price
2. Volume-Based Validation
Only displays levels with significant volume (above threshold)
Volume strength shown as percentage relative to average volume
Visual volume boxes scale with strength (optional)
3. Auction Status Tracking
The indicator monitors each level and displays real-time auction status through labels:
IMPORTANT - Box Without Label:
When a level is first created, it shows ONLY the box/line with NO label
This means price has NOT yet visited/tested this defense level
The auction has not started yet - it's a pending defense zone
Labels ONLY appear after price touches the zone for the first time
Label Formats (3 modes available once price visits):
Compact Mode: 150% ↑
First number = Original volume strength percentage
Symbol shows auction status (↑↑ Strong Defense, ↑ Defending, ↓ Under Pressure, ↓↓ Overwhelmed, ⇌ Balanced, ✓ Finished, ⚡ Flipped)
Full Mode: 150% | ↑ Defending Auction 45%
Volume strength | Status description | Excess volume percentage
Touch Only: Labels appear only after price touches the level (same as default behavior)
Auction States (after first touch):
Unfinished Auction (⏳): Recently touched, minimal volume absorbed (< 30%)
Balanced Auction (⇌): Volume matching original defense, equilibrium
Defending Auction (↑/↓): Successfully defending with excess volume (20-100%)
Strong Defense Auction (↑↑/↓↓): Overwhelming defense volume (>100%)
Under Pressure (↑/↓): Defense weakening, opposite volume building
Overwhelmed (↑↑/↓↓): Defense broken, significant opposite volume (>50%)
Finished Auction (✓): Volume threshold met (100%+), level depleted
Flipped Level (⚡): Support became resistance or vice versa
4. Support/Resistance Flip Detection
Automatically detects when a support level fails and becomes resistance
Or when resistance breaks and becomes support
Visual indication with orange background and ⚡ symbol
Continues tracking until new auction finishes
5. Summary Table
Active Levels count
Breakdown by Support/Resistance
Number of flipped levels
Maximum volume strength currently active
Settings:
Volume Analysis: Lookback period and threshold multiplier
Auction Management: Depletion threshold, bars away to finish, merge distance
Visual Options: Show/hide boxes, labels, depleted levels
Label Customization: Compact/Full/Touch Only modes, size options
Colors: Buyers (green), Sellers (red), Flipped (orange), Depleted (gray)

DTR Volume 1DDTR Volume 1D is a powerful tool to analyze volume and market activity across different trading sessions. It provides detailed session-level insights to help traders understand where the market is most active and identify key price levels.
Key Features:
1. Session Volume Profiles
- Displays volume distribution for each session.
- Supports Tokyo, London, New York, Daily, Weekly, Monthly, Quarterly, and Yearly sessions.
- Optional Forex session boxes without profiles.
2. Volume Analysis Tools
- Highlights POC (Point of Control) – the price level with the highest traded volume.
- Shows VAH (Value Area High) and VAL (Value Area Low) with optional Value Area Box.
- Tracks live session zones for real-time monitoring.
3. Customizable Display
- Adjustable resolution for finer or coarser profiles.
- Multiple bar modes for different visual styles.
- Fully customizable colors for up/down volume, boxes, lines, and POC.
- Option to smooth volume data for assets with large volume spikes.
4. Data Type Options
- Supports standard Volume or Open Interest data.
5. Session Boxes and Labels
- Automatically draws session boxes with high/low range.
- Optional session labels for easy identification.
6. Smart Calculations
- Auto-detects session start and end.
- Calculates volume profiles based on user-defined resolution.
- Highlights important levels dynamically during the session.
DTR Volume 1D is ideal for traders who want a clear, actionable view of volume distribution and session dynamics, helping you make better trading decisions with session-level insights.

DTR OI IndicatorThe DTR OI Indicator is a multi-exchange open interest indicator designed for futures traders.
It aggregates OI from multiple exchanges to provide a unified and more reliable view of market positioning.
MAIN FUNCTIONS
• Open Interest Candles
• Open Interest Delta
• Delta × Relative Volume
• Open Interest RSI
• Threshold-based alerts for unusually large OI increases or decreases
• Optional OI EMA smoothing
PROFILE SYSTEM
Includes an OI-based distribution profile similar to a volume profile.
Shows Value Area, POC, and structural nodes based on OI activity within the visible chart range.
WHAT IT HELPS IDENTIFY
• Liquidations and rekt events
• Aggressive long/short buildup
• Position unwinds ahead of reversals
• OI-driven levels of interest
• Momentum confirmation (Delta × rVOL)
• Trend exhaustion (OI RSI)
NOTES
• Works across several exchanges for broader accuracy
• Coin or USD quoting supported
• Profile mode is resource-intensive
• No repainting
Ideal for traders who rely on OI, delta, and market positioning to understand futures flows and liquidity shifts.

NIFTY 50 CE/PE Signals (NIFTY 5m Intraday)This script is designed to based on the various parameters to generate most accurate buy and sell signal for NIFTY Option Trading with a win rate of over 60 percent. Always manage your risk . Nothing is guaranteed in market

DANCE WITH WOLVES VN ALL TO 1DANCE WITH WOLVES VN is a smart-money volume indicator designed for stocks and crypto.
Main features:
• logic to detect Distribution, No Demand, Absorption and Exhaustion.
• Automatically builds smart Support/Resistance zones from high-volume price leaders.
• Regression trend channel to see the short-term trend and trading range.
• Dashboard table that shows the top high/low price bars with buy/sell volume and group labels.
• Alert conditions for Breakout above resistance and At Support Area so you don’t need to watch the chart all the time.
You can use it on any symbol and timeframe. Just add the script to your chart and follow the zones (red = resistance, green = support) together with the P/L labels and the status line.
Smart Money Volume + Support/Resistance + Trend Channel.
Tự động vẽ vùng hỗ trợ/kháng cự theo volume mạnh/yếu, label (Distribution, No Demand, Absorption, Exhaustion) và kênh xu hướng.
Cách dùng:
Uptrend: ưu tiên mua ở gần cạnh dưới kênh hoặc vùng hỗ trợ.
Downtrend: ưu tiên bán/short ở gần cạnh trên kênh hoặc vùng kháng cự.
Sideway: đánh range – mua gần support, bán gần resistance, cẩn thận false break.
P… = vùng giá cao → nhìn kiếm setup chốt lời / short / tránh FOMO.
L… = vùng giá thấp → nhìn kiếm setup bắt nhịp hồi / entry buy an toàn hơn.

DANCE WITH WOLVES VN ALL TO 1DANCE WITH WOLVES VN is a smart-money volume indicator designed for stocks and crypto.
Main features:
• logic to detect Distribution, No Demand, Absorption and Exhaustion.
• Automatically builds smart Support/Resistance zones from high-volume price leaders.
• Regression trend channel to see the short-term trend and trading range.
• Dashboard table that shows the top high/low price bars with buy/sell volume and group labels.
• Alert conditions for Breakout above resistance and At Support Area so you don’t need to watch the chart all the time.
You can use it on any symbol and timeframe. Just add the script to your chart and follow the zones (red = resistance, green = support) together with the P/L labels and the status line.
Vietnamese note: Indicator dùng volume + để vẽ vùng hỗ trợ/kháng cự thông minh, label phân phối / hấp thụ / cạn lực bán và kênh xu hướng. Dùng được cho cả stock và crypto. tot nhat dung khung 5 den 15 phut

Byrd Combo Indicator v2.5Simplify your trading with the Byrd Combo Indicator — a professional, all-in-one trading tool designed to identify high-probability bullish and bearish patterns across multiple timeframes. Whether you’re a position trader, swing trader, or intraday trader, this indicator automatically analyzes trend strength, momentum, and volume to deliver clear, actionable signals — no complex calculations required.
Key Features:
Detects strong bullish and bearish candlestick patterns automatically.
Works on multiple timeframes: from intraday charts to weekly charts.
Includes dynamic signal labeling and optional signal bars for easy visualization.
Filters out weak setups using advanced trend and volume analysis (fully automated).
Customizable settings for personal trading preferences.
The Byrd Combo Indicator v2.5 is perfect for traders who want a simple, actionable, and reliable tool to guide entries, exits, and overall trade management.

Zone Levels (Range + ZoneHeight)This is a Template for drawing out zones from one ankerpoint zone.Just mark out the distance from one leveledge to the next and it will give you infinte more zoneedges in the same distance. You can also adjust the zone height if wanted (i used 10 as example).
I hope youll enjoy it
AJ
