ATR Bands with Optional Risk/Reward Colors█ OVERVIEW
This indicator projects ATR bands and, optionally, colors them based on a risk/reward advantage for those who trade breakouts/breakdowns using moving averages as partial or full exit points.
█ DEFINITIONS
► True Range
The True Range is a measure of the volatility of a financial asset and is defined as the maximum difference among one of the following values:
- The high of the current period minus the low of the current period.
- The absolute value of the high of the current period minus the closing price of the previous period.
- The absolute value of the low of the current period minus the closing price of the previous period.
► Average True Range
The Average True Range was developed by J. Welles Wilder Jr. and was introduced in his 1978 book titled "New Concepts in Technical Trading Systems". It is calculated as an average of the true range values over a certain number of periods (usually 14) and is commonly used to measure volatility and set stop-loss and profit targets (1).
For example, if you are looking at a daily chart and you want to calculate the 14-day ATR, you would take the True Range of the previous 14 days, calculate their average, and this would be the ATR for that day. The process is then repeated every day to obtain a series of ATR values over time.
The ATR can be smoothed using different methods, such as the Simple Moving Average (SMA), the Exponential Moving Average (EMA), or others, depending on the user's preferences or analysis needs.
► ATR Bands
The ATR bands are created by adding or subtracting the ATR from a reference point (usually the closing price). This process generates bands around the central point that expand and contract based on market volatility, allowing traders to assess dynamic support and resistance levels and to adapt their trading strategies to current market conditions.
█ INDICATOR
► ATR Bands
The indicator provides all the essential parameters for calculating the ATR: period length, time frame, smoothing method, and multiplier.
It is then possible to choose the reference point from which to create the bands. The most commonly used reference points are Open, High, Low, and Close, but you can also choose the commonly used candle averages: HL2, HLC3, HLCC4, OHLC4. Among these, there is also a less common "OC2", which represents the average of the candle body. Additionally, two parameters have been specifically created for this indicator: Open/Close and High/Low.
With the "Open/Close" parameter, the upper band is calculated from the higher value between Open and Close, while the lower one is calculated from the lower value between Open and Close. In the case of bullish candles, therefore, the Close value is taken as the starting point for the upper band and the Open value for the lower one; conversely, in bearish candles, the Open value is used for the upper band and the Close value for the lower band. This setting can be useful for precautionally generating broader bands when trading with candlesticks like hammers or inverted hammers.
The "High/Low" parameter calculates the upper band starting from the High and the lower band starting from the Low. Among all the available options, this one allows drawing the widest bands.
Other possible options to improve the drawing of ATR bands, aligning them with the price action, are:
• Doji Smoothing: When the current candle is a doji (having the same Open and Close price), the bands assume the values they had on the previous candle. This can be useful to avoid steep fluctuations of the bands themselves.
• Extend to High/Low: Extends the bands to the High or Low values when they exceed the value of the band.
• Round Last Cent: Expands the upper band by one cent if the price ends with x.x9, and the lower band if the price ends with x.x1. This function only works when the asset's tick is 0.01.
► Risk/Reward Advantage
The indicator optionally colors the ATR bands after setting a breakpoint, one or two risk/reward ratios, and a series of moving averages. This function allows you to know in advance whether entering a trade can provide an advantage over the risk. The band is colored when the ratio between the distance from the break point to the band and the distance from the break point to the first available moving average reaches at least the set ratio value. It is possible to set two colorings, one for a minimum risk/reward ratio and one for an optimal risk/reward ratio.
The break point can be chosen between High/Low (High in case of breakout, Low in case of breakdown) or Open/Close (on breakouts, Close with bullish candles or Open with bearish candles; on breakdowns, Close with bearish candles or Open with bullish candles).
It is possible to choose up to 10 moving averages of various types, including the VWAP with the Anchor Period (2).
Depending on the "Price to MA" setting, the bands can be individually or simultaneously colored.
By selecting "Single Direction," the risk/reward calculation is performed only when all moving averages are above or below the break point, resulting in only one band being colored at a time. For this reason, when the break point is in between the moving averages, the calculation is not executed. This setting can be useful for strategies involving price movement from a level towards a series of specific moving averages (for example, in reversals starting from a certain level towards the VWAP with possible partial take profits on some previous moving averages, or simply in trend following towards one or more moving averages).
Choosing "Both Directions" the risk/reward ratio is calculated based on the first available moving averages both above and below the price. This setting is useful for those who operate in range bound markets or simply take advantage of movements between moving averages.
█ NOTE
This script may not be suitable for scalping strategies that require immediate entries due to the inability to know the ATR of a candle in advance until its closure. Once the candle is closed, you should have time to place a stop or stop-limit order, so your strategy should not anticipate an immediate start with the next candle. Even more conveniently, if your strategy involves an entry on a pullback, you can place a limit order at the breakout level.
(1) www.tradingview.com
(2) For convenience, the code for the Anchor Period has been entirely copied from the VWAP code provided by TradingView.
Volatilite Durdurması

Turtle Trader StrategyTurtle Trader Strategy :
Introduction :
This strategy is based on the well known « Turtle Trader Strategy », that has proven itself over the years. It sends long and short signals with pyramid orders of up to 5, meaning that the strategy can trigger up to 5 orders in the same direction. Good risk and money management.
It's important to note that the strategy combines 2 systems working together (S1 and S2). Let’s describe the specific features of this strategy.
1/ Position size :
Position size is very important for turtle traders to manage risk properly. This position sizing strategy adapts to market volatility and to account (gains and losses). It’s based on ATR (Average True Range) which can also be called « N ». Its length is per default 20.
ATR(20) = (previous_atr(20)*19 + actual_true_range)/20
The number of units to buy is :
Unit = 1% * account/(ATR(20)*dollar_per_point)
where account is the actual account value and dollar_per_point is the variation in dollar of the asset with a 1 point move.
Depending on your risk aversion, you can increase the percentage of your account, but turtle traders default to 1%. If you trade contracts, units must be rounded down by default.
There is also an additional rule to reduce the risk if the value of the account falls below the initial capital : in this case and only in this case, account in the unit formula must be replace by :
account = actual_account*actual_account/initial capital
2/ Open a position :
2 systems are working together :
System 1 : Entering a new 20 day breakout
System 2 : Entering a new 55 day breakout
A breakout is a new high or new low. If it’s a new high, we open long position and vice versa if it’s a new low we enter in short position.
We add an additional rule :
System 1 : Breakout is ignored if last long/short position was a winner
System 2 : All signals are taken
This additional rule allows the trader to be in the major trends if the system 1 signal has been skipped. If a signal for system 1 has been skipped, and next candle is also a new 20 day breakout, S1 doesn’t give a signal. We have to wait S2 signal or wait for a candle that doesn’t make a new breakout to reactivate S1.
3/ Pyramid orders :
Turtle Strategy allows us to add extra units to the position if the price moves in our favor. I've configured the strategy to allow up to 5 orders to be added in the same direction. So if the price varies from 0.5*ATR(20) , we add units with the position size formula. Note that the value of account will be replaced by "remaining_account", i.e. the cash remaining in our account after subtracting the value of open positions.
4/ Stop Loss :
We set a stop loss at 1.5*ATR(20) below the entry price for longs and above the entry price for shorts. If pyramid units are added, the stop is increased/decreased by 0.5*ATR(20). Note that if SL is configured for a loss of more than 10%, we set the SL to 10% for the first entry order to avoid big losses. This configuration does not work for pyramid orders as SL moves by 0.5*ATR(20).
5/ Exit signals :
System 1 :
Exit long on a 10 day low
Exit short on a 10 day high
System 2 :
Exit long on a 20 day low
Exit short on a 20 day high
6/ What types of orders are placed ?
To enter in a position, stop orders are placed meaning that we place orders that will be automatically triggered by the signal at the exact breakout price. Stop loss and exit signals are also stop orders. Pyramid orders are market orders which will be triggered at the opening of the next candle to avoid repainting.
PARAMETERS :
Risk % of capital : Percentage used in the position size formula. Default is 1%
ATR period : ATR length used to calculate ATR. Default is 20
Stop ATR : Parameters used to fix stop loss. Default is 1.5 meaning that stop loss will be set at : buy_price - 1.5*ATR(20) for long and buy_price + 1.5*ATR(20) for short. Turtle traders default is 2 but 1.5 is better for cryptocurrency as there is a huge volatility.
S1 Long : System 1 breakout length for long. Default is 20
S2 Long : System 2 breakout length for long. Default is 55
S1 Long Exit : System 1 breakout length to exit long. Default is 10
S2 Long Exit : System 2 breakout length to exit long. Default is 20
S1 Short : System 1 breakout length for short. Default is 15
S2 Short : System 2 breakout length for short. Default is 55
S1 Short Exit : System 1 breakout length to exit short. Default is 7
S2 Short Exit : System 2 breakout length to exit short. Default is 20
Initial capital : $1000
Fees : Interactive Broker fees apply to this strategy. They are set at 0.18% of the trade value.
Slippage : 3 ticks or $0.03 per trade. Corresponds to the latency time between the moment the signal is received and the moment the order is executed by the broker.
Pyramiding : Number of orders that can be passed in the same direction. Default is 5.
Important : Turtle traders don't trade crypto. For this specific asset type, I modify some parameters such as SL and Short S1 in order to maximize return while limiting drawdown. This strategy is the most optimal on BINANCE:BTCUSD in 1D timeframe with the parameters set per default. If you want to use this strategy for a different crypto please adapt parameters.
NOTE :
It's important to note that the first entry order (long or short) will be the largest. Subsequent pyramid orders will have fewer units than the first order. We've set a maximum SL for the first order of 10%, meaning that you won't lose more than 10% of the value of your first order. However, it is possible to lose more on your pyramid orders, as the SL is increased/decreased by 0.5*ATR(20), which does not secure a loss of more than 10% on your pyramid orders. The risk remains well managed because the value of these orders is less than the value of the first order. Remain vigilant to this small detail and adjust your risk according to your risk aversion.
Enjoy the strategy and don’t forget to take the trade :)

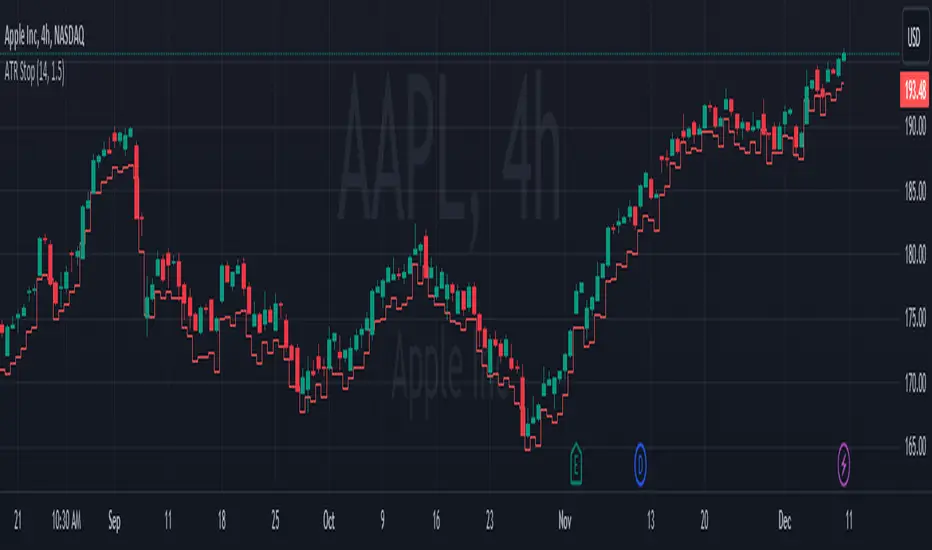
ATR StopThe "ATR Stop" indicator is designed to provide traders with insights into potential stop levels based on Average True Range (ATR) calculations specifically tailored for profitable (green candles) and unprofitable (red candles) price movements. This tool aims to assist traders in identifying potential stop levels that adjust dynamically based on the volatility of distinct market conditions.
The indicator functions by calculating two types of ATR: one for profitable movements and the other for unprofitable movements. The Average True Range is calculated separately for green and red candles, allowing users to assess potential stop levels more accurately based on the nature of price movements.
Key features of the "ATR Stop" indicator include:
Custom ATR Calculation: It calculates the ATR for profitable (green) and unprofitable (red) movements separately, considering only specific candle types based on their closing price relative to their opening price.
Dynamic Multiplier: Users can adjust the multiplier to fine-tune the sensitivity of the ATR-based stop levels, accommodating different risk preferences and market conditions.
Clear Visualization: The indicator plots the ATR levels for profitable (green) and unprofitable (red) movements one candle ahead on the chart, providing a visual representation of potential stop levels.
To use the indicator effectively, traders can adjust the ATR length and multiplier parameters based on their trading strategies and risk management preferences. By considering distinct price movements, this tool can assist in setting more informed stop levels in varying market conditions.
Please note that while the "ATR Stop" indicator can be a valuable addition to a trader's toolbox, it should be used in conjunction with other technical analysis tools and risk management strategies to make well-informed trading decisions.
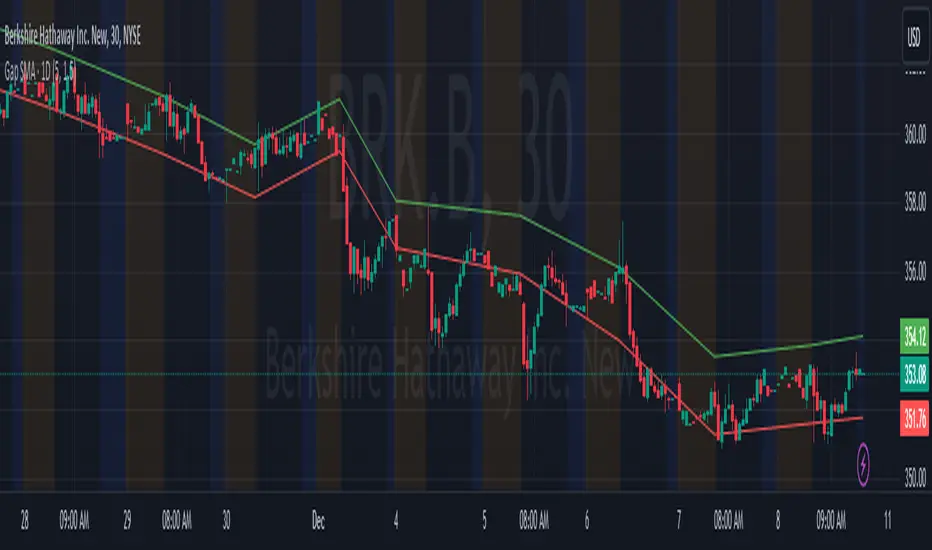
Gap SMAGap SMA Indicator - Analyzing Price Gaps with Moving Averages
Description:
The Gap SMA (Simple Moving Average) indicator is a powerful tool designed to analyze price gaps, a phenomenon occurring when the market opens significantly higher or lower than the previous session's close. These gaps often signify abrupt shifts in market sentiment, driven by fundamental news, earnings reports, or overnight geopolitical events.
This indicator calculates and visualizes the average gap-up and gap-down based on historical data, aiding traders in identifying potential support or resistance levels driven by gap behavior.
What is a Gap?
In financial markets, a gap occurs when there is a notable difference (upward or downward) between the previous session's close and the current session's open. Gaps can be categorized as gap-ups (when the current open is higher than the previous close) or gap-downs (when the current open is lower than the previous close).
Key Features:
User-Defined Parameters: Adjust the number of gaps considered and a multiplier factor for precise customization.
Average Gap Visualization: Plotting lines representing the moving average of gap-ups and gap-downs.
Alert System: Alerts notify traders when the close price crosses above/below the average gap lines, offering potential entry or exit signals.
This tool is particularly useful for swing traders and investors interested in understanding historical gap patterns and integrating this information into their decision-making process. It can assist in determining potential stop-loss levels, defining entry or exit points, and gauging market sentiment based on gap behavior.
Feel free to experiment with various settings and timeframes to suit your trading strategy and risk tolerance. Your feedback and suggestions for further enhancements are highly appreciated!
Candle Pivot and Stop LossThe script plot upside and down side stop loss using pivot point and trure range.
The True Range, representing market volatility, is determined by finding the maximum value among the differences between the previous high-low, high-close, and low-close. The Downside Stop Loss is calculated by adding the True Range to the Pivot Point, while the Upside Stop Loss is calculated by subtracting the True Range from the Pivot Point.
These levels are plotted on the chart in blue (Pivot Point), red (Downside Stop Loss), and green (Upside Stop Loss), providing traders with essential reference points for their trading strategies.
The provided Pine Script calculates key trading levels for the current candle, including the Pivot Point, Downside Stop Loss, and Upside Stop Loss. The Pivot Point is computed as the average of the previous candle's high, low, and close prices.

Breaks and Retests with Volatility Stop [HG]The "Breaks and Retests with Volatility Stop " indicator is a powerful tool designed to assist traders in identifying key support and resistance levels, breakouts, retests, and potential trend reversals. This indicator combines two essential components: support and resistance detection, and a Volatility Stop indicator for improved risk management. Below are the key features of this indicator:
**Support and Resistance Detection:**
- **Lookback Range:** Users can customize the lookback range, determining how many bars are considered when identifying support and resistance levels. This allows for flexibility in capturing short-term or longer-term levels.
- **Bars Since Breakout:** The indicator helps traders spot retests by allowing them to specify the number of bars that should occur since a breakout before considering it a potential retest.
- **Retest Detection Limiter:** Traders can set a limit on how many bars should be actively checked during a potential retest event. This feature prevents retest alerts from occurring too late, ensuring more accurate results.
- **Breakouts and Retests:** Users can choose to display or hide breakout and retest events separately, tailoring the indicator to their specific trading strategy.
- **Repainting Options:** The indicator offers three repainting options: "On," "Off: Candle Confirmation," and "Off: High & Low." This provides flexibility in choosing the repainting behavior that suits your trading style.
**Styling Options:**
- **Outline and Extend:** Traders can customize the appearance of support and resistance boxes by selecting outline styles and extension preferences.
- **Label Types and Sizes:** The indicator offers two label types, "Full" and "Simple," allowing traders to choose the level of detail displayed on the chart. Additionally, users can adjust the label size for better visibility.
- **Customizable Colors:** Support and resistance levels can be color-coded to match your preferred charting style, enhancing visibility and clarity.
- **Override Text Color:** If desired, traders can override the text color for labels, providing further customization of the indicator's appearance.
**Alerts and Notifications:**
- The indicator generates various alerts and notifications to keep traders informed about critical market events, including:
- New Support and Resistance Levels
- Support and Resistance Breakouts
- Support and Resistance Retests
- Potential Support and Resistance Retests
**Volatility Stop Indicator:**
- The "Breaks and Retests with Volatility Stop " indicator also includes a Volatility Stop component, which helps traders manage risk by indicating potential stop-loss levels based on market volatility. The Volatility Stop is color-coded to reflect the current trend direction, making it easy to identify potential trend reversals.
In summary, this TradingView indicator is a comprehensive tool designed to enhance your technical analysis and trading decisions. It provides support and resistance levels, breakout and retest alerts, and incorporates a Volatility Stop indicator for risk management, making it a valuable addition to any trader's toolkit.

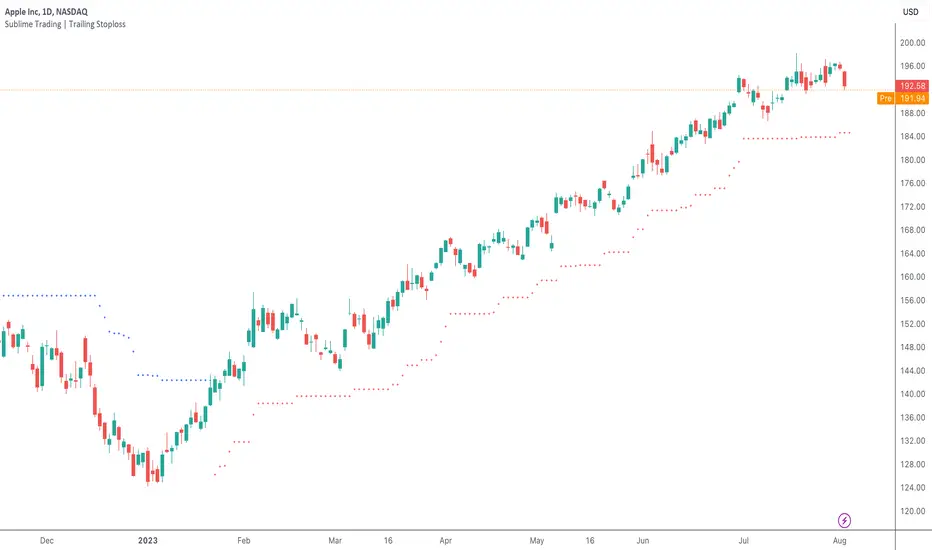
Sublime Trading | Trailing StoplossWhat kind of traders/investors are we?
We are trend followers. Our scripts are designed to be used on the higher timeframes (weekly/daily) to catch the large moves/trends in the market.
Most have heard of long-term trend following. Few know how to execute the strategy.
Our scripts are designed specifically to identify and invest in long-term market trends.
What does this script do?
The exit from a position is arguably more important than the entry.
Traders/Investors will regularly find themselves in an asset based on some logic, but the exit management is very much an afterthought.
Hence why traders often take profit too early and hold onto losing positions. It is emotionally driven.
The Trailing Stoploss script is designed to remove the guesswork and show you precise levels you will want to consider exiting a position when an asset reverses.
How is the trailing stoploss produced?
The script uses the formula ATR 15 x 4.
We use ATR as it produces a stoploss which is unique to the volatility of the asset. The more volatile the asset, the wider the stoploss.
We use ATR 15 as it brings an average reading across half a month, incorporating days of extreme volatility.
The multiplier 4 works well to avoid positions being stopped out prematurely on pullbacks.
When the trailing stoploss is hit, this is where you will want to consider taking profit.
What is the best timeframe to use the script?
We recommend the daily timeframe as this is where trend followers enter assets to maximise the potential of long-term trends.
The higher timeframes are where traders and investors take fewer positions and hold for longer time periods.
The trailing stoploss follows the price of the asset a distance away to give the trend structure enough space and time to develop.
A trend is ultimately a function of time. If you eliminate time, you eliminate the trend. If you eliminate the trend, you eliminate profit.
The Trailing Stoploss script is necessary for investors who appreciate that profit is accumulated by letting winning positions run and not taking profit too early.
What makes this script unique?
Exit management and knowing when to let go of an asset is one of the main struggles budding investors face. This script has been coded specifically for the daily timeframe to:
Create a trailing stoploss that is unique to the volatility of the asset.
Allow investors to stay in positions for the duration of the trend over many months.
To distinguish between a pullback and a market reversal, allowing for discretion.
This TSL script is designed to manage positions investors take in line with long-term market trends.
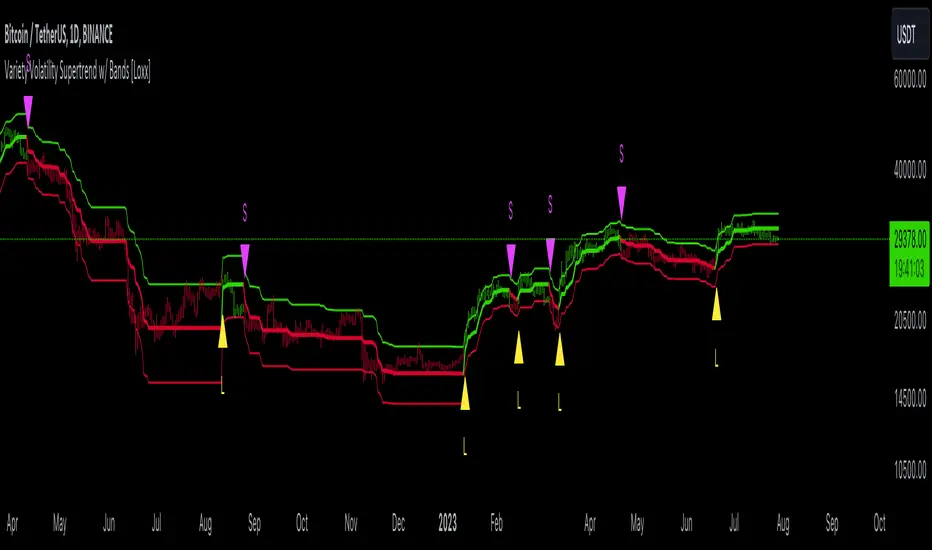
Variety Volatility Supertrend w/ Bands [Loxx]Variety Volatility Supertrend w/ Bands indicator is a powerful and highly customizable tool for traders. Building upon the foundational concept of the classic Supertrend indicator, this variant adds a plethora of user-driven options and features that can cater to diverse trading styles and market scenarios.
The Supertrend indicator is traditionally used to identify market trends by overlaying a line on the price chart, which changes color and position in relation to the price based on the trend direction. The Variety Volatility Supertrend w/ Bands takes this a step further by offering various volatility calculations, visual enhancements, explicit trading signals, and alert conditions.
It provides five options for volatility calculations, enabling users to select the most suitable measure for their strategy. This indicator also allows users to control the display of the upper, lower, and mid bands, which can serve as dynamic support and resistance levels. Further, it can display explicit trading signals when the trend changes direction and set up alerts for these signals.
█ User Inputs
Source: Defines the source of the price data, typically the closing price.
Period: Defines the lookback period for the chosen volatility calculation.
Mid Price Period: Defines the number of periods for calculating the mid-price.
Multiplier: The factor by which the volatility measure (e.g., ATR) is multiplied.
Volatility Type: The user can choose one of five different calculations for the volatility measure: ATR, Standard Error, Standard Deviation, Custom Standard Deviation with Sample Correction, and Custom Standard Deviation without Sample Correction.
Classic Supertrend: Enables the classic version of the Supertrend indicator if set to true.
Show Upper Band, Show Lower Band, Show Mid: Determines whether the upper, lower, and middle bands of the Supertrend indicator are displayed.
Outer Line Width, Mid Line Width: Controls the line widths of the outer and middle lines.
Color Bars: Colors the price bars based on the direction of the trend if enabled.
Show signals: Displays trading signals on the chart if enabled.
Bull Color, Bear Color: Controls the colors of the Supertrend indicator during bullish and bearish market conditions.
█ Computations
The script begins by calculating the chosen volatility measure (ATR, Standard Error, Standard Deviation, etc.) and the mid-price, which is the average of the highest and lowest prices over the specified Mid Price Period. It then calculates the upper and lower bands by adding and subtracting the product of the Multiplier and the volatility measure from the mid-price.
The script then compares the current price with the previous upper and lower bands to determine the trend direction. If the current price is greater than the previous upper band, the trend is considered bullish. If it's less than the previous lower band, the trend is bearish.
█ Visualizations
The script plots the upper, lower, and mid bands on the chart based on the user's settings. If Color Bars is enabled, the script colors the price bars based on the trend direction. If Show signals is enabled, the script displays shapes on the chart to represent trading signals when the trend changes direction.
█ Alerts
Finally, the script sets up alert conditions for long and short trading signals. When these conditions are met, TradingView sends an alert to the user with a message indicating the indicator's name, the type of signal (long or short), and the symbol and closing price of the asset.
█ Visualization Modes
Classic Supertrend
The Classic Supertrend mode essentially transforms the "Variety Volatility Supertrend w/ Bands " indicator to behave more like the traditional Supertrend indicator.
In the traditional Supertrend indicator, there is a single line that shifts positions based on the trend direction. When the market is in an uptrend, the Supertrend line is plotted below the price, acting as a dynamic support level. Conversely, when the market is in a downtrend, the Supertrend line moves above the price, acting as a dynamic resistance level.
When you set Classic Supertrend to True in this script, it mimics this behavior. It will only display one line (the Supertrend line) instead of the upper and lower bands. The Supertrend line will switch between the calculated upper band and lower band based on the trend direction:
In an uptrend, it plots the lower band as the Supertrend line (acting as a dynamic support level).
In a downtrend, it plots the upper band as the Supertrend line (acting as a dynamic resistance level).
Thus, when Classic Supertrend is True, the display is similar to the regular Supertrend indicator, offering a more simplified, less cluttered view of the price trend.
See here for the Classic Supertrend
Supertrend Moving Average with Bands
When the Classic Supertrend option is turned off in the "Variety Volatility Supertrend w/ Bands " indicator, the indicator displays upper and lower bands along with the midline, depending on the user's settings. These bands can serve as dynamic support and resistance levels, and they move and adjust based on the market's volatility.
Support and resistance are key concepts in technical analysis. Support is a price level where the price tends to find a floor as it falls, indicating a greater amount of demand or buying interest that can prop up the prices. Resistance, on the other hand, is a price level where rising prices tend to stop rising, indicating a greater amount of supply or selling interest.
In the context of the "Variety Volatility Supertrend w/ Bands " indicator:
Upper Band: This can act as a dynamic resistance level in a downtrend. When prices are falling, they might struggle to rise above this band. If prices do break above the upper band, it could be a sign that the downtrend is reversing, and a new uptrend may be beginning.
Lower Band: Conversely, this can act as a dynamic support level in an uptrend. When prices are rising, they might bounce off this band and continue to rise. If prices break below the lower band, it could indicate that the uptrend is reversing, and a new downtrend may be beginning.
The benefit of these dynamic support and resistance levels is that they adjust automatically as market conditions change, potentially offering more relevant insights into price behavior compared to static support and resistance levels.
See here for the Supertrend Moving Average with Bands
█ Volatility Types
The "Variety Volatility Supertrend w/ Bands " indicator provides five options for the volatility calculation. Volatility is a statistical measure of the dispersion of returns for a given security or market index. In most cases, the higher the volatility, the riskier the security. Here's a quick summary of each option:
Average True Range (ATR): This is a common volatility measure in the world of trading, particularly for commodities and forex markets. It measures the average of true price ranges over a specified period. The true range considers the most recent period's high-low range, the previous close to the most recent high, and the previous close to the most recent low, taking the highest value.
Standard Error: This is a measure of the accuracy of predictions made with statistical techniques. In the context of trading, the standard error can give traders an idea of the quality of their volatility or price level estimates. It's calculated using the standard deviation of the price data, the square root of the number of data points.
Standard Deviation: This is a measure of the dispersion of a set of data from its mean. It's a commonly used volatility measure in finance. In trading, a higher standard deviation suggests greater price volatility.
Custom Standard Deviation - with Sample Correction: This is a variation of the standard deviation calculation, but it applies a correction for small sample sizes. It's calculated similarly to the standard deviation, but the sum of the squares is divided by (n-1) instead of n to provide a more accurate estimate when working with a small number of data points.
Custom Standard Deviation - without Sample Correction: This is another variation of the standard deviation calculation, but without the sample correction. This might be used when the number of data points is sufficiently large that the correction is not necessary.
The choice of volatility measure can have a significant impact on the sensitivity of the Supertrend indicator. Some measures may result in wider bands and fewer trend changes, while others may produce narrower bands and more frequent trend changes. The choice of volatility measure should align with the trader's strategy and risk tolerance.
█ Multiple Timeframe options
The "Variety Volatility Supertrend w/ Bands " indicator, like most indicators on the TradingView platform, can be applied to various timeframes, regardless of the chart's current timeframe. The timeframe of an indicator is determined by the timeframe of the price data it processes.
This indicator's flexibility with timeframes allows it to be used in different trading strategies. Day traders might use shorter timeframes like 1-minute or 15-minute charts, swing traders might use 1-hour or 4-hour charts, and long-term investors might use daily or weekly charts.
See here for the Supertrend Moving Average with Bands on 4-hour chart using Daily data
BTFD strategy [3min]Hello
I would like to introduce a very simple strategy to buy lows and sell with minimal profit
This strategy works very well in the markets when there is no clear trend and in other words, the trend going sideways
this strategy works very well for stable financial markets like spx500, nasdaq100 and dow jones 30
two indicators were used to determine the best time to enter the market:
volume + rsi values
volume is usually the number of stocks or contracts traded over a certain period of time. Thus, it is an important indicator of market activity and liquidity. Each transaction constitutes an individual exchange between the buyer and the seller and constitutes the trading volume of a given instrument or asset.
The RSI measures the strength of uptrends versus downtrends. The signal is the entry or exit of the indicator value of the oversold or overbought level of the market. It is assumed that a value below or equal 30 indicates an oversold level of the market, and an RSI value above or equal 70 indicates an overbought level.
the strategy uses a maximum of 5 market entries after each candle that meets the condition
uses 5 target point levels to close the position:
tp1= 0.4%
tp2= 0.6%
tp3= 0.8%
tp4= 1.0%
tp5= 1.2%
after reaching a given profit value, a piece of the position is cut off gradually, where tp5 closes 100% of the remaining position
each time you enter a position, a stop loss of 5.0% is set, which is quite a high value, however, when buying each, sometimes very active downward price movement, you need a lot of space for market decisions in which direction it wants to go
to determine the level of stop loss and target point I used a piece of code by RafaelZioni , here is the script from which a piece of code was taken
this strategy is used for automation, however, I would recommend brokers that have the lowest commission values when opening and closing positions, because the strategy generates very high commission costs
Enjoy and trade safe ;)

Trailing Stop Loss SuperTrendThe Trailing Stop Loss SuperTrend indicator is a popular technical analysis tool used by traders to identify trends and determine optimal entry and exit points in financial markets. This indicator combines elements of the SuperTrend indicator and trailing stop loss orders to provide valuable insights into market trends and potential reversals. By incorporating Average True Range (ATR) calculations, it adapts to market volatility, making it suitable for various trading strategies. Let's explore the key use cases and benefits of the Trailing Stop Loss SuperTrend indicator:
Trend Identification:
The primary purpose of the Trailing Stop Loss SuperTrend indicator is to identify market trends. It plots two lines on the chart: an upper band (referred to as the "up" line) and a lower band (referred to as the "dn" line). The direction of these bands helps traders determine the prevailing trend. When the price is above the upper band, it suggests a bullish trend, and when it is below the lower band, it indicates a bearish trend.
Entry and Exit Signals:
The Trailing Stop Loss SuperTrend indicator generates entry and exit signals based on trend changes. When the trend changes from bearish to bullish, a buy signal is triggered, indicating a potential entry point. Conversely, when the trend changes from bullish to bearish, a sell signal is generated, suggesting a possible exit or short-selling opportunity. These signals can be used in conjunction with other trading strategies or indicators to enhance trading decisions.
Trailing Stop Loss Orders:
One of the distinguishing features of the Trailing Stop Loss SuperTrend indicator is its ability to incorporate trailing stop loss orders. Traders can use the indicator's upper and lower bands as trailing stop levels to protect profits and manage risk. For example, in a bullish trend, the stop loss level can be set at the lower band, and as the price rises, the stop loss level trails along with it, locking in profits and reducing potential losses.
Volatility Adaptation:
By incorporating the ATR (Average True Range) calculation, the Trailing Stop Loss SuperTrend indicator adjusts its sensitivity to market volatility. A higher ATR multiplier widens the distance between the price and the bands, accommodating higher volatility, while a lower multiplier tightens the bands during periods of lower volatility. This adaptability makes the indicator versatile and suitable for various market conditions.
Alerts and Notifications:
The Trailing Stop Loss SuperTrend indicator provides the ability to set alerts for specific events, such as trend changes, buy signals, and sell signals. Traders can receive real-time notifications via email, SMS, or on-platform alerts, ensuring they stay informed about potential trading opportunities and important market developments.
Conclusion:
The Trailing Stop Loss SuperTrend indicator is a valuable tool for traders seeking to identify trends, generate entry and exit signals, and effectively manage risk. Its ability to adapt to market volatility and incorporate trailing stop loss orders enhances trading strategies and decision-making. By combining the SuperTrend concept with trailing stop loss functionality, this indicator provides traders with a comprehensive approach to trend analysis and risk management. Whether used in isolation or in conjunction with other indicators, the Trailing Stop Loss SuperTrend indicator offers a powerful tool for navigating the dynamic world of financial markets.

Spinn: SuperStopAdaptive Trailing Stop-Loss Indicator
This indicator will be beneficial for traders who have already opened a position and are looking to maximize their profits but are uncertain about the optimal time to exit. It provides clear and adaptive stop-loss levels based on market data, especially in highly volatile markets. It offers the ability to close trades automatically (through the use of web-hooks).
The algorithm is based on using the Average True Range (ATR) to set stop-loss levels. The scaling factor allows you to adjust the optimal distance from the stop-loss line to the price line.
A unique feature of this indicator is that the user can set the target timeframe (Target TF). This means that instead of just using the current chart's timeframe, you can set a multiplier or choose the target timeframe manually. This offers the ability to analyze volatility across different timeframes, which can be valuable for various trading strategies.
The timeframe multiplier is a highlight of this indicator. When switching the current timeframe, there is no need to manually change the target timeframe - this is very convenient.
The ability for automatic alerts when the price touches or crosses stop-loss levels is included.
--
Индикатор адаптивных плавающих Стоп-лоссов
Индикатор будет полезен для трейдеров, которые уже открыли сделку и хотят максимизировать свою прибыль, но не уверены в оптимальном моменте для выхода. Он предоставляет четкие и адаптивные уровни стоп-лоссов, основанные на рыночных данных, особенно при высокой волатильности. Дает возможность закрывать сделки в автоматическом режиме (через использование веб-хуков).
Алгоритм основан на использовании среднего истинного диапазона (ATR) для определения уровней стоп-лоссов. Коэффициент масштабирования дает возможность настроить оптимальное расстояние от линии стоп-лосса до линии цены.
Особенность индикатора в том, что пользователь может настроить целевой таймфрейм (Target TF). Это значит, что вместо того чтобы просто использовать текущий таймфрейм графика, можно установить множитель или выбрать целевой таймфрейм вручную. Это дает возможность анализировать волатильность на разных временных рамках, что может быть полезно для различных торговых стратегий.
Множитель таймфрейма - это фишка данного индикатора. При переключении текущего таймфрейма не придется вручную менять целевой таймфрейм - это очень удобно.
Предусмотрена возможность автоматических оповещений при касании или пересечении уровней стоп-лоссов.

VolatilityThis script shows three different calculations for volatility.
All three can be used as Stop-Loss...
- Absolute Price Changes
- Maximum Price Fluctuation
- and every one should know Average True Range
The script has a dark and light theme.
And the colors can be changed and each can be deactivated.
On top of that I stumbled over the fact that when MPF crosses over APC
this could result in a significant change in price and could also be used as an entry or exit.
This is also highlighted by default. You can change its background color and you can deactivate it too.
ACP measures volatility over most recent close prices.
This is excellent for comparing volatility.
It includes both frequency and magnitude.
In other words: Sum of differences between second to last close price and last close price as absolute value for 'n' bars.
MPF measures volatility over most recent candles, which could be used as an estimate of risk.
It may also be effective as the basis for a stop-loss or take-profit,
like the ATR but it ignores the frequency of directional changes within the time interval.
In other words: The difference between the highest high and lowest low over 'n' bars.
When you don't know what the ATR is then you can look at this link .

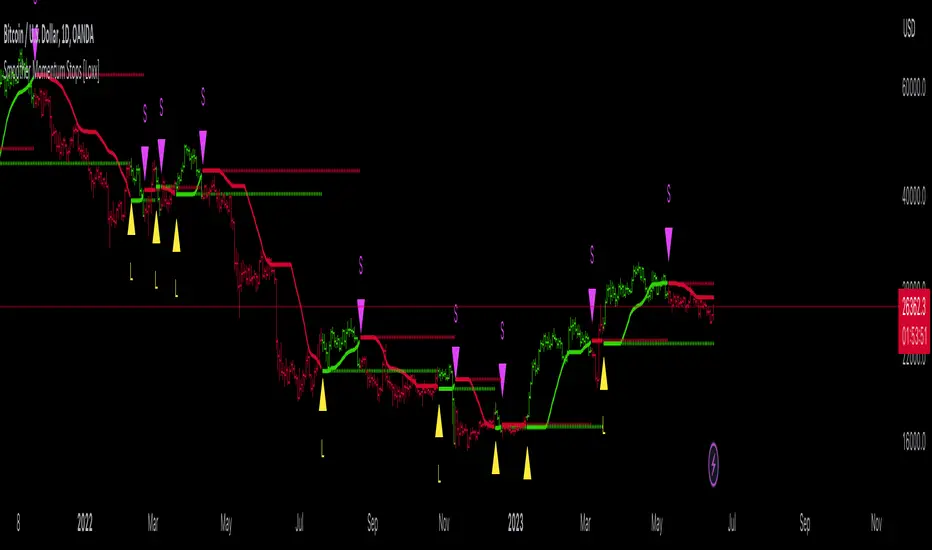
Smoother Momentum Stops [Loxx]Smoother Momentum Stops (SMS) is a dynamic tool that combines the logic of momentum and moving averages to create an overlay of the market price and generate potential trade signals. The original idea for this indicator comes from the beloved and esteemed trading indicator guru Mladen Rakic.
Understanding the Framework
The SMS incorporates various aspects of technical analysis, including momentum calculation, several types of moving averages, and an intelligent stop-and-reverse system that determines when to enter and exit trades.
The indicator initiates by defining the color scheme for visualization, specifically green for bullish trends and red for bearish trends. It further utilizes the 'smmom' and 'fema' functions to calculate smoothed momentum and fast exponential moving averages, respectively. The values computed by these functions are central to the signal generation process.
Momentum Calculation
The 'smmom' function serves to calculate a smoother momentum by taking a source (such as the closing price) and a period as inputs. This function employs a complex algorithm involving exponential moving averages (EMA), wherein two EMAs are calculated with different smoothing factors, and the difference between the two results is returned as the output. This smooth momentum calculation assists in eliminating unnecessary noise from the market and delivers more reliable momentum readings.
Moving Averages Computation
One key feature of the SMS is the ability to select from five different moving average types: Exponential Moving Average (EMA), Fast Exponential Moving Average (FEMA), Linear Weighted Moving Average (LWMA), Simple Moving Average (SMA), and Smoothed Moving Average (SMMA). The 'variant' function assigns the chosen method to the '_avg' variable, which is then used in the trade signal logic.
Trade Signal Generation
SMS employs a complex yet robust mechanism for generating trade signals. A stop-and-reverse system is established, which works on the principle of momentum. If the smoothed momentum is positive, an upper stop is determined and if the momentum is negative, a lower stop is defined.
The process continues by defining long and short entry conditions. The indicator goes long when an upper stop exists, and the previous bar had a lower stop, signifying a shift in momentum. The short entry condition is the opposite: the indicator goes short when a lower stop exists, and the previous bar had an upper stop. Alerts are generated for each of these conditions, helping traders to take timely action.
Visual Representation and UI Options
In terms of visual representation, the indicator plots upper and lower stops, employing green color for upper and red for lower stops. If the option to color bars is chosen, the entire bar is colored green or red, based on whether an upper or lower stop exists. This feature allows traders to visually comprehend market conditions better. Support and reisstance levels are also provided for visual context.
Conclusion
The Smoother Momentum Stops indicator is a potent tool for traders seeking to optimize their trading strategies. It blends the fundamentals of momentum and moving averages, resulting in a robust system that provides clear, reliable, and timely trading signals. By adjusting the smoothing type and period parameters, traders can customize the indicator to fit various market conditions and asset types, thereby adding a layer of flexibility to their trading strategies.
The use of a stop-and-reverse system adds a layer of risk management by offering precise entry and exit points based on momentum shifts. These stops are not just mere levels of entries or exits, but they reflect the undercurrent of the market's momentum, thus providing a dynamic framework to make informed trading decisions.
Additionally, the SMS indicator offers visual simplicity. The color-coded bars and distinct symbols for long and short positions make it easier for traders to interpret the signals and market direction quickly. Combined with the alert system, it ensures that traders never miss an important trading opportunity.
Finally, the power of the SMS indicator lies in its adaptability and comprehensive approach. By providing a selection of moving averages and an intelligent momentum-based system, it encapsulates various aspects of market behavior. As such, it is a useful tool not just for momentum traders, but for any trader who understands the significance of moving averages and momentum in predicting market movements.
In conclusion, the Smoother Momentum Stops indicator stands as an innovative, adaptable, and powerful tool for the modern trader. Its blend of flexibility, dynamic risk management, and straightforward visualization offer a comprehensive solution for traders looking to navigate the complex world of financial markets. With a detailed understanding of its workings as presented in this essay, traders can harness its full potential to optimize their strategies, manage risk, and achieve their trading objectives.
Strat Trail Stop by AlexsOptionsWhat does this script do?
This script plots previous aggregation highs or lows based on the trend of the candles.
Scenario 1 -> Up Trend
If the previous high of a candle is violated the green trail line will trail using the lows of the prior candle. It will continue until a previous low is violated. Once a previous low is violated it will switch to scenario 2
Scenario 2 -> Down Trend
If the previous low of a candle is violated the red trail line will trail using the highs of the prior candle. It will continue until a previous high is violated. Once a previous high is violated it will switch to scenario 1
This indicator has two trails. One is expected to be a lower timeframe the other a higher timeframe.
The higher timeframe has an option to instead use the open of the higher timeframe instead of the trail logic in the scenarios above.
If selected it will plot the open of the designated timeframe, the color will be green if trading above and red if trading below
This script is best used in conjunction with a good understanding of #TheStrat trading strategy. You are then able to create alerts for when your positions fall out of favor.
SuperTrend with Chebyshev FilterModified Super Trend with Chebyshev Filter
The Modified Super Trend is an innovative take on the classic Super Trend indicator. This advanced version incorporates a Chebyshev filter, which significantly enhances its capabilities by reducing false signals and improving overall signal quality. In this post, we'll dive deep into the Modified Super Trend, exploring its history, the benefits of the Chebyshev filter, and how it effectively addresses the challenges associated with smoothing, delay, and noise.
History of the Super Trend
The Super Trend indicator, developed by Olivier Seban, has been a popular tool among traders since its inception. It helps traders identify market trends and potential entry and exit points. The Super Trend uses average true range (ATR) and a multiplier to create a volatility-based trailing stop, providing traders with a dynamic tool that adapts to changing market conditions. However, the original Super Trend has its limitations, such as the tendency to produce false signals during periods of low volatility or sideways trading.
The Chebyshev Filter
The Chebyshev filter is a powerful mathematical tool that makes an excellent addition to the Super Trend indicator. It effectively addresses the issues of smoothing, delay, and noise associated with traditional moving averages. Chebyshev filters are named after Pafnuty Chebyshev, a renowned Russian mathematician who made significant contributions to the field of approximation theory.
The Chebyshev filter is capable of producing smoother, more responsive moving averages without introducing additional lag. This is possible because the filter minimizes the worst-case error between the ideal and the actual frequency response. There are two types of Chebyshev filters: Type I and Type II. Type I Chebyshev filters are designed to have an equiripple response in the passband, while Type II Chebyshev filters have an equiripple response in the stopband. The Modified Super Trend allows users to choose between these two types based on their preferences.
Overcoming the Challenges
The Modified Super Trend addresses several challenges associated with the original Super Trend:
Smoothing: The Chebyshev filter produces a smoother moving average without introducing additional lag. This feature is particularly beneficial during periods of low volatility or sideways trading, as it reduces the number of false signals.
Delay: The Chebyshev filter helps minimize the delay between price action and the generated signal, allowing traders to make timely decisions based on more accurate information.
Noise Reduction: The Chebyshev filter's ability to minimize the worst-case error between the ideal and actual frequency response reduces the impact of noise on the generated signals. This feature is especially useful when using the true range as an offset for the price, as it helps generate more reliable signals within a reasonable time frame.
The Great Replacement
The Modified Super Trend with Chebyshev filter is an excellent replacement for the original Super Trend indicator. It offers significant improvements in terms of signal quality, responsiveness, and accuracy. By incorporating the Chebyshev filter, the Modified Super Trend effectively reduces the number of false signals during low volatility or sideways trading, making it a more reliable tool for identifying market trends and potential entry and exit points.
In-Depth Guide to the Modified Super Trend Settings
The Modified Super Trend with Chebyshev filter offers a wide range of settings that allow traders to fine-tune the indicator to suit their specific trading styles and objectives. In this section, we will discuss each setting in detail, explaining its purpose and how to use it effectively.
Source
The source setting determines the price data used for calculations. The default setting is hl2, which calculates the average of the high and low prices. You can choose other price data sources such as close, open, or ohlc4 (average of open, high, low, and close prices) based on your preference.
Up Color and Down Color
These settings control the color of the trend line when the market is in an uptrend (up_color) and a downtrend (down_color). You can customize these colors to your liking, making it easier to visually identify the current market trend.
Text Color
This setting controls the color of the text displayed on the chart when using labels to indicate trend changes. You can choose any color that contrasts well with your chart background for better readability.
Mean Length
The mean_length setting determines the length (number of bars) used for the Chebyshev moving average calculation. A shorter length will make the moving average more responsive to price changes, while a longer length will produce a smoother moving average. It is crucial to find the right balance between responsiveness and smoothness, as a too-short length may generate false signals, while a too-long length might produce lagging signals. The default value is 64, but you can experiment with different values to find the optimal setting for your trading strategy.
Mean Ripple
The mean_ripple setting influences the Chebyshev filter's ripple effect in the passband (Type I) or stopband (Type II). The ripple effect represents small oscillations in the frequency response, which can impact the moving average's smoothness. The default value is 0.01, but you can experiment with different values to find the best balance between smoothness and responsiveness.
Chebyshev Type: Type I or Type II
The style setting allows you to choose between Type I and Type II Chebyshev filters. Type I filters have an equiripple response in the passband, while Type II filters have an equiripple response in the stopband. Depending on your preference for smoothness and responsiveness, you can choose the type that best fits your trading style.
ATR Style
The atr_style setting determines the method used for calculating the Average True Range (ATR). By default (false), it uses the traditional high-low range. When set to true, it uses the absolute difference between the open and close prices. You can choose the method that works best for your trading strategy and the market you are trading.
ATR Length
The atr_length setting controls the length (number of bars) used for calculating the ATR. Similar to the mean_length, a shorter length will make the ATR more responsive to price changes, while a longer length will produce a smoother ATR. The default value is 64, but you can experiment with different values to find the optimal setting for your trading strategy.
ATR Ripple
The atr_ripple setting, like the mean_ripple, influences the ripple effect of the Chebyshev filter used in the ATR calculation. The default value is 0.05, but you can experiment with different values to find the best balance between smoothness and responsiveness.
Multiplier
The multiplier setting determines the factor by which the ATR is multiplied before being added
Super Trend Logic and Signal Optimization
The Modified Super Trend with Chebyshev filter is designed to minimize false signals and provide a clear indication of market trends. It does so by using a combination of moving averages, Average True Range (ATR), and a multiplier. In this section, we will discuss the Super Trend's logic, its ability to prevent false signals, and the early warning crosses added to the indicator.
Super Trend Logic
The Super Trend's logic is based on a combination of the Chebyshev moving average and ATR. The Chebyshev moving average is a smooth moving average that effectively filters out market noise, while the ATR is a measure of market volatility.
The Super Trend is calculated by adding or subtracting a multiple of the ATR from the Chebyshev moving average. The multiplier is a user-defined value that determines the distance between the trend line and the price action. A larger multiplier results in a wider channel, reducing the likelihood of false signals but potentially missing out on valid trend changes.
Preventing False Signals
The Super Trend is designed to minimize false signals by maintaining its trend direction until a significant change in the market occurs. In a downtrend, the trend line will only decrease in value, and in an uptrend, it will only increase. This helps prevent false signals caused by temporary price fluctuations or market noise.
When the price crosses the trend line, the Super Trend does not immediately change its direction. Instead, it employs a safety logic to ensure that the trend change is genuine. The safety logic checks if the new trend line (calculated using the updated moving average and ATR) is more extreme than the previous one. If it is, the trend line is updated; otherwise, the previous trend line is maintained. This mechanism further reduces the likelihood of false signals by ensuring that the trend line only changes when there is a significant shift in the market.
Early Warning Crosses
To provide traders with additional insight, the Modified Super Trend with Chebyshev filter includes early warning crosses. These crosses are plotted on the chart when the price crosses the trend line without the safety logic. Although these crosses do not necessarily indicate a trend change, they can serve as a valuable heads-up for traders to monitor the market closely and prepare for potential trend reversals.
In conclusion, the Modified Super Trend with Chebyshev filter offers a significant improvement over the original Super Trend indicator. By incorporating the Chebyshev filter, this modified version effectively addresses the challenges of smoothing, delay, and noise reduction while minimizing false signals. The wide range of customizable settings allows traders to tailor the indicator to their specific needs, while the inclusion of early warning crosses provides valuable insight into potential trend reversals.
Ultimately, the Modified Super Trend with Chebyshev filter is an excellent tool for traders looking to enhance their trend identification and decision-making abilities. With its advanced features, this indicator can help traders navigate volatile markets with confidence, making more informed decisions based on accurate, timely information.

[TTI] ATR Trailing Stop Alerts––––HISTORY & CREDITS 🏦
The Trailing Stop Alert is a TradingView indicator developed by TintinTrading, which is designed to help traders manage their positions by updating and alerting them about their trailing stop levels. This tool is a valuable addition to a trader's arsenal, as it automates the process of maintaining trailing stop levels and alerts the user when they are updated or hit.
––––WHAT IT DOES 💡
The Trailing Stop Alert indicator calculates trailing stop levels based on the Average True Range (ATR) of an asset over a specified lookback period. It takes user inputs for trail type (Long or Short), lookback period, ATR length, ATR multiplier, and bar time. The indicator can be applied to any financial instrument and will dynamically update the trailing stop level based on price action. When the trailing stop level is updated or hit, the indicator generates alerts to inform the user of these events.
––––HOW TO USE IT 🔧
1. Add the Trailing Stop Alert indicator to your TradingView chart.
2. Configure the settings according to your preferred parameters:
👉Trail Type: Choose between "Long" or "Short" based on your trading position.
👉Lookback: Set the number of bars to look back for determining the highest high or lowest low.
👉ATR Length: Set the period for calculating the Average True Range.
👉ATR Multiplier: Set the multiplier to adjust the trailing stop distance.
👉Bar Time: Set the time at which the indicator starts updating the trailing stop levels.
3. The indicator will plot the trailing stop level on the chart, and update it as the price action unfolds.
4. When the trailing stop level is updated or hit, you will receive an alert in the form of a message with the new level or a notification that the stop has been hit.
5. Adjust your stop loss orders accordingly based on the trailing stop levels provided by the indicator.
By using the Trailing Stop Alert indicator, you can effectively manage your positions and reduce the risk of giving back profits in a trade.

I11L - Risk Adjusted LeveragingThis trading system, called "I11L - Risk Adjusted Leveraging", is designed to manage trades based on the current market volatility relative to its historical average. The system calculates the target number of open trades based on the ATR (Average True Range) indicator and adjusts the leverage accordingly. The system opens and closes trades using a pyramiding approach, allowing multiple positions to be opened at the same time.
Here's a step-by-step explanation of the system:
1. Calculate the ATR with a 14-day period and normalize it by dividing it by the current closing price.
2. Calculate the 100-day simple moving average (SMA) of the normalized ATR.
3. Calculate the ratio of the normalized ATR to its 100-day SMA.
4. Determine the target leverage based on the inverse of the ratio (2 / ratio).
5. Calculate the target number of open trades by multiplying the target leverage by 5.
6. Plot the target number of open trades and the current number of open trades on the chart.
7. Check if there's an opportunity to buy (if the current number of open trades is less than the target) or close a trade (if the current number of open trades is more than the target plus 1).
8. If there's an opportunity to buy, open a long trade and add the trade's name to the openTrades array.
9. If there's an opportunity to close a trade and there are trades in the openTrades array, close the most recent trade by referencing the array and remove it from the array.
This system aims to capture trends in the market by dynamically adjusting the number of open trades and leverage based on the market's volatility. It uses an array to keep track of open trades, allowing for better control over the opening and closing of individual trades.
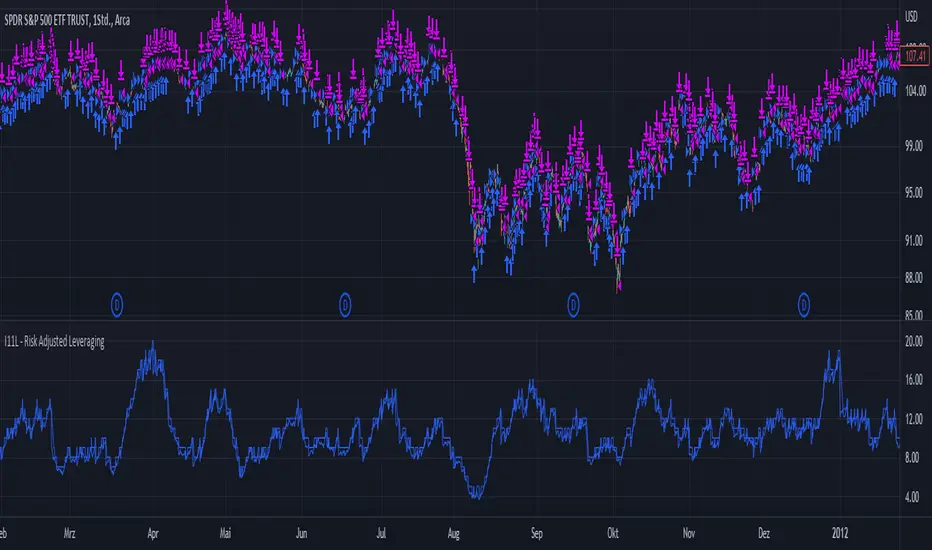
Inter-Exchanges Crypto Price Spread Clouds (Tartigradia)Display variations in min-max and median values of high, low and close across exchanges. It's a kind of realized volatility indicator, as the idea is that in times of high volatility (high emotions, fear, uncertainty), it's more likely that market inefficiencies will appear for the same asset between different market makers, ie, the price can temporarily differ a lot. This indicator will catch these instants of high differences between exchanges, even if they lasted only an instant (because we use high and low values).
Compared with my other "Inter-Exchanges Crypto Price Spread Deviation" indicator, this one overlays directly on the chart, and offers a different take based on the same premisses. Instead of summarizing volatility via standard deviation, here we display clouds of the range of values that were observed.
A big advantage of this approach is that it can also be used to determine safe stop loss levels, especially the values of percentile rank (i.e., what are the high values that were observed in at least 50% of exchanges?).
Indeed, all price levels are displayed in the indicator's status bar:
green for high values,
red for low values,
aqua for median,
purple for average,
The first two values are max and min values of high across exchanges (in green).
The next two values are max and min of low across exchanges (in red).
The next two values are median (aqua) and average (purple).
The last two values are percentile rank values for high (green) and low (red) respectively.
Another advantage is that the high (green) vs low (red) clouds can be seen as representing the buying or selling pressure respectively across exchanges, and this may in itself provide a signal to know whether one side is winning.
Link to my other complementary indicator:
Compared to other inter-exchanges spread indicators, this one offers two major features:
The symbol automatically adapts to the symbol currently selected in user's chart. Hence, switching between tickers does not require the user to modify any option, everything is dynamically updated behind the scenes.
It's easy to add more exchanges (requires some code editing because PineScript v5 does not allow dynamical request.security() calls).
Limitations/things to know:
History is limited to what the ticker itself display. Ie, even if the exchanges specified in this indicator have more data than the ticker currently displayed in the user's chart, the indicator will show only a timeperiod as long as the chart.
The indicator can manage multiple exchanges of different historical length (ie, some exchanges having more data going way earlier in the past than others), in which case they will simply be ignored from calculations when far back in the past. Hence, you should be aware that the further you go in the past, the less exchanges will have such data, and hence the less accurate the measures will be (because the deviation will be calculated from less sources than more recent bars). This is thanks to how the array.* math functions behave in case of na values, they simply skip them from calculations, contrary to math.* functions.

Trail Blaze - (Multi Function Trailing Stop Loss) - [mutantdog]Shorter version:
As the title states, this is a 'Trailing Stop' type indicator, albeit one with a whole bunch of additional functionality, making it far more versatile and customisable than a standard trailing stop.
The main set of features includes:
Three independent trailing types each with their own +/- multipliers:
- Standard % change
- ATR (aka Supertrend)
- IQR (inter-quartile range)
These can be used in isolation or summed together. A subsequent pair of direction specific multipliers are also included.
Two separate custom source inputs are available, both feature the standard options alongside a selection of 'weighted inputs' and the option to use another indicator (selected via 'AUX'):
- 'Centre' determines the value about which the trailing sum will be added to define the stop level.
- 'Trigger' determines the value used for crossing of stops, initiating trend changes and triggering alerts.
A selection of optional filters and moving averages are available for both.
Furthermore there are various useful visualisation options available, including the underlying bands that govern the stop levels. Preset alerts for trend reversals are also included.
This is not really an 'out-of-the-box' indicator. Depending upon the market and timeframe some adjustments will be necessary for it to function in a useful manner, these can be as simple or complex as the feature-set allows. Basic settings are easy to dial in however and the default state is intended as a good starting point. Alternatively with some experimentation, a plethora of unique and creative configurations are possible, making this a great tool for tweaking. Below is a more detailed overview followed by a bunch of simple example settings.
------------------------
Lengthy Version :
DESIGN & CONCEPT
Before we start breaking this down, a little background. This started off as an attempt to improve upon the ever-popular Supertrend indicator. Of course there are many excellent user created variants available utilising some interesting methods to overcome the drawbacks of the basic version. To that end, rather than copying the work of others, the direction here shifted towards a hybrid trailing stop loss with a bunch of additional user customisation options. At some point, a completely different project involving IQR got morphed into this one. After sitting through months of sideways chop (where this proved to be of limited use), at the time of publication the market has began to form some near term trend direction and it appears to be performing well in many different timeframes.
And so with that out of the way...
INPUTS
The standard Supertrend (and most other variants) includes a single source input, as default set to 'hl2' (candle mid-range). This is the centre around which the atr bands are added/subtracted to govern the stop levels. This is not however the value which is used to trigger the trend reversal, that is usually hard-coded to 'close'. For this version both source values are adjustable: labelled 'centre' and 'trigger' respectively.
Each has custom input selectors including the usual options, a selection of 'weighted inputs' and the option to use another indicator (selected from the Aux input). The 'weighted inputs' are those introduced in Weight Gain 4000, for more details please refer to that listing. These should be treated as experimental, however may prove useful in certain configurations. In this case 'hl-oc2' can be considered an estimate of the candle median and may be a good alternative to the default 'centre' setting of 'hl2', in contrast 'cc-ohlc4' can tend to favour the extremes in the trend direction so could be useful as a faster 'trigger' than the default 'close'.
To cap them off both come with a selection of moving average filters (SMA, EMA, WMA, RMA, HMA, VWMA and a simple VWEMA - note: not elastic) aswell as median and mid-range. 'Centre' can also be set to the output of 'trigger' post-filter which can be useful if working with fast/slow crosses as the basis.
DYNAMICS
This is the main section, comprised of three separate factors: 'TSL', 'ATR' and 'IQR'. The first two should be fairly obvious, 'TSL' (trailing stop loss) is simply a percentage of the 'centre' value while 'ATR' (average true range) is the standard RMA-based version as used in Supertrend, Volatility Stop etc.
The third factor is less common however: 'IQR' (inter-quartile range). In case you are unfamiliar the principle here is, for a given dataset, the greatest 25% and smallest 25% of samples are removed. The remainder is then treated as a set and the range is calculated by highest - lowest. This is a commonly used method in statistical analysis, by removing the extremes it is less prone to influence by outliers and gives a good representation of the main dispersion around the median. In practise i have found it can be a good alternative to ATR, translating better across multiple time-frames due to it representing a fraction of the total range rather than an average of per-candle range like ATR. Used in combination with the others it can also add a factor more representative of longer-term/higher-timeframe trend. By discarding outliers it also benefits from not being impacted by brief pumps/volatility, instead responding only to more sustained changes in trend, such as rallies and parabolic moves. In order to give an accurate result the IQR is calculated using a dataset of high, low and hlcc4 values for all bars within the lookback length. Once calculated this value is then halved which, strictly speaking, makes it a semi-interquartile range.
All three of these components can be used individually or summed together to create a hybrid dynamics factor. Furthermore each multiplier can be set to both positive and negative values allowing for some interesting and creative possibilities. An optional smoothing filter can be applied to the sum, this is a basic SWMA-4 which is can reduce the impact of sudden changes but does incur a noticeable lag. Finally, a basic limiter condition has been hard-coded here to prevent the sum total from ever going below zero.
Capping off this section is a pair of direction multipliers. These simply take the prior dynamics sum and allow for further multiplication applied only to one side (uptrend/lo-stop and downtrend/hi-stop). To see why this is useful consider that markets often behave differently in each direction, we've all seen prices steadily climb over several weeks and then abruptly dump in the process of a day or two, shorter time frames are no stranger to this either. A lack of downside liquidity, a panicked market, aggressive shorts. All these things contribute to significant differences in downward price action. This function allows for tighter stops in one direction compared to the other to reflect this imbalance.
VISUALISATIONS
With all of these options and possibilities, some visual aids are useful. Beneath the dynamics' section are several visual options including both sources post-filter and the actual 'bands' created by the dynamics. These are what govern the stop levels and seeing them in full can help to better understand what our various configurations actually do. We can even hide the stop levels altogether and just use the bands, making this a kind of expanded Keltner Channel. Here we can also find colour and opacity settings for everything we've discussed.
EXAMPLES
The obvious first example here is the standard %-change trailing stop loss which, from my experience, tends to be the best suited for lower time frames. Filtering should probably minimal here. In both charts here we use the default config for source inputs, the top is a standard bi-directional setup with 1.5% tsl while the bottom uses a 2.5% tsl with the histop multiplier reduced to 0 resulting in an uptrend only stoploss.
Shown here in grey is the standard Supertrend which uses 'hl2' as centre and 'close' as trigger, ATR(10) multiplied by 3. On top we have the default filtered source config with ATR(8) multiplied by 2 which gives a different yet functionally similar result, below is the same source config instead using IQR(12) multiplied by 2. Notice here the more 'stepped' response from IQR following the central rally, holding back for a while before closing in on price and ultimately initiating reversal much sooner. Unlike ATR, the length parameter for IQR is absolute and can more significantly affect its responsiveness.
Next we focus on the visualisation options, on top we have the default source config with ATR(8) multiplied by 2 and IQR(12) multiplied by 1. Here we have activated the switch to show 'bands', from this we can see the actual summed dynamics and how it influences the stop levels. Below that we have an altogether different config utilising the included filters which are now visible. In this example we have created a basic 8/21 EMA cross and set a 1% TSL, notice the brief fakeout in the middle which ordinarily might indicate a buy signal. Here the TSL functions as an additional requirement which in this case is not met and thus no buy signal is given.
Finally we have a couple of more 'experimental' examples. On top we have Lazybear's 'Variable Moving Average' in white which has been assigned via 'aux' as the centre with no additional filtering, the default config for trigger is used here and a basic TSL of 1.5% added. It's a simple example but it shows how this can be applied to other indicators. At the bottom we return to the default source config, combining a TSL of 8% with IQR(24) multiplied by -2. Note here the negative IQR with greater length which causes the stop to close in on price following significant deviations while otherwise remaining fairly wide. Combining positive and negative multiples of each factor can yield mixed results, some more useful than others depending upon suitable market conditions.
Since this has been quite lengthy, i shall leave it there. Suffice to say that there are plenty more ways to use this besides these examples. Please feel free to share any of your own ideas in the comments below. Enjoy.

cankardesler stoploss v2This stoploss allows to filter high volatility fake trends;
But how we are made it; we are calculating the last spikes value average and calculating the standart deviation, after we added to the standart stoploss formula price+2atr and voila!!
Your stop loss is ready.
The idea behind this formula: what is explosing our stops? fake-out spikes.
We think if we get the last spikes average and calculate the standart deviation on it and after add it to the original stop formula, its gonna help for bypassing the spikes.
Thanks a lot @ocankardes for helping me to developing this formula

ka66: Alpha-Configurable EMAAllows directly modifying the Alpha/Smoothing Factor parameter of an EMA. This can allow for very close fits to price movement, instead of the more standard coarse-grained approach of adjusting smoothing via the look-back period.
Furthermore, we allow smoothing this EMA further by passing the original EMA through the EMA function again, and the output of this, yet again, to as many smoothing iterations are desired. For efficiency and practicality, limited to 10 iterations. This is inspired by indicators such as the DEMA.
Finally, we allow producing bands, with a configurable multiplier, around the final EMA. Useful for dynamic S/R levels, e.g. to use as trailing stop zones.

[-_-] Volatility Calibrated ATRDescription:
An indicator based on ATR adjusted for volatility of the market. It uses Heikin Ashi data to find short and long opportunities and displays a dynamic stop loss level. Additionally, it has alerts for when the trend changes (which is an entry signal).
How it works:
It works by dynamically calculating the Period for ATR which depends on current volatility level that is calculated by a function that uses Standard Deviation of price. ATR is then smoothed by Weighted Moving Average and multiplied by ATR Factor, resulting in a plot that changes its colour to red when we're in a downtrend and green when in an uptrend. This plot should be used as a dynamic Stop Loss level. Trend change is determined by price crossing the dynamic Stop Loss level. The squared red and green labels appear when the trend changes, and should be used as Entry signals.
Parameters:
- Source -> data used for calculations
- ATR Factor -> higher values produce less noise and longer trends, lower values give more signals

Volatility Stop with Vwap StrategyFirst the credits goes to @TradingView for their release of the volatility stop mtf indicator.
I have took it, and inside I have added a weekly vwap for a better trend direction and at the same time I have added a dynamic risk managment which is calculated from the distance between the volatility line to the close of the candle.
The rules for entry are simple:
For long:We enter when our close of the candle is above the volatility stop line and at the same time the close of the candle is above weekly vwap
For short we enter when our close of the candle is below the volatility stop line and at the same time the close of the candle is below weekly vwap.
We exit when we either have a reverse signal than the one we enterred, or based on the TP/SL which is calculated with the distance from vwap to the close of the candle.
If you have any questions please let me know !
