Volatilite
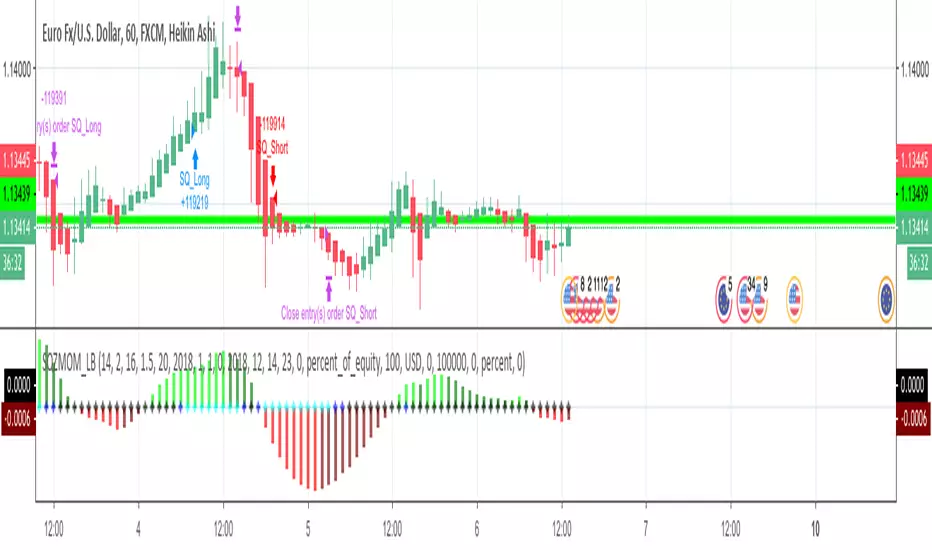
Strategy based on Squeeze Momentum Indicator [LazyBear]This Strategy is based on LazyBear Squeeze Momentum Indicator.
I added some custom feature and filters.
You can customize a lot of features to get a profitable strategy.
Here is a link to original study.
Please use comment section for any feedback.
Next improvement (only to whom is interested to this script and follows me): study with alerts on multiple tickers all at one. Leave a comment if you want to have access to study.
********************************** IMPORTANT*******************************
I have developed an expert advisor for metatrader4 (MT4) and for jforex platform: results of expert advisor form 2015-01-01 to 2018-11-25 are very good with low drawdown and good profit.
********************************************************************************

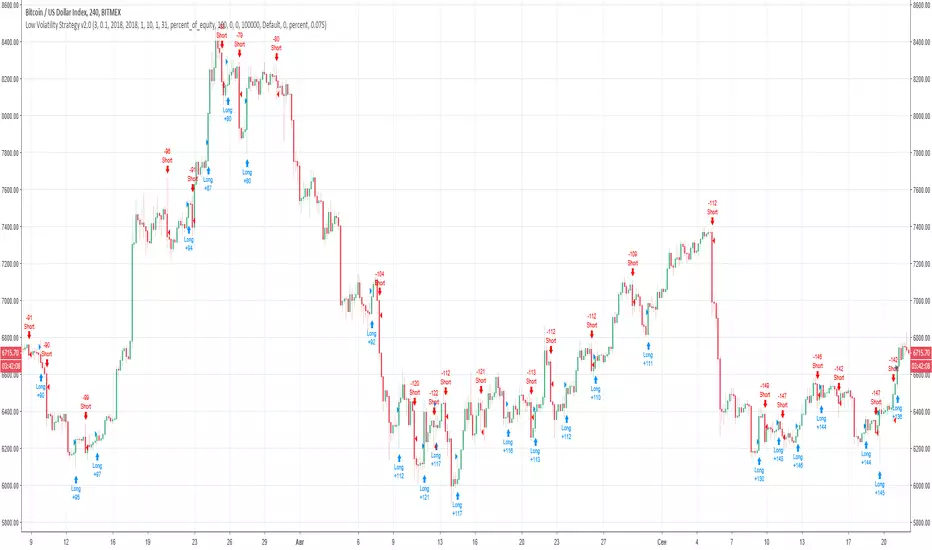
BTC Swinger v1Daily interval swing trading algorithm based on momentum techniques using ATR Stops. Made by Kory Hoang from Stably.
Shout out to the Advanced Crypto Asset Trading crew! ;)


Doji strategyThis is a simple strategy based on Doji star candlestick.
It places two orders: buy stop at doji star high or previous candle high and sell stop at doji star low or previous candle low.
Exit rules are with take profit and fixed stop loss or take profit and stop loss at doji min or max.
This strategy works very well with high time frames like Daily and Weekly because those are without noise in doji formation.
Each currency pair has its own optimal setting for TP and SL: it's up to user find the best ones.
I could implement SL based on ATR, maybe in next revision.
Please use comment section for any feedback.
Next improvement (only to whom is interested to this script and follows me): study with alerts on multiple tickers all at one. Leave a comment if you want to have access to study.

[STRATEGY] MA Cross ElevenThis script is a crossing of eleven different MA, with alerts and SL and TP.
The simplest is what works best...
SMA --> Simple
EMA --> Exponential
WMA --> Weighted
VWMA --> Volume Weighted
SMMA --> Smoothed
DEMA --> Double Exponential
TEMA --> Triple Exponential
HMA --> Hull
TMA --> Triangular
SSMA --> SuperSmoother filter
ZEMA --> Zero Lag Exponential
Using "once per bar close" repaint is 0%, but if you like risk can choose "once per bar", better profit.
Thanks to JustUncleL and his amazing sripts.
Enjoy!
www.tradingview.com
"Note: When using non-standard (Renko, Kagi, Line Break, Point and Figure, Heikin Ashi, Spread Charts) types of chart as a basis for strategy, you need to realize that the result will be different. The orders will be executed at the prices of this chart (e.g.for Heikin Ashi it’ll take Heikin Ashi prices (the average ones) not the real market prices). Therefore we highly recommend you to use standard chart type for strategies."

Intellitrader - Buy Random BACKTESTERI created a little backtester that it combines some of what we need to backtest to finetune a good strategy for Intellitrader.
RSI
STOCH
STOCHRSI
CCI
Price Change

Percentage BandsA different version of bollinger bands, I use percentage difference instead of standard deviation.

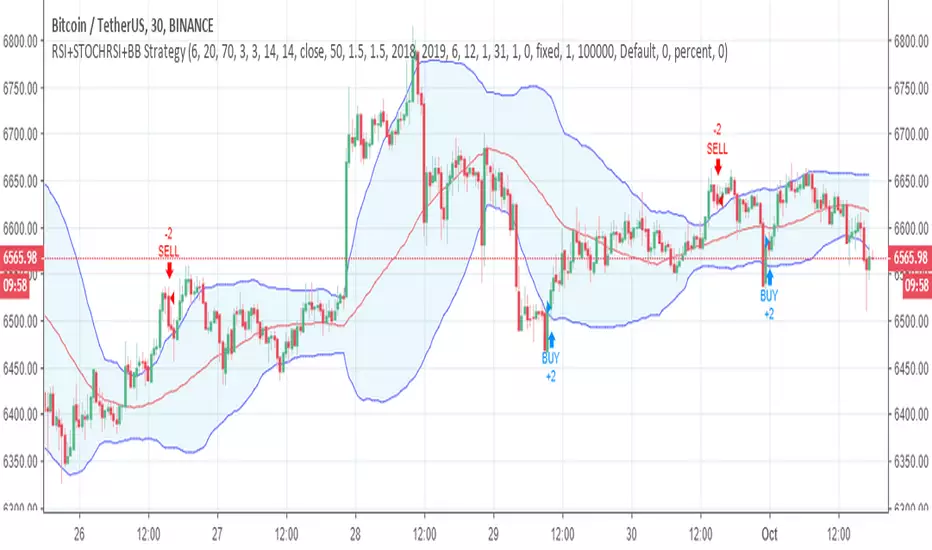
BB+STOCH RSI v2Developed for one of my followers.
The basic idea is that the buy signal is generated by stoch and bb.
However, If price hits the upper line or trend return crossing under midline, the strategy closes the position.


RSI MACD with conditional MA indicator backtestingbacktesting for the RSI MACD with conditional MA indicator:
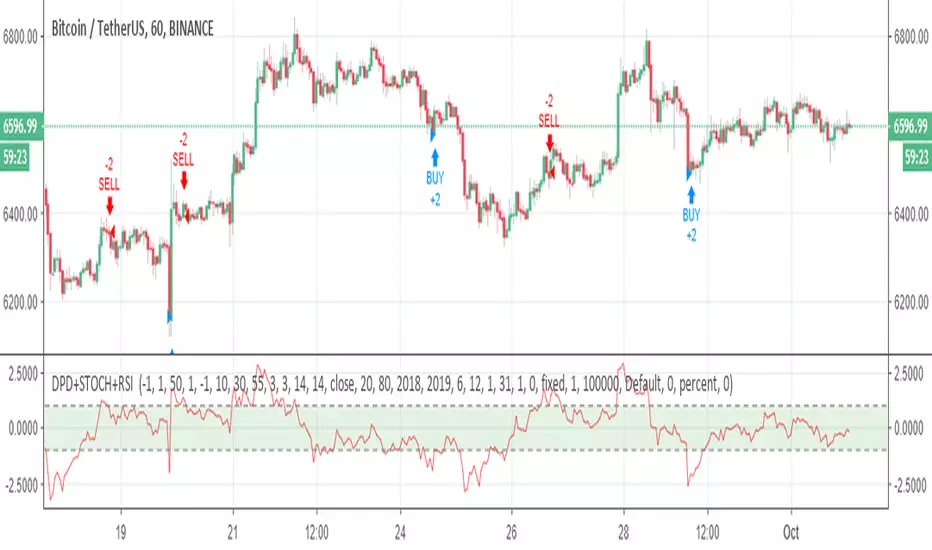
DPD+RSI+BB Combination of DPD ,STOCHRSI and RSI indicators. Be careful for percantage selection to fit your candle size.

DEMA PRICE DİFFERENCE Strategy Strategy based on DPD indicator , price crossover the lower line , it means BUY signal. Price crossunder the upper line,it means SELL signal.
For @dpanday

DPD+STOCH RSI +RSI Combination of DPD ,STOCHRSI and RSI indicators. Be careful for percantage selection to fit your candle size.
Noro's Volty Strategy v1.0It is the strategy of Volty Expan Close. I have added a feature to remove short positions and an opportunity to choose a time interval by dates.

APEX - Tester - Buy/Sell Strategies - Basic - BACKTESTERThis is a upgraded version of the following study.
This is a simple Strategy for backtesting your APEX trading ideas.
Be aware that the results will not be exact same as with apex bot.

Trailing Stops/Choose a Day of the WeekThis would be my second ever published strategy. It is almost the same as my first ever published script . I've been working primarily on UGAZ and DGAZ .
This is basically a statistical trade. It buys every morning near market open (or by choosing a "time constraint"), then immediately places a trailing stop at a specified amount in ticks (if used on UGAZ a tick = $0.01, if used on NG at tick = $0.001). I've found between 2% and 3% works well for the trailing stop (ie. if UGAZ = $75, a 3% trailing stop = $2.25)
-----What is different from my first strategy?------
You can test the trailing stop strategy one 1 day of the week. Days of the week are assigned numbers. Sunday=1, Monday=2, Tuesday=3 and so on. Just choose a number that correlates to the day of the week you want to test. The Trailing stop may go past that day, that's a good thing if it's making money.
-- Go long/Short is just that, it will buy shares/contracts or short them.
-- Trades per day. This may not be a good choice, when left on "2", it will trade once per day. If set above 2 and there is time left for another trade, an order will enter on the open of the next candle. I'm am still working on ideas for this.
-- Time constraints. When you select this check box, the strategy will limit an entry to the time specified below the "Use Time Constraints" check box. An Exit order will still continue past this window of time until it is stopped out.
---- very important ----
Due to decay, leveraged ETFs will give false results if the price gets far out of range. For example, your ETF is trading around $20 and you choose a 1 hour chart, it may back test back to a time before a reverse split. If the price gets to be too large, like $200, or $1200, the movement on the chart creates false indication of profit/loss.
--- Most important. ---
Do not trade off this strategy, you may lose lots of money. This is for educational use only.
Good luck

ATR Trailing Stop Bands Strategy [R] Originally based on a script by HPotter for an ATR Trailing Stop, which itself was based on an article by Sylvain Vervoort, but I adapted it to add Bands, to add extra optional Wick Protection, and have now made it a Strategy. It's not great for entries/exits, but as a Trailing Stop that can let winners ride, it's great.

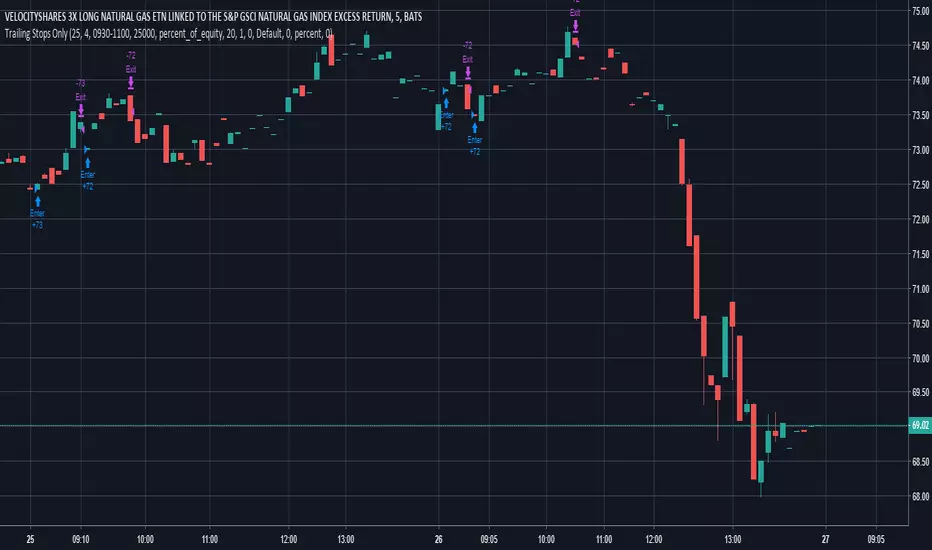
Trailing Stops Only - For Leveraged ETFs (UGAZ/DGAZ)Looking for Statistical trades that work. This one seems to work on some Leveraged ETFs with a lot of noise like UGAZ/DGAZ. It can also be used on Futures Contracts, but be sure to change up the type of investment from % of equity to contracts. Also one point I'm trying to make with this strategy is the trades are best made in the morning around market open. When used with Contracts, be sure to make use of the time settings. It will limit buying between the hours set. Selling will occur at any time the trailing stop is triggered.
This Strategy is best used on 5min or 15min charts.
!!!! very important !!!!
Due to decay, leveraged ETFs will give false results if the price gets far out of range. For example, your ETF is trading around $20 and you choose a 1 hour chart, it may back test back to a time before a reverse split. If the price gets to be too large, like $200, or $1200, the movement on the chart creates false indication of profit/loss.
Most important. Do not trade off this strategy, you may lose lots of money. This is for educational use only.