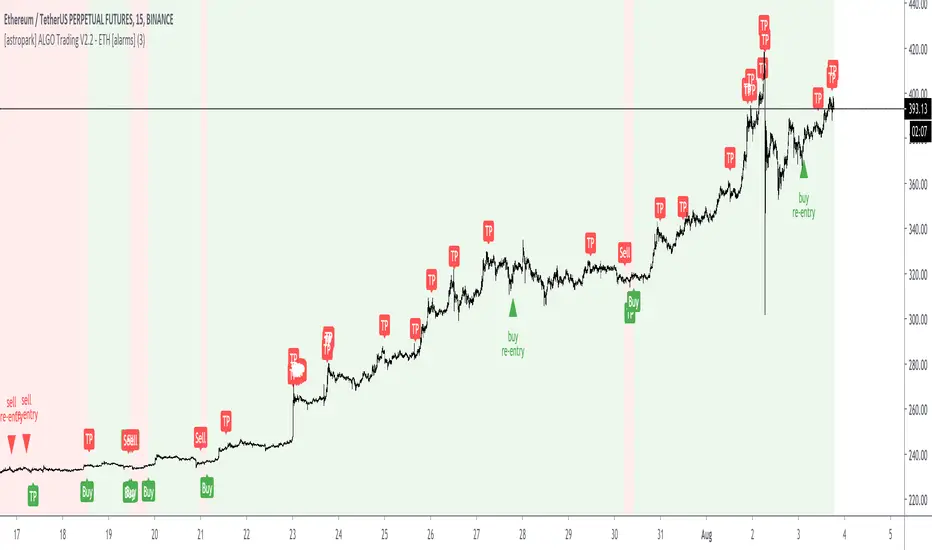
[astropark] ALGO Trading V2.2 - ETH [alarms]Dear Followers,
today another awesome Swing and Scalping Trading Strategy indicator : the upgraded version of ALGO Trading V2 for Binance Ethereum PERP on 15m timeframe!
It is runnable on a bot , just write me in order to help you do it.
If you are a scalper or you are a swing trader, you will love suggested entries for fast and long-lasting profit.
Keep in mind that a proper trailing stop strategy and risk management and money management strategies are very important (DM me if you need any clarification on these points).
This is an upgrade version of ALGO Trading V2 for Ethereum.
You can find ALGO Trading V2 indicator here below:
If you are interested in Bitcoin Trading, you will like for sure ALGO Trading V1.2, which is a customized version for Bitcoin trading:
This strategy has the following options:
enable/disable signals on chart
enable/disable bars and background coloring based on trend
enable/disable a Filter Noise option, which reduces overtrading
enable/disable a Trailing Stop option
enable/disable/config a Take Profit option, with Re-Entry
enable/disable a secret Smart Close Option which may improve profit on your chart (again, check it on you chart if it helps or not)
This strategy only trigger 1 buy (where to start a long trade) or 1 sell (for short trade). If you enable Take Profit / Stop Loss option, consider that many TP can be triggered before trend reversal, so take partial profit on every TP an eventually buy/sell back lower/higher on RE-ENTRY signal to maximize your profit.
This script will let you set all notifications you may need in order to be alerted on each triggered signals.
The one for backtesting purpose can be found by searching for the astropark's "ALGO Trading V2.2" and then choosing the indicator with "strategy" suffix in the name, or you can find here below:
This is not the "Holy Grail", so use proper money and risk management strategies.
This is a premium indicator , so send me a private message in order to get access to this script.
Takeprofit
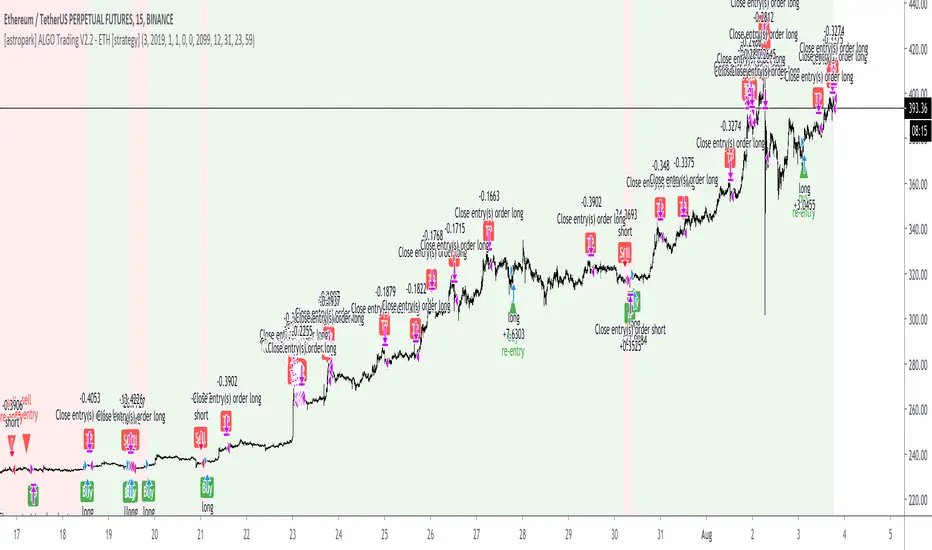
[astropark] ALGO Trading V2.2 - ETH [strategy]Dear Followers,
today another awesome Swing and Scalping Trading Strategy indicator : the upgraded version of ALGO Trading V2 for Binance Ethereum PERP on 15m timeframe!
It is runnable on a bot , just write me in order to help you do it.
If you are a scalper or you are a swing trader, you will love suggested entries for fast and long-lasting profit.
Keep in mind that a proper trailing stop strategy and risk management and money management strategies are very important (DM me if you need any clarification on these points).
This is an upgrade version of ALGO Trading V2 for Ethereum.
You can find ALGO Trading V2 indicator here below:
If you are interested in Bitcoin Trading , you will like for sure ALGO Trading V1.2, which is a customized version for Bitcoin trading:
This strategy has the following options:
enable/disable signals on chart
enable/disable bars and background coloring based on trend
enable/disable a Filter Noise option, which reduces overtrading
enable/disable a Trailing Stop option
enable/disable/config a Take Profit option, with Re-Entry
enable/disable a secret Smart Close Option which may improve profit on your chart (again, check it on you chart if it helps or not)
This strategy only trigger 1 buy (where to start a long trade) or 1 sell (for short trade). If you enable Take Profit / Stop Loss option, consider that many TP can be triggered before trend reversal, so take partial profit on every TP an eventually buy/sell back lower/higher on RE-ENTRY signal to maximize your profit.
Strategy results are calculated on the time window from December 2019 to now, so on more than 7 months, using 1000$ as initial capital and working at 1x leverage (so no leverage at all! If you like to use leverage, be sure to use a safe option, like 3x or 5x at most in order to have liquidation price very far).
This is not the "Holy Grail", so use proper money and risk management strategies.
In order to get notified when a signal is triggered, you need to use the "alarms" version of this indicator (just search for astropark's "ALGO Trading V2.2 - ETH" indicator and choose the one with "alarms" suffix).
This is a premium indicator , so send me a private message in order to get access to this script.
MACD VWAP IndicatorThis indicator uses a combination of the VWAP, EMA 9 and parts of the MACD in order to detect a bullish or bearish trend.
How to trade it:
Set SL either below or above the VWAP line (orange) and TP to 1:1.5 ratio (depending on last few candles, of course).
If EMA200 is close by then place SL either below or above EMA200 (blue) and TP to 1:1.5 ratio
Important:
Best traded in 15M, 30M => Intraday.
Have fun! :)

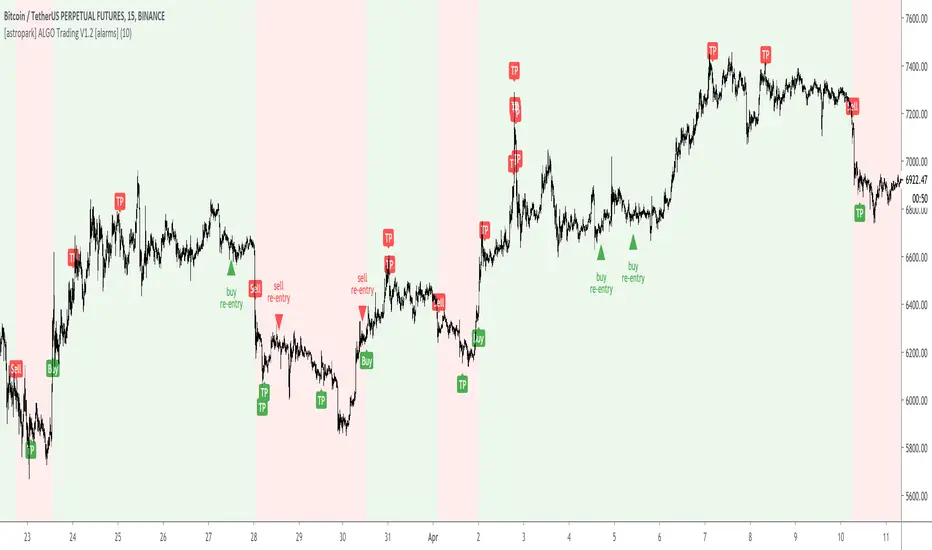
[astropark] ALGO Trading V1.2 [alarms]Dear Followers,
today another awesome Swing and Scalping Trading Strategy indicator : the upgraded version of ALGO Trading V1 for Binance Bitcoin PERP on 15m timeframe!
It is runnable on a bot , just write me in order to help you do it.
If you are a scalper or you are a swing trader, you will love suggested entries for fast and long-lasting profit.
Keep in mind that a proper trailing stop strategy and risk management and money management strategies are very important (DM me if you need any clarification on these points).
This strategy has the following options:
enable/disable signals on chart
enable/disable bars and background coloring based on trend
enable/disable a Filter Noise option, which reduces overtrading
enable/disable a Trailing Stop option
enable/disable/config a Take Profit option, with Re-Entry
enable/disable a secret Smart Close Option which may improve profit on your chart (again, check it on you chart if it helps or not)
This strategy only trigger 1 buy (where to start a long trade) or 1 sell (for short trade). If you enable Take Profit / Stop Loss option, consider that many TP can be triggered before trend reversal, so take partial profit on every TP an eventually buy/sell back lower/higher on RE-ENTRY signal to maximize your profit.
This is not the "Holy Grail", so use proper money and risk management strategies.
This indicator will let you set all alerts you need in order to get notified whenever a new signal is triggered.
To check its backtesting, you should use the strategy version, that you can find by searching for "ALGO Trading V1.2" or here below:
You can check out previous ALGO Trading V1 indicator here below:
This is a premium indicator , so send me a private message in order to get access to this script.
[astropark] ALGO Trading V1.2 [strategy]Dear Followers,
today another awesome Swing and Scalping Trading Strategy indicator : the upgraded version of ALGO Trading V1 for Binance Bitcoin PERP on 15m timeframe!
It is runnable on a bot , just write me in order to help you do it.
If you are a scalper or you are a swing trader, you will love suggested entries for fast and long-lasting profit.
Keep in mind that a proper trailing stop strategy and risk management and money management strategies are very important (DM me if you need any clarification on these points).
This strategy has the following options:
enable/disable signals on chart
enable/disable bars and background coloring based on trend
enable/disable a Filter Noise option, which reduces overtrading
enable/disable a Trailing Stop option
enable/disable/config a Take Profit option, with Re-Entry
enable/disable a secret Smart Close Option which may improve profit on your chart (again, check it on you chart if it helps or not)
This strategy only trigger 1 buy (where to start a long trade) or 1 sell (for short trade). If you enable Take Profit / Stop Loss option, consider that many TP can be triggered before trend reversal, so take partial profit on every TP an eventually buy/sell back lower/higher on RE-ENTRY signal to maximize your profit.
Strategy results are calculated on the time window from December 2019 to now, so on more than 7 months, using 1000$ as initial capital and working at 1x leverage (so no leverage at all! If you like to use leverage, be sure to use a safe option, like 3x or 5x at most in order to have liquidation price very far).
This is not the "Holy Grail", so use proper money and risk management strategies.
In order to get notified when a signal is triggered, you need to use the "alarms" version of this indicator (just search for astropark's "ALGO Trading V1.2" indicator and choose the one with "alarms" suffix).
You can check out previous ALGO Trading V1 indicator here below:
This is a premium indicator , so send me a private message in order to get access to this script.

ATR Take Profit bandsSimple ATR-scaled levels or bands of suggested price to take profit on directional trades.

Two Take Profits and Two Stop LossThis script is for research purposes only. I am not a financial advisor.
Entry Condition
This strategy is based on two take profit targets, two stop loss, and scaling out strategy. The entry rule is very simple. Whenever the EMA crossover WMA, the long trade is taken and vice versa.
Take Profit and Stop Loss
The first take profit is set at 20 pips above the long entry and the second take profit is set at 40 pips above the long entry. Meanwhile, the first stop loss is set at 20 pips below the long entry and the second stop loss is set at the long entry.
Money Management
When the first take profit is achieved, half of the position is closed and the first stop loss is moved to the entry-level. The rest of the position is open to achieve either second take profit or second stop loss.
There are three outcomes when using this strategy. Let's say you enter the trade with 200 lot size and you are risking 2% of your equity.
1. The first outcome is when the price hits stop loss, you lose the entire 2%.
2. The second outcome is when the price hits the first take profit and you close half of your position. Meaning that you have gained 1%. Then you let the trade running and eventually it hits the second stop loss. Remember your first stop loss has changed to the second stop loss when the first take profit is achieved. The total loss is 0% because the price is at your entry-level. You have gained the earlier 1% and then lost 0%. At this point, you are at 1% gained.
3. The third outcome is similar to the second out but instead of hitting the second stop loss, the trade is running to your favor and hits the second take profit.
Therefore, you gained 1% from the first take profit and you gained another 2% for the second take profit. Your total gained is 3%
Summary
The reason behind this strategy is to minimize risk. with normal strategy, you only have two outcomes which are either win or loss. With this strategy, you have three outcomes which win 3%, win 1%, or loss 2%.
This is my similar strategy but with single stop loss

Two Take Profit StrategyThis script is for research purposes only. I am not a financial advisor.
Entry Condition
This strategy is based on two take profit targets and scaling out strategy. The entry rule is very simple. Whenever the EMA crossover WMA, the long trade is taken and vice versa.
Take Profit and Stop Loss
The first take profit is set at 20 pips above the long entry and the second take profit is set at 40 pips above the long entry. Meanwhile, the stop loss is set at 20 pips below the long entry.
Money Management
When the first take profit is achieved, half of the position is closed. The rest of the position is open to achieve either second take profit or stop loss.
There are three outcomes when using this strategy. Let's say you enter the trade with 200 lot size and you are risking 2% of your equity.
1. The first outcome is when the price hits stop loss, you lose the entire 2%.
2. The second outcome is when the price hits the first take profit and you close half of your position. Meaning that you have gained 1%. Then you let the trade running and eventually it hits stop loss. The total loss is 0% because the remaining lot size which is 200/2=100 times by 20pips is 1%. You have gained the earlier 1% and then loss 1%. At this point, you are at break even.
3. The third outcome is similar to the second out but instead of hiring stop loss, the trade is running to your favor and hits the second take profit.
Therefore, you gained 1% from the first take profit and you gained another 2% for the second take profit. Your total gained is 3%
Summary
The reason behind this strategy is to minimize risk. with normal strategy, you only have two outcomes which are either win or loss. With this strategy, you have three outcomes which are win, loss or break even.

EMA trend reversal strategy "muxie1" - 1.5x to 3xThis uses 2 EMA and Stop Loss and Take Profit,
The stops don't fire at the precise value but only when the trend reverses
it is actually good for 1D since 2019, it was however optimised for 1min but I am not able to share for 1m.
have equivalent code for quantum zone ftx
Great profit factor from 1.5x to 3x
Mandatory input is the position size per trade, tested with 1 btc for 100k virtual capital, remember to set it small for a low risk per trade, and even smaller if you use leverage,

Entrate, take profit e stop loss, target 1
Questo script vuole essere un aiuto nell'impostare le operazioni a mercato giorno per giorno.
A seconda della posizione che si vuole scegliere (long o short) guardando il grafico si può essere aiutati dall'indicatore Entrare.
Le linee trasparenti verdi e arancioni sono entrate:
long: la mia entrata a mercato sarà al prezzo della riga arancione trasparente, il mio stop loss alla riga rossa, il mio tp 1 alla riga bianca superiore e il tp 2 alla riga verde.
short: la mia entrata a mercato sarà al prezzo della riga verde trasparente, il mio stop loss alla riga verde, il mio tp 1 alla riga bianca inferiore e il tp 2 alla riga rossa.
Questa semplice strategia è basata su altri due script di mia creazione che trovate a questi indirizzi:
This script is made for help people with their entry day per dar.
Depending on the position yuo decided (long or short) and whatcing the chart you can be helped by this script "Entrate".
Transparent Green and Orange line are entry points:
long: the entry point will be the transparent orange line, stop loss at red line, tp1 at upper white line and tp 2 at green line.
short: the entry point will be the transparent green line, stop loss at green line, tp1 at lower white line and tp2 at red line.
This simple strategy is based on other 2 script made by me, and you can find at these links:
Buona fortuna e Good Luck!

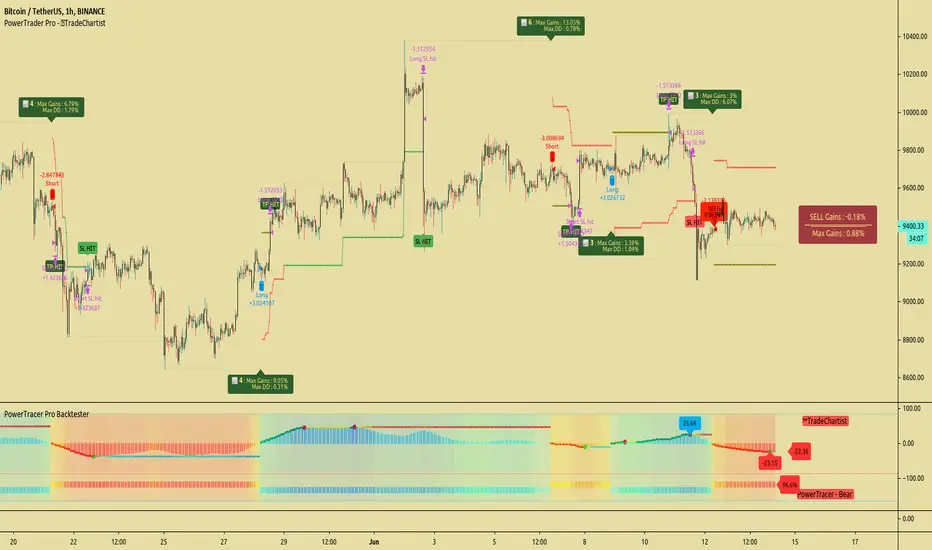
TradeChartist PowerTracer Pro Backtester™TradeChartist PowerTracer Pro Backtester is the strategy script for backtesting ™TradeChartist PowerTracer Pro for best performance settings which can then be used with ™TradeChartist PowerTrader Pro to plot Trades emulating the backtester and use Alerts (once per bar) on real time price chart.
PowerTracer Backtester includes the following options in the settings.
PowerTracer setting - Power Plot Type - (PowerTracer, Bar-wise Power Holder)
PowerTracer setting - Timeframe Multiplier
PowerTracer setting - Smoothing Factor
Backtester setting - Trade Direction - (Both Longs and Shorts, Only Longs, Only Shorts)
Backtester setting - SL Type (Fixed Stop Loss, Trailing Stop Loss)
Backtester setting - Reference for Trailing SL (Close, High/Low)
Backtester setting - Stop Loss %
Backtester setting - Take Profit %
Backtester setting - Quantity to trade at TP %
Using combinations of the settings, the user can find optimal settings for the asset to deliver lucrative entry and exit signals with high ROI and minimal Drawdown which can then be used on PowerTracer Pro and PowerTrader Pro to plot signals and create alerts to start trading in real-time.
Example charts:
GBP-USD 1hr chart - (2,1,Trailing SL, close, 1,1,25)
BTC-USDT 15m chart - (4,5, Trailing SL, high/low, 3.9,1.2,15)
SPX 1hr chart - (1,3, Trailing SL, high/low, 3, 2, 50)
This backtester needs the following scripts to generate signals and plots on main price chart and for real-time alerts
™TradeChartist PowerTracer Pro
™TradeChartist PowerTrader Pro
===================================================================================================================
This is not a free to use indicator. Get in touch with me (PM me directly if you would like trial access to test the indicator)
Premium Scripts - Trial access and Information
Trial access offered on all Premium scripts.
PM me directly to request trial access to the scripts or for more information.
===================================================================================================================
Market Sniper - Trading/Scalping SuiteWelcome to Market Sniper.
Market sniper is meant to be a suite for trading/scalping alongside my indicators script, RSI, Stochastic and Horizontals.
It is based on over 15 Indicators/Oscillators so there is no need for convoluted charts and constantly changing charts/indicators for a better understanding of the market.
Warnings:
I can't stress this enough! This isn't a magic pill that will transform your illiterate grandmother into an expert trader! This is a very powerful tool whose function is to complement your trading/save time (and yes, with practice be your main trading tool).
This algorithm requires setting up and training to be used correctly, please do not expect to load it up and immediately be scalping the 1s charts.
This algorithm is heavy and might require constant refreshes of the browser on slower computers.
Labels overlap at the moment, working on this part at the moment. So, always zoom in before doing a trade / change the "+- signals in settings"
Candlestick patterns need tweaking, I personally have it off and use my own judgement atm.
What it includes:
Trend reversal / continuation (Macd, Stochastics, money flow , CCI , momentum, DIOSC (automatic trendlines ), SuperTrend, Moving averages, etc, etc.)
RSI divergence drive / drive counter (base code from Libertus, check his profile as he has very helpful scripts)
Bull Market expansions for longterm take profit and increasing position
Candlestick patterns
Trend reversal / Continuation
Green = Bullish reversal
Red = Bearish trend reversal
Orange = Trend continuation / strengthening
Trend Continuation/Strengthening
A warning here, trend strengthening also means that many times the indicators are overextended or close to it
------
The numbers reflect the amount of indicators that are signaling a reversal over the specified period on the settings.
For higher timeframes this setting should be on a lower value and the opposite for lower timeframes.
This works on every market and every timeframe(according to months of my own paper and real trading). Remember that each market/asset/commodity has different soft spots so tweaking, backtesting and present accuracy review should be of maximum priority.
Bull Market expansion phase
Warning:
The indicator purposely does not show any signals during bear markets. It is my opinion bear markets complexity render this tool close to useless.
It was designed to be used in higher timeframes, tough it SEEMS to have a good track record / be useful in lower timeframes.
it will ALWAYS give a fake signal at the end of a bull market because of the very nature of the code.
It is based of EMAs, RSI and Stochastic
Candlestick Patterns
Bullish candlestick patterns:
Hammer
Inverted Hammer
Dragonfly
Gravestone
Bearish candlestick pattern:
Shooting Star
Hanging Man
Gravestone
Dragonfly
RSI divergence drive
- Credit to Libertus for the base code of this section
The green triangle means there are at least 2 drives of valid divergence, yellow for 3 and red for 4+.
The script shows triangles when confirmation candle closes.
You need to know how divergence works to use this section. investopedia can easily get you there.
For cryptos I use 2-4h+ timeframes, for traditional markets I use 15min+ for forex I use it basically in every timeframe.
For questions/suggestions and access PM me in the platform itself and don't forget -> FEEDBACK IS IMPORTANT
Thank you all


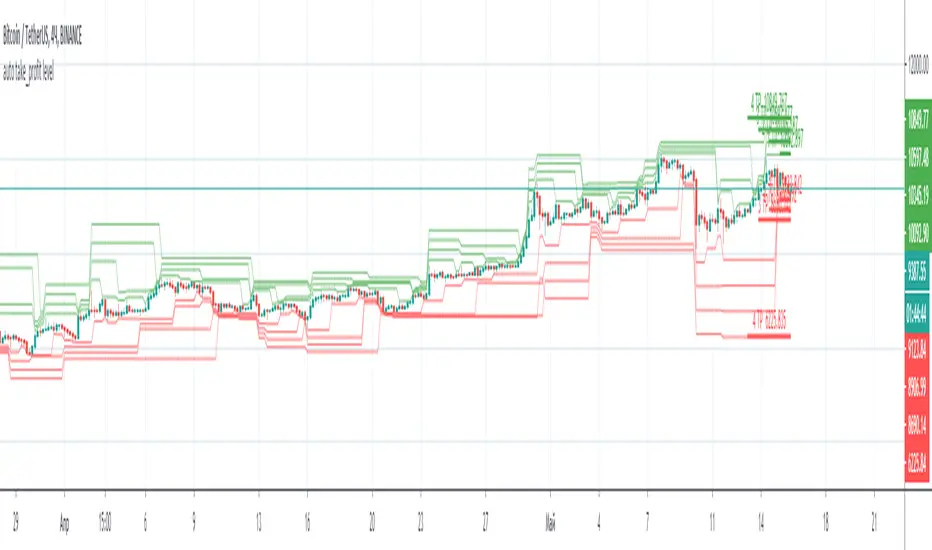
auto take_profit levelAutomatic indicator of take profit levels for any time frame.
It can be used as a visualization of resistance levels, when the lines are located next to each other, the price goes to the side where the levels are located more freely.
If you have an indicator with signals, you can set take profit by levels.
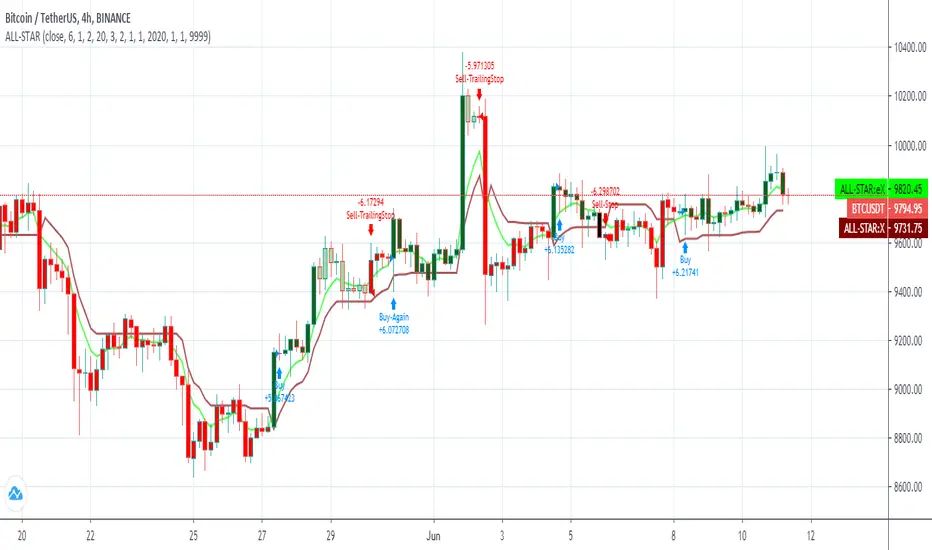
ALL-STAR STRATEGY TP-SL-TSHello!
This strategy combines multiple following stop and take profit strategies. Basically, after purchasing depending on the MOST Strategy, with the values you will determine from the settings section;
stop loss with percentage (settings > Manuel Stop Loss Ratio),
sell and take profit if it is at max profit level (settings > Take Profit Ratio),
activate the trailing stop after it exceeds a certain profit rate, and if it has dropped from this value by a certain rate, sell and take profit (settings > Trailing Stop Start Ratio) > (settings > Trailing Stop Ratio)
you can have your transactions done. In addition, the transaction, which is stopped according to the MOST strategy, also goes into a sell state.
The bars that are in the Sell state, switch to the Buy state, enter the trailing stop area, and are in the state of Buy despite the Most are shown in different colors.
Türkçe
Bu strateji birden fazla takip eden stop ve kar al stratejisini birleştirmektedir. Temelde MOST Stratejisine bağlı olarak alım yaptıktan sonra, ayarlar bölümünden belirleyeceğiniz değerler ile;
yüzde ile zarar durdur (ayarlar> Manuel Stop Loss Ratio),
max kar al seviyesine geldiyse sat ve kar al (ayarlar> Take Profit Ratio),
belirli bir kar oranını geçtikten sonra takip eden stop aktif et ve bu değerden belirli bir oranda düştü ise sat ve kar al (ayarlar> Trailing Stop Start Ratio) > (ayarlar> Trailing Stop Ratio)
işlemlerini yaptırabilirsiniz. Bunların yanında, MOST'a göre stop olan işlem de sat durumuna geçer.
Sat durumunda olan, Al durumuna geçen, Takip eden stop alanına giren, Most'a göre al durumunda olduğu halde kar al işleminden sonraki barlar farklı renklerle gösterilmiştir.
[Daveatt] BEST Trade Manager Pivots 1.0Hello BEST traders
The BEST Trade Manager got upgraded with many more features
This version allows setting automatically the TP levels on either Fibonacci/Traditional/Camarilla/Woodie pivots
I. 💎 SCRIPTS ACCESS 💎
1. Available only with one-time payment on my website.
2. My website URL is in this script signature at the very bottom (you'll have to scroll down a bit and going past the long description) and in my profile status available here: Daveatt
3. Many video tutorials explaining clearly how all our indicators work are available on your website > guides section.
4. You may also contact me directly for more information
II. 🔎 What is the BEST Trade Manager?🔎
2.1 Concept
The BEST Trade Manager is compatible with any indicator.
Once connected, it adds another layer of good stuff with real-time user custom defined stop loss (8 available options), take profits (4 possible options) + alerts compatible for trading automation.
2.2 How hard is it to update your indicator?
We'll send to our customers, a comprehensive and easy tutorial, to make any indicator compatible.
I guarantee you, it should take no more than 2 minutes per indicator. We made it easy, fun, and awesome. #bolder #statement
III. The amazing benefits of our Plug&Play system
I hope you're ready to be impressed. Because, what I'm about to introduce, is my best-seller feature - and available across many of my indicators.
The BEST Trade manager can be connected to any external indicator
Let's assume you want to connect your RSI divergence to your Trade Manager.
I mentioned an RSI divergence but you may connect any oscillator ( MACD, On balance volume, stochastic RSI, True Strenght index, and many more..) or non-oscillator (divergence, trendline break, higher highs/lower lows, candlesticks pattern, price action, harmonic patterns, ...) indicators.
THE SKY IS (or more likely your imagination) is the limit :)
We go in-depth on our website why the Plug&Play is an untapped opportunity for many traders out there - URL available on my profile status and signature
IV. 🧰 Features 🧰
Candles can be colored to highlight the trend direction better [/b [
4.1 Stop-Loss Management
For what's following, let's assume that 2 is the stop-loss value you inserted in the indicator, and the Algorithm Builder gives a BUY signal.
This is NOT a recommendation at all, only an example to explain how this feature works.
- %Trailing: The Stop-Loss starts 2% away from the entry price - and will move up (because we're on a BUY trade as per our example) every time your trade will gain 2% profit
- Pips Trailing: Same as above but using a distance in pips/USD value
- Percentage: The Stop-Loss stays static 2% away from the entry price. There is no trailing here
- TP Trailing: Trail your stop-loss every time a Take Profit level is hit
- Supertrend: embedded supertrend use as a trailing stop
- Fixed: Set the Stop-Loss at a fixed position (value should be in currency/units)
- ATR multiple: Set the Stop-loss at a multiple of ATR
- External connector: Let's say your indicator already contains embedded stop-loss levels, you can add them in the Trade Manager
4.2 Take Profits Management
You can manage up to 3 take profit levels defined as a percentage or price value or ATR multiple.
The expected input is in percentage value (for instance, setting the % target of TP1 to 2% will set the TP1 level 2% away from the entry price
This version allows setting automatically the TP levels on either Fibonacci/Traditional/Camarilla/Woodie pivots
4.3 Built-in Risk-to-Reward Panel with real-time analytics
The good stuff doesn't stop here.
You'll notice that this sometimes green (when in a LONG), sometimes red (when in a SHORT) panel at the right of your chart.
- Entry Price: the price when the Algorithm Builder will give a signal.
- The Trade PnL in percentage.
- Entry Stop Loss: Distance (in currency/units) between the selected stop-loss algorithm (percent, trailing, TP trailing, etc.) and the entry price.
- Entry TP1/TP2/TP3: Distance (in currency/units) between the entry price and the first take profit
- Risk/Reward TP1/TP2/TP3: Using the Stop-loss distance at entry, and Take Profit 1/2/3 at the entry to compute the risk-to-reward ratio.
- Max drawdown and Max opportunity (value and percentage): respectively the maximum loss and maximum win per trade
For more details, please check the guides section of my website. Links are in my signature and profile status.
V. 🔔 Alerts 🔔
We enabled the alerts on the:
1. Stop-Loss hit
2. Take Profit 1/2/3 hit
3. custom hard exits based on either MACD / RSI divergence/ MM cross
5.1 🤖 Compatible with trading bots? 🤖
It's compatible with all third-parties out there capturing alerts and forwarding them to the brokers.
We enabled TradingConnector and ProfitView alert templates so far.
If you have any doubts or questions, please hit me up directly or ask in the comments section of this script.
BEST regards,
Dave

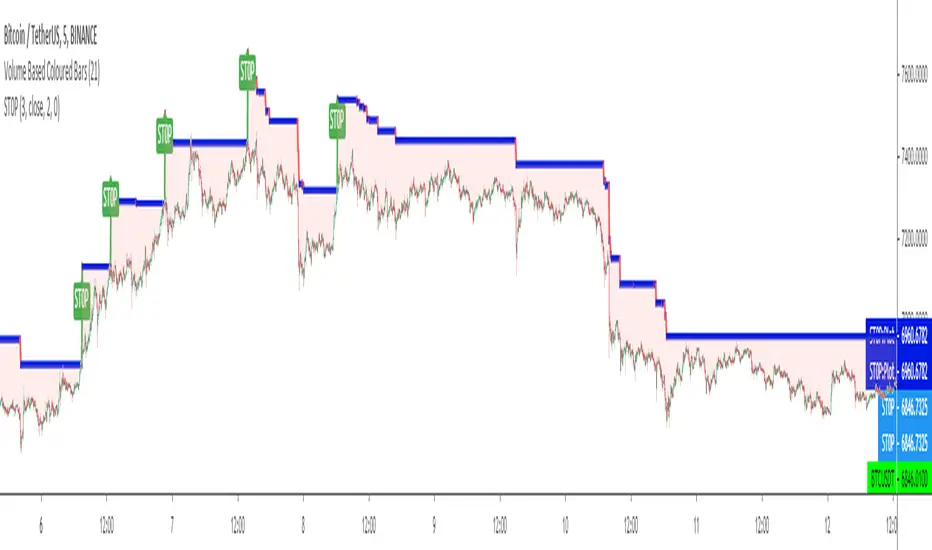
ST0PST0P is a kind of a TRAILING STOP LOSS INDICATOR in which users can set up LONG or SHORT trade versions and also can set up a STOP LOSS level by percent % or unit difference.
It tries to solve the problem of stop loss indicators' default BUY or SELL settings and non adjustable stop levels of % and difference change in price levels.
(Will try to make updates to add user defined start bars.)
Kıvanç Özbilgiç
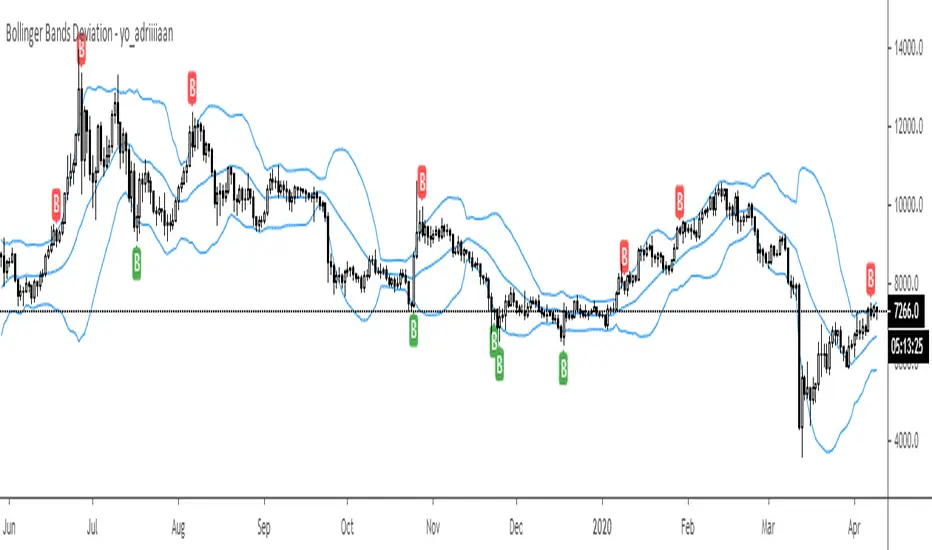
Bollinger Bands Deviation - yo_adriiiiaanBollinger Band Deviations
In theory price trades within 2 standard deviations 95% of the time. This is an attempt to capture that 5% that deviates from the bands.
Useful for taking profit or signaling a reversal.
RSI and Smoothed RSI Bull Div Strategy [BigBitsIO]This strategy focuses on finding a low RSI value, then targeting a low Smoothed RSI value while the price is below the low RSI in the lookback period to trigger a buy signal.
Features Take Profit, Stop Loss, and Plot Target inputs. As well as many inputs to manage how the RSI and Smoothed RSI are configured within the strategy.
Explanation of all the inputs
Take Profit %: % change in price from position entry where strategy takes profit
Stop Loss %: % change in price from position entry where strategy stops losses
RSI Lookback Period: # of candles used to calculate RSI
Buy Below Lowest Low In RSI Divergence Lookback Target %: % change in price from lowest RSI candle in divergence lookback if set
Source of Buy Below Target Price: Source of price (close, open, high, low, etc..) used to calculated buy below %
Smoothed RSI Lookback Period: # of candles used to calculate RSI
RSI Currently Below: Value the current RSI must be below to trigger a buy
RSI Divergence Lookback Period: # of candles used to lookback for lowest RSI in the divergence lookback period
RSI Lowest In Divergence Lookback Currently Below: Require the lowest RSI in the divergence lookback to be below this value
RSI Sell Above: If take profit or stop loss is not hit, the position will sell when RSI rises above this value
Minimum SRSI Downtrend Length: Require that the downtrend length of the SRSI be this value or higher to trigger a buy
Smoothed RSI Currently Below: Value the current SRSI must be below to trigger a buy

ATR based Stop and Take-Profit levels in realtime Little tool to quickly identify stops and take-profit levels based on Average True Range. User can change ATR multipiers, as well as the ATR length used. Green and red lines show these levels; plot is visible over last 8 bars only to reduce clutter. Label showing the current ATR, up above the last bar

ATR SL/TP Calculator
Hello traders!
With this script you will able to calculate easier SL and TP using the ATR Value according with your strategy.
Script plots two circles below and above the candle that is calculated using H/L of the candle +/- ATR Value.
You can also modify the ATR Period and other plotting options clicking on the settings icon.
Ciao Traders, in questi ultimi giorni non ho pubblicato analisi ma spero che gradirete questo script che vi faciliterà di molto il lavoro quando applicherete strategie basate sull'ATR per il calcolo degli stop o dei profit.
Grazie a questo script riuscirete a calcolare più facilmente lo SL ed il TP utilizzando il valore dell'ATR applicato al Massimo o al Minimo di quella candela.
Lo script visualizzerà due cerchi, uno sopra e uno sotto la candela che rappresentano il Massimo/Minimo più/meno il valore dell'ATR.
Potrete modificare il periodo dell'ATR e lo stile semplicemente cliccando sull'icona delle Impostazioni.

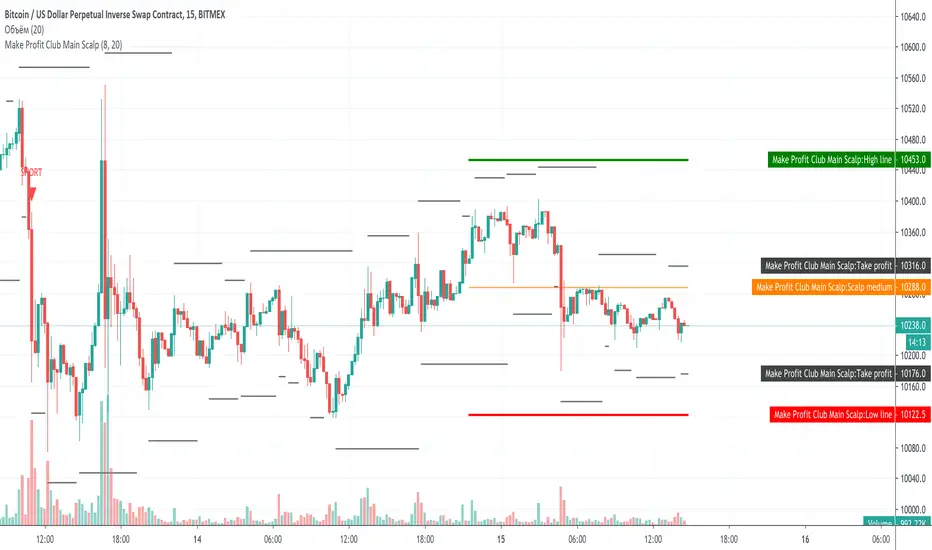
Make Profit Club Main ScalpThe main scalping indicator.
We use this indicator to trade for a short time in a TF of 5-15 minutes.
We have created takeprofit zones for you so that you can understand where we can get to and take your profit. these points are mostly very helpful.
There are basic settings that allow you to adjust the indicator individually for each situation; because of this, this indicator can be used for any exchange and any currency pair.
For Scalp trading, we use 3 different strategies available to our clients. If you enter them correctly, you can never see the minus sign.
Use the link below to obtain access to this indicator.
Expansion Top/Bottom (Expo) Expansion Top/Bottom (Expo)
DESCRIPTION
Expansion Top/Bottom (Expo) indicator is a powerful oscillator that visualizes temporary Top/Bottom as well as trend shifts. When the market moves boldly a histogram will be formed in the indicator which indicates that the movement might be at its end. It's always a great idea to lock in some profit when we get these histograms. These ‘Lock-in’ profits points are visualized by a cross.
The professional trader has the ability to adjust the length of the calculation. A longer length means that the indicator spots broader market shifts. A short length means that the indicator spots temporary tops/bottoms.
Use the indicator in combination with other signals and analysis techniques.
HOW TO USE
1. Use the indicator to identify temporary tops/bottoms.
2. Use the indicator to identify broader tops/bottoms.
3. Use the indicator to visualize the trend.
4. Use the indicator to visualize ‘Lock-In’ profit points.
INDICATOR IN ACTION
Short length (Length = 14)
BTCUSD
EURUSD
BRENT
BRENT
BTCUSD
Long length (Length = 50)
BRENT
EURUSD
BTCUSD
The indicator works with RENKO, HEIKIN ASHI and with KAGI charts as well.
I hope you find this indicator useful, and please comment or contact me if you like the script or have any questions/suggestions for future improvements. Thanks!
I will continue to work on this indicator, so please share your experience and feedback with me so that I can continuously improve it. Thanks to everyone that have contacted me regarding my scripts. Your feedback is valuable for future developments!
ACCESS THE INDICATOR
• Contact me on TradingView or use the links below.
• I have started to publish private scripts which are not visible on my profile. However, if you're interested to know more about these scripts, drop me a message at my webpage and I will show you these scripts as well. The rationale behind publishing these scrips as private is that I don't want them to be indexed in search engines.
-----------------
Disclaimer
Copyright by Zeiierman.
The information contained in my scripts/indicators/ideas does not constitute financial advice or a solicitation to buy or sell any securities of any type. I will not accept liability for any loss or damage, including without limitation any loss of profit, which may arise directly or indirectly from use of or reliance on such information.
All investments involve risk, and the past performance of a security, industry, sector, market, financial product, trading strategy, or individual’s trading does not guarantee future results or returns. Investors are fully responsible for any investment decisions they make. Such decisions should be based solely on an evaluation of their financial circumstances, investment objectives, risk tolerance, and liquidity needs.
My scripts/indicators/ideas are only for educational purposes!
