Market Waves [BigBeluga]MARKET WAVES
Market Waves The Market Waves [ BigBeluga ] is an all in one toolkit focusing on trends, accumulations and identifying market structures right on your chart. It is lightweight and powerful in its approaches, taking unique mathematical approaches to classical tools.
⬤ Signals
The Beluga Signals combine tested powerful ideas into a single tool. They are designed to follow trends and reduce noise in the market using low pass filtering methods. There are two types of signals founds in this toolkit; normal and power signals. Power signals are signals with a + in them indicating that the signal may be more likely to play out.
These are great when used in confluence with other trend following tools to filter them for even greater performance. Naturally traders will want to use these with confluence to confirm the trend identification.
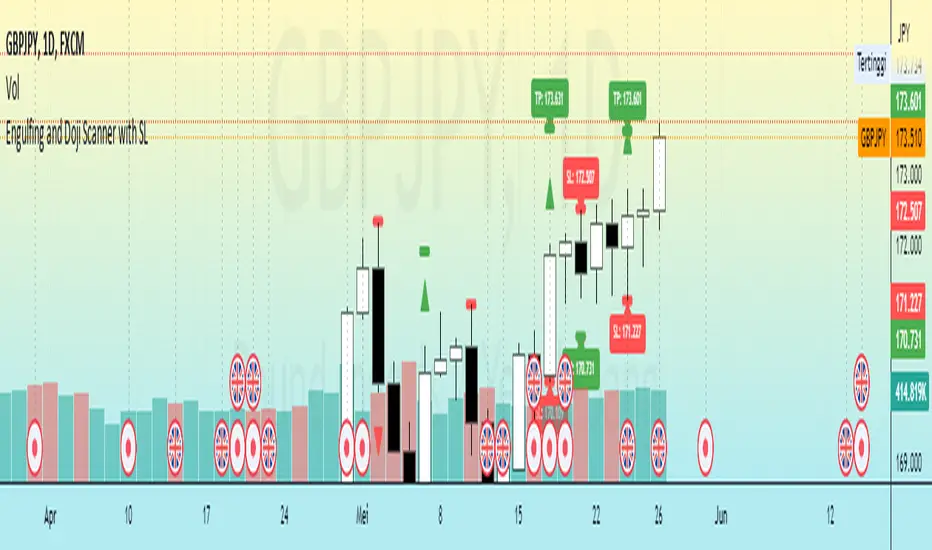
The signals come with take profits built in. Ticks are placed on the chart indicating a potential areas to be taking profit. Using these as exits can be powerful especially when using confluence. Max Profit labels are also produced suggesting it really is the ideal time to be exiting the market before a reversal comes.
By leveraging unique low lag methods and filtering approaches, these signals offer a unique edge when compared to classical TSL such as a SuperTrend or PSAR.
⬤ Smooth Trend
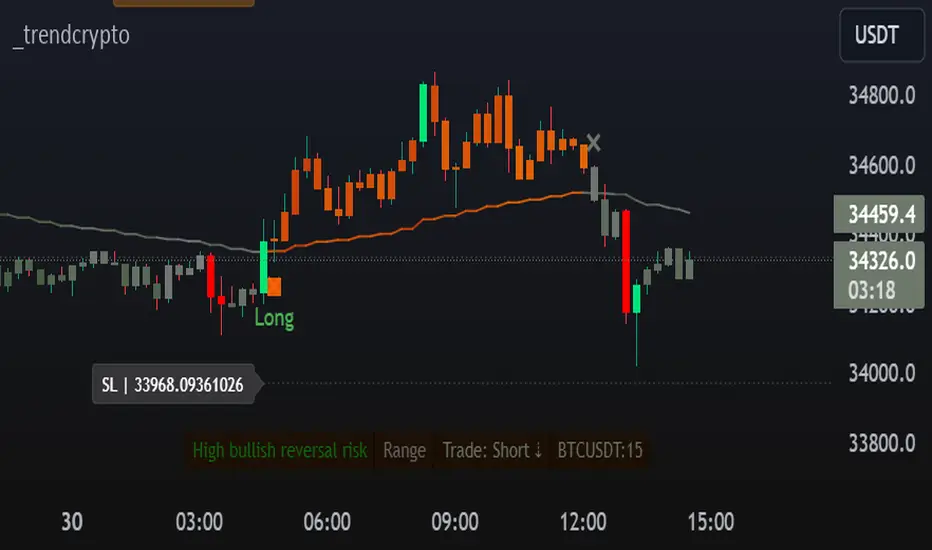
The Smooth Trend (shown here with green and red shadows) also focuses on low lag noise filtering. This unique system is perfect when used for entries or as a filter. Users are able to adjust how fast or slow the trend is identified.
In the example above, we see a sell signal during the time the smooth trend is green. Therefore using confluence we can filter out the signal and proceed to take our power buy signal.
Percentages are also provided at the start of the trend. These indicate the probability this really is a new trend. In the image above we again see the trends are both labelled as 100% and the system is fully confident what we were seeing was indeed a trend reversal.
Although it may appear as a classical trend following tool, again it's uniqueness lies in its ability to locate market bottoms and respond to trends.
⬤ The Trend Accumulations
This feature focuses on elegant trend and range identification making trader's lives easier. By not cluttering the chart this system allows traders to see an asset's behavior without overlays.
Uptrends, downtrends and ranges are identified with uptrends showing with a green base line, downtrends with a red one and ranges/accumulations in blue. As shown in the image above; this is a powerful system to avoid trading ranges/chop in the market. We see a blue accumulation zone, this means the market is best to avoid. We then transition to a faint green suggesting the market is starting to move upwards.
Leveraging range detection techniques, this gives responsive market structure identification at a glance.
⬤ Voltix Bands
The Voltix Bands are a type of volatility-based band used to gauge market volatility and identify potential trading opportunities. These bands consist of two components: an upper band and a lower band. The distance between the bands fluctuates based on market volatility. When the market is highly volatile, the bands widen, and when volatility is low, the bands contract. They are unique as they uniquely apply distributions and weight volatility accordingly.
How to Use Voltix Bands:
When the price moves outside the Voltix Bands, it often signals a potential breakout. A close above the upper band may indicate the start of an upward trend, while a close below the lower band might signal the beginning of a downward trend.
Traders often use these breakout signals to enter trades in the direction of the breakout.
Detecting Overbought and Oversold Conditions:
When the price touches or moves beyond the upper Voltix Band, it can suggest that the market is overbought, indicating a potential reversal or pullback.
Conversely, when the price touches or drops below the lower Voltix Band, it may indicate an oversold condition, suggesting a possible price increase or trend reversal.
Volatility Contraction and Expansion:
Tightening Voltix Bands (when the bands contract) often precedes a significant price movement. This phenomenon is known as the "squeeze." When the bands tighten, it indicates a period of low volatility, and traders often anticipate an imminent breakout in either direction.
Widening Voltix Bands (when the bands expand) signal increasing volatility. Traders can use this as a cue to either ride the trend or be cautious of potential reversals.
Trend Following:
In trending markets, the price often stays close to the upper or lower band for extended periods. Traders can use this characteristic to follow the trend, staying long when the price is near the upper band and short when it is near the lower band. The bands also provide color coding and are green during an uptrend and purple during a downtrend.
⬤ Candle Coloring
1. Volume-Based Candle Coloring
Volume-based candle coloring mode changes the color of each candlestick according to the trading volume associated with that period. This method helps traders quickly identify periods of high or low market activity and understand the strength behind price movements.
How It Works:
High Volume: Candles are colored differently (red bearish, bright blue for bullish) when the trading volume is significantly higher than the average. This indicates strong buying or selling interest.
This mode is useful for identifying potential breakouts or fakeouts. For example, a price breakout accompanied by high volume suggests a strong move, while a breakout on low volume might indicate a lack of conviction, potentially leading to a false breakout.
2. Trend-Based Candle Coloring
Trend-based candle coloring mode changes the color of candlesticks depending on the current market trend, helping traders visually distinguish between bullish and bearish phases and neutral periods.
How It Works:
Bullish Trend: Candles are colored green when the price is in an uptrend.
Bearish Trend: Candles are colored red when the price is in a downtrend.
Usage:
This mode is beneficial for trend-following strategies, allowing traders to quickly assess the overall market direction and align their trades with the prevailing trend.
3. Momentum-Based Candle Coloring
In this momentum-based candle coloring mode, candlesticks are colored yellow for strong bullish momentum and pink for strong bearish momentum. This visual approach highlights the intensity of market movements, helping traders quickly identify prevailing momentum and potential trend shifts.
How It Works:
Strong Bullish Momentum (Yellow Candles):
Candles turn yellow when the market exhibits strong upward momentum. This might be triggered by a proprietary technique that detects when buying pressure is significantly driving prices higher, indicating that the market is experiencing robust bullish activity.
Yellow candles suggest that the price is likely to continue rising, and traders may look to capitalize on this momentum.
Strong Bearish Momentum (Pink Candles):
Candles turn pink when strong downward momentum is detected. The same technique identifies when selling pressure is dominant, pushing prices lower at a significant pace.
Pink candles indicate that bearish forces are strong, with the price likely to keep declining, making it a potential opportunity for short-selling or exiting long positions.
This color scheme is particularly beneficial for traders who prioritize momentum-based strategies. The clear distinction between strong bullish (yellow) and bearish (pink) momentum provides an instant visual cue, enabling quick decision-making.
Entering Trades:
Traders might choose to enter long positions when a series of yellow candles appears, indicating strong bullish momentum.
Alternatively, pink candles may signal an opportune moment to enter short positions, capturing the market's downward momentum.
Exiting Trades:
A shift from pink to yellow candles in a previously bearish trend could indicate a reversal, prompting traders to exit short positions.
The Market Waves toolkit is a powerful collection of unique and powerful tools. Please use DD when trading and always manage risk.
Ücretli komut dosyası