Support & Ressistance by @kaleboraciy [REUPLOAD]█ OVERVIEW
Support & Resistance levels are important in trading as we all know.
█ WARNING
This version is beta, maybe sometimes it will plot wrong levels, but i will try to to eliminate these issues. And please note, that you should find your own ideal settings for every ticker you use.
█ FEATURES
This is the first script in Pine Community which plots levels using the last two points/ pivots /fractals.
It also stops plotting levels when there is a breakout on the particular level.
█ SETTINGS
1. Pivot Points Length - defines pivot points length. Using to find points where market is reversed. If you set lower value, there will be more points but less useful. As I said you should find your optimal parameters.
2. Inaccuracy in % - defines maximal possible inaccuracy between 2 pivot points .
3. Linewidth - width of line(level)
4. Start Calculations from - if you use low timeframe (1m - 30m) there are a lot of calculations, and PineScript can't process it. This parameter defines start date of calculations and now there are less data and Pine can process it better.
█ HOW IT WORKS
When a new pivot appears, it draws invisible line starting in this pivot . when the second pivots gets created, it checks all lines in array. When inaccuracy is smaller than defined, the line becomes visible.
If price breaks trough the pivots , the lines stop and a new cycle begins.
I hope that this script will be helpful in your trading🙂
Destek ve Direnç

Williams Alligator Trend FilterI've edited the normal Bill Williams Alligator indicator to have a color fill that indicates the trend. There is a percentage range filter which checks if the 2 outer lines are enough far away from eachother to indicate a trend. The indicator also checks if the lines are below or above eachother in the right order as a last check to confirm Trend

Chart Map[netguard] V1.0Chart map is a indicator that shows best levels of price.
on this indicator we divided ATH and ATL of chart to 16/32 levels that each one of them can control price and candles.
furthermore you can use weekly or daily map in this indicator.in weekly map we divide High to Low of last week candle to 8 levels that these levels can control candles too.
In general, these levels act as strong support and resistance.
you can trade on these levels with candle patterns.

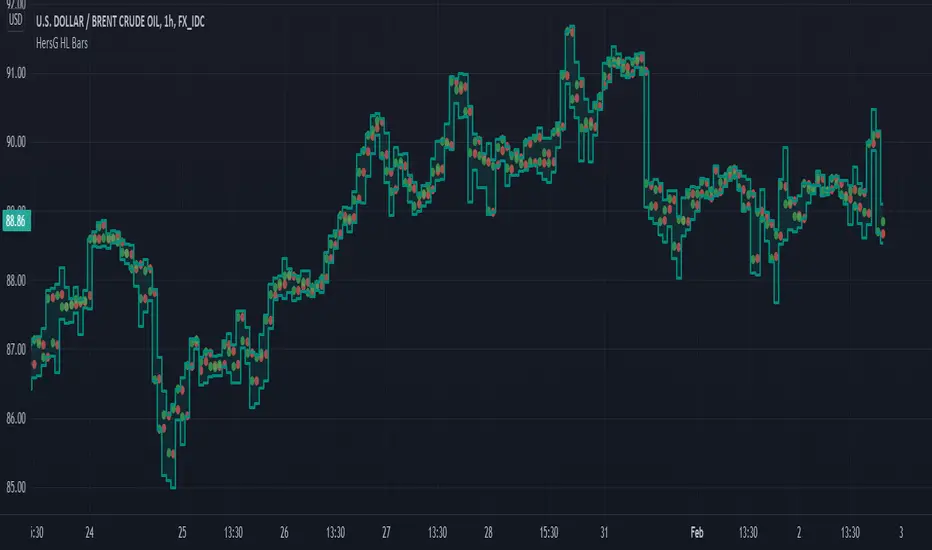
HersG High Low Bar Charts Layout
Hello friends,
The following indicator will create a new form of chart layout in High & Low as candle-like full bars instead of Open and Close. There are no wicks, only full bars highlighting High and Low of the select time frame. Two dots inside a bar will represent Open (Red dot) and Close (Green dot).
How can it help you as a trader?
High and Low candle-like bars will clear the noise from charts in identifying support & resistance, higher-highs and lower-lows will be clearly visible thus helping you make trades.
First add the indicator and then hover the mouse pointer over the ticker in the charts and click on the “eye-shaped” symbol to hide the candlesticks chart pattern.
The type of chart layout is standard charts. Data are not re-calculated or manipulated.
Regards!
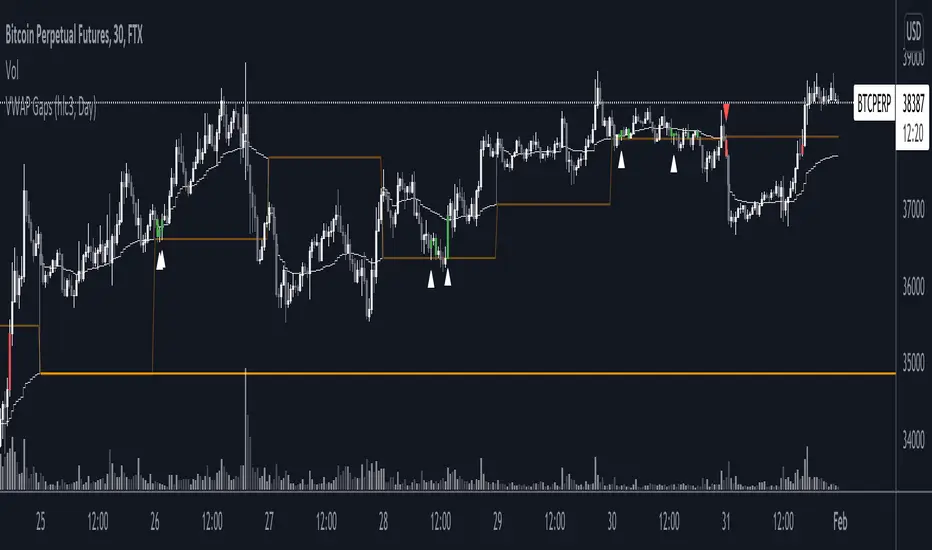
VWAP GapsTheory of untested previous VWAPs acting in similar way to nPOC, where agreed previous 'value' based on volume acts as a liquidity area to be retested.
Indicator shows
- User selected VWAP
- Untested previous VWAPs. The line will disappear once price crosses it's value
- Sweeps of previous VWAPs. Show by both bar colours and plotted arrows under different conditions.
Sweep Filters
1. Bull or Bear Bar (required for an arrow plot)
2. Sweep Conditions i.e. open below line, high above line, and close below line
3. If current VWAP is below/above the previous VWAP value.
Levels Of Greed
The Levels Of Greed indicator is based on the same idea as the Levels Of Fear one and was suggested by several traders in the comment section. It helps analyze price advances to find the best levels for closing a long position in an asset after a quick surge or longer up-trend. In finance, volatility is a term that describes the degree of variation of an asset price over time. It is usually denoted by the letter σ (sigma) and estimated as the standard deviation of the asset price or price returns. The Levels Of Greed indicator helps measure the current price advance in the standard deviation units. It plots seven levels at distances of 1, 2, 3, 4, 5, 6, and 7 standard deviations (sigmas) above the base price (the recent lowest price or lower bound of the established range). In what follows, we will refer to these levels as levels of greed.
HOW TO USE
When the price in its surge reaches a certain level of greed, it means that it has surged from its recent lowest value by a corresponding number of standard deviations. The indicator helps traders see the maximum levels to which the price may rise and estimate the potential height of the current surge. Five-seven sigma surges are relatively rare events and correspond to significant market exuberance. Careful traders and shorter-term ones would not want to participate in the bandwagon effect and herd behavior that drive market bubbles. They prefer to take their profits when the market is not exceedingly overbought.
SETTINGS
Window : the averaging window or period of the indicator. The algorithm uses this parameter to calculate the base level and standard deviations. Higher values are better for measuring deeper and longer surges.
Levels Stability : the parameter used in the up-move detection. The higher the value is, the more stable and long the greed levels are, but at the same time, the lag increases. The lower it is, the faster the indicator responds to the price changes, but the greed levels are recalculated more frequently and are less stable. This parameter is mostly for fine-tuning. It does not change the overall picture much.
Mode : the parameter that defines the style for the labels. In the Cool Guys Mode, the indicator displays the labels as emojis. In the Serious Guys Mode, labels show the distance from the base level measured in standard deviation units or sigmas.

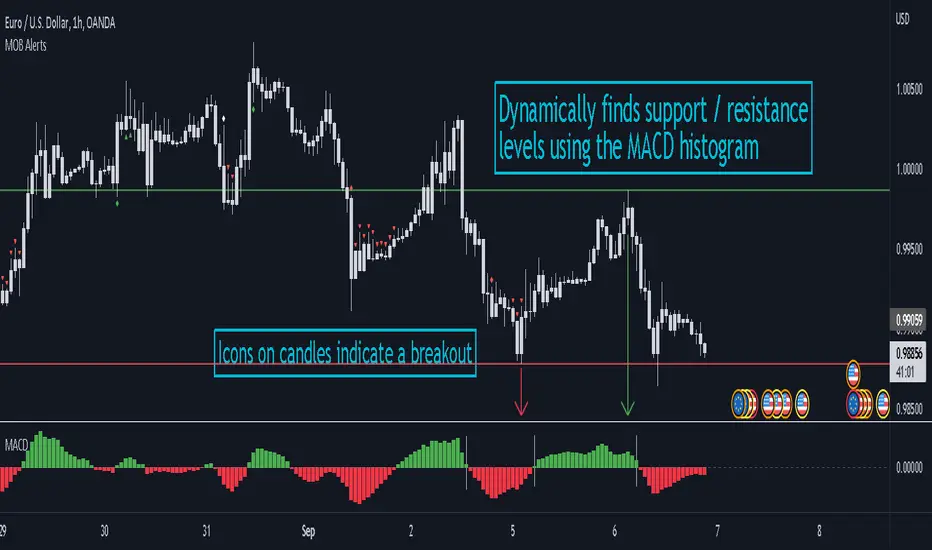
MACD Objective Breakouts + AlertsFinds the most recent support and resistance level as confirmed by the MACD . These level are detected dynamically and the lines will be updated as new levels form.
Alerts can be toggled on or off in the settings but will not work if the alert is not added to your chart. Alerts can be added by selecting the "Alert" button on TradingView then selecting "MOB Alerts" as the condition
Alerts will trigger when price closes above or below the indicated levels.
Please let me know if you find any bugs!
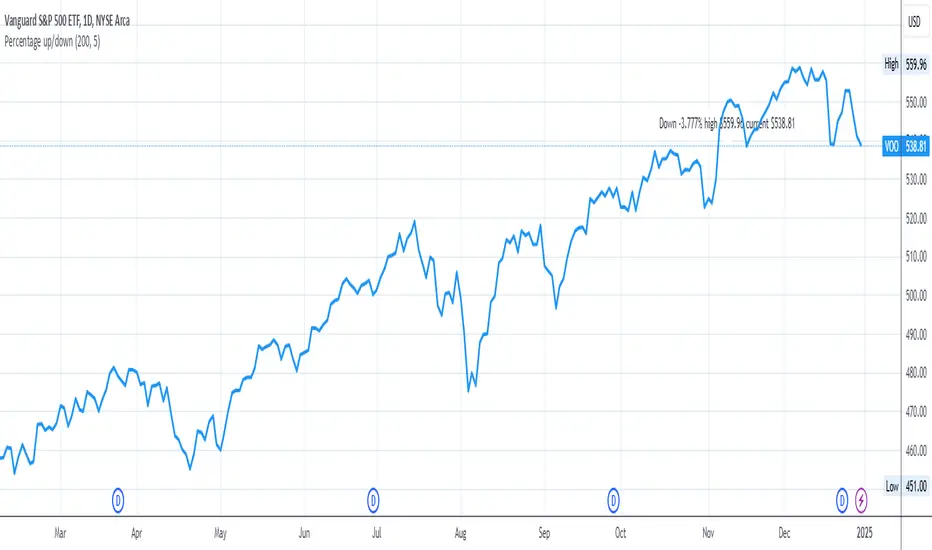
Percentage up/downIn order to buy stocks, I want to know how much the stock went down from the all-time high price. Therefore, this script shows how much the current stock has dropped from the all-time high.
You can change:
- how many periods to get the all-time high from
- location on the y-axis to place the label on the chart
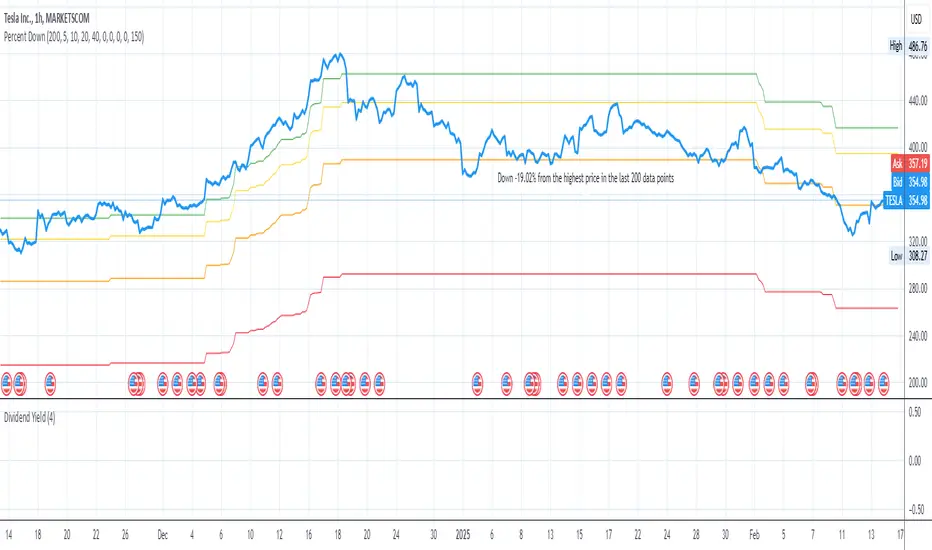
Price Target Pullback Correction or BearPrice Target percent drop is an indicator that allows you to set default percentage down from the 52 week high.
A pullback, correction, bear and a bear market is marked as a 5%, 10%, 20% or 40% drop from the 52 week highest price, so this will show the target price to buy at if these thresholds are hit.
You can change the default values of 5%, 10%, 20% and 40% to any percentage and the price will reflect the change of the default value. Furthermore, the default to use 52 weeks can be changed to find the highest price from the last 26 weeks or 104 weeks.
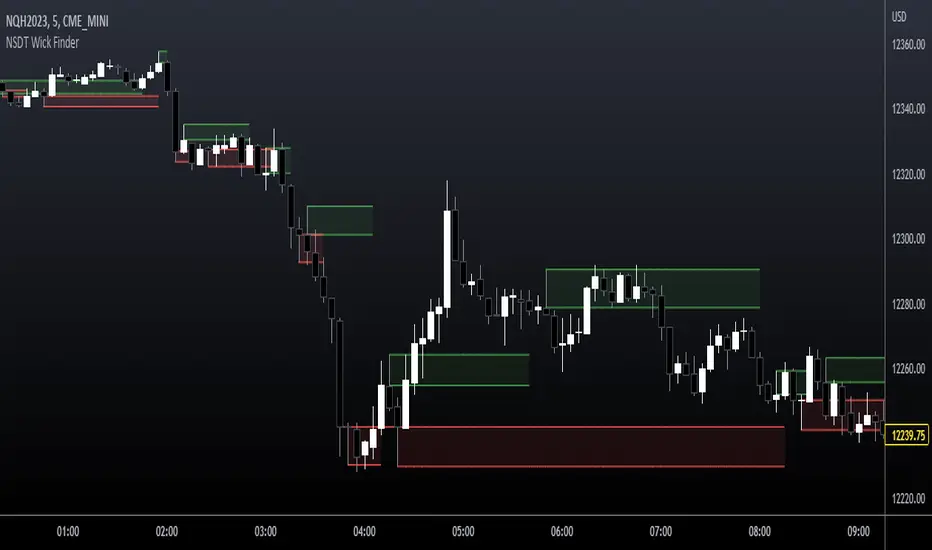
NSDT Wick FinderThis script finds wicks that are longer than the candle body and marks them as potential trading zones to be revisited. Lines, shading, and lookback can all be modified.
Full credit for original code goes to @Squam_Gobaloochee. We updated to Pinescript V5 and cleaned up code. We reached out to original for permission to repost publicly and open source.
Levels Of Greed [AstrideUnicorn]The Levels Of Greed indicator is based on the same idea as the Levels Of Fear one and was suggested by several traders in the comment section. It helps analyze price advances to find the best levels for closing a long position in an asset after a quick surge or longer up-trend. In finance, volatility is a term that describes the degree of variation of an asset price over time. It is usually denoted by the letter σ (sigma) and estimated as the standard deviation of the asset price or price returns. The Levels Of Greed indicator helps measure the current price advance in the standard deviation units. It plots seven levels at distances of 1, 2, 3, 4, 5, 6, and 7 standard deviations (sigmas) above the base price (the recent lowest price or lower bound of the established range). In what follows, we will refer to these levels as levels of greed.
HOW TO USE
When the price in its surge reaches a certain level of greed, it means that it has surged from its recent lowest value by a corresponding number of standard deviations. The indicator helps traders see the maximum levels to which the price may rise and estimate the potential height of the current surge. Five-seven sigma surges are relatively rare events and correspond to significant market exuberance. Careful traders and shorter-term ones would not want to participate in the bandwagon effect and herd behavior that drive market bubbles. They prefer to take their profits when the market is not exceedingly overbought.
SETTINGS
Window : the averaging window or period of the indicator. The algorithm uses this parameter to calculate the base level and standard deviations. Higher values are better for measuring deeper and longer surges.
Levels Stability : the parameter used in the up-move detection. The higher the value is, the more stable and long the greed levels are, but at the same time, the lag increases. The lower it is, the faster the indicator responds to the price changes, but the greed levels are recalculated more frequently and are less stable. This parameter is mostly for fine-tuning. It does not change the overall picture much.
Mode : the parameter that defines the style for the labels. In the Cool Guys Mode , the indicator displays the labels as emojis. In the Serious Guys Mode , labels show the distance from the base level measured in standard deviation units or sigmas.

Nearest Percentile Moving Average BandsWhile coding some filters into another indicator for Long/Short I noticed that ta.nearest.percentile might be the most useful tool in pinescript I've ever encountered.
While percentile_nearest can be used for all kind of things I decided to code moving averages from it and made bands for bottom percentage and top percentage.
The indicator will calculate the top % price of the given bar length.
Example settings:
length: 150
percentile: 99
So when using 99% it will draw a green line when price is moving above the top 1% price of the last 150 candles. It then calculates if the price is below the bottom 1% of the last 150 candles.
Trading use:
Use this indicator to check if the market is leaving normal territory. This signals a breakout move for example the dogecoin pump or the top of the range. I use this indicator to catch bull/bear moves for botting purposes. An other use would be to countertrend trade after the move has ended. With price being in top 1% for a while it is very probable that we see a large correction.
Below example of dogecoin pumps:

XABCD Harmonic Pattern Custom Range Interactive█ OVERVIEW
This indicator was designed based on Harmonic Pattern Book written by Scott Carney. It was simplified to user who may always used tools such as XABCD Pattern and Long Position / Short Position, which consume a lot of time, recommended for both beginner and expert of Harmonic Pattern Traders. XABCD Pattern require tool usage of Magnet tool either Strong Magnet, Week Magnet or none, which cause error or human mistake especially daily practice.
Simplified Guideline by sequence for Harmonic Pattern if using manual tools :
Step 1 : Trade Identification - XABCD Pattern
Step 2 : Trade Execution - Any manual tools of your choice
Step 3 : Trade Management - Position / Short Position
█ INSPIRATION
Inspired by design, code and usage of CAGR. Basic usage of custom range / interactive, pretty much explained here . Credits to TradingView.
I use a lot of XABCD Pattern and Long Position / Short Position, require 5 to 10 minutes on average, upon determine the validity of harmonic pattern.
Upon creating this indicator, I believed that time can be reduced, gain more confidence, reduce error during drawing XABCD, which helps most of harmonic pattern users.
█ FEATURES
Table can positioned by any postion and font size can be resized.
Table can be display through optimized display or manual control.
Validility of harmonic pattern depends on BC ratio.
Harmonic pattern can be displayed fully or optimized while showing BC ratio validity.
Trade Execution at point D can be displayed on / off.
Stop Loss and Take Profit can be calculated automatically or manually.
Optimized table display based extend line setup and profit and loss setup.
Execution zone can be offset to Point C, by default using Point D.
Currency can be show or hide.
Profit and Loss can be displayed on axis once line is extended.
█ HOW TO USE
Step 1 : Trade Identification - Draw points from Point X to Point C. Dont worry about magnet, point will attached depends on High or Low of the candle.
Step 2 : Trade Execution - Check the validity of BC to determine the validity of harmonic pattern generated. Pattern only generate 1 pattern upon success. Otherwise, redraw to other points.
Step 3 : Trade Management - Determine the current candle either reach Point D or Potential Reversal Zone (PRZ). Check for Profit & Loss once reach PRZ.
█ USAGE LIMITATIONS
Harmonic Patterns only limits to patterns mentioned in Harmonic Trading Volume 3 due to other pattern may have other or different philosophy.
Only can be used for Daily timeframe and below due to bar_time is based on minutes by default.
Not recommended for Weekly and Monthly timeframe.
If Point X, A, B, C and D is next to each other, it is recommend to use lower timeframe.
Automated alert is not supported for this release. However, alert can be done manually. Alert will updated on the version.
█ PINE SCRIPT LIMITATIONS
Known bug for when calculate time in array, causing label may not appeared or offset.
Unable to convert to library due to usage of array.get(). I prefer usage for a combination of array.get(id, 0), array.get(id, 1), array.get(id, 2) into custom function, however I faced this issue during make arrays of label. Index can be simply refered as int, for id, i not sure, already try id refered as simple, nothing happens.
linefill.new() will appeared as diamond box if overused.
Text in box.new() unable to use ternary condition or switch to change color. Bgcolor also affected.
Label display is larger than XABCD tool. Hopefully in future, have function to resize label similar to XABCD tools.
█ IMPORTANTS
Trade Management (Profit & Loss) is calculated from Point A to D.
Take Profit is calculated based on ratio 0.382 and 0.618 of Point A to D.
Always check BC validity before proceed to Trade Management.
Length of XABCD is equal to XAB plus BCD, where XAB and BCD are one to one ratio. Length is measured in time.
Use other oscillator to countercheck. Normally use built-in Relative Strength Index (RSI) and Divergence Indicator to determine starting point of Point X and A.
█ HARMONIC PATTERNS SUPPORTED
// Credits to Scott M Carney, author of Harmonic Trading Volume 3: Reaction vs. Reversal
Alt Bat - Page 101
Bat - Page 98
Crab - Page 104
Gartley - Page 92
Butterfly - Page 113
Deep Crab - Page 107
Shark - Page 119 - 220
█ FAQ
Pattern such as 5-0, perfect XABCD and ABCD that not included, will updated on either next version or new release.
Point D time is for approximation only, not including holidays and extended session.
Basic explaination for Harmonic Trading System (Trade Identification, Trade Execution and Trade Management).
Harmonic Patterns values is pretty much summarized here including Stop Loss.
Basic explanation for Alt Bat, Bat, Crab, Gartley, Deep Crab and Butterfly.
█ USAGE / TIPS EXAMPLES (Description explained in each image)

SVDThis indicator aims to compare between two charts if trader isn't sure which one is more active and powerful, it does NOT show entries or help your chart analysis directly.
The main features of this indicator is to show vitality and range of any given chart.
Volatility: it calculates the average profit of every swing in the range and the final result will be the chart volatility, which indicate how profitable this chart is.
Range: it calculates the profit of the whole range compared to the total price. (E.g. range bottom is 0.1 and range top is 0.2 the range will be 100%)
Extra: indicator shows the total direction of the chart in term of (STRONG UPTREND, UPTREND, SIDEWAYS, DOWNTREND, STRONG DOWNTREND), if you got (Somthing_wrong) please contact me.
How to use: apply the indicator on different charts that you have chosen and the higher (volatility & range) the more profitable the chart is.
inputs:
Lookback length: how long the range is (how many candles are included).
How intense should the Swing be: how many candles should be counted as a confirmation complete swing.
Show counted Swings: if checked as true, will show the swings counted in the volatility calculation.
For any notes on the indicator to be edited, or for another indicator ideas please comment.

Swing Pivots High LowBINANCE:BTCUSDT
This indicator is an opensource merge of the built in 'Pivot Points High Low' and the most popular 'Swing-high-low-support-resistance' indicators. The original 'Pivot Points High Low' does not have extensions with better visibility, while the most popular 'Swing-high-low-support-resistance' has no source available. I've also added additional configurable alert conditions for Pivot High and Low Crossover/Crossunder.
Please read the official documentation for further information about the indicator.

K's EnvelopesTrading is all about finding reactionary levels from where we assume prices will take a certain direction. And from that assumption, we initiate either a long (Buy) position or a short (Sell) position. Many techniques can be used to find support and resistance levels such as pivot points, Fibonacci retracements, and graphical levels. However, these techniques are all static in time, i.e. they do not move with real time data. In contrast, moving averages are dynamic and do a great job at finding support and resistance levels.
The idea of K's Envelopes is to form support and resistance zones so that we find good entry points. It is a combination of two 800-period moving averages where one is applied to the highs and the other applied to the lows, thus forming a moving zone used to support or place a ceiling on the market price.
