ORB Sessions w/ MidlineORB Sessions with Midline – Customizable Opening Range Breakout Indicator
📌 Overview:
This indicator allows traders to visualize Opening Range Breakout (ORB) sessions with customizable high, low, and midline levels. It supports both predefined ORB sessions and user-defined custom sessions. The ORB levels update in real-time and are automatically hidden on higher timeframes.
🔹 Features:
✅ Predefined ORB Sessions – Toggle commonly used ORB periods to match your strategy.
✅ Custom ORB Sessions – Define up to three additional ORB sessions with custom start and end times.
✅ Live ORB Updates – ORB high, low, and midline update dynamically as bars close within the session.
✅ Customizable Colors & Labels – Set unique colors for high, midline, and low levels, and enable/disable price labels.
✅ Smart Timeframe Filtering – ORB lines automatically hide on higher timeframes when they exceed the ORB duration.
✅ Futures Market Adjustments – Automatically shifts ORB session times for NQ, ES, YM, RTY, and M2K to align with market hours.
🛠️ How to Use:
1️⃣ Enable ORB Sessions – Select which predefined sessions you want to track.
2️⃣ Customize Your Own ORBs – Define up to three custom ORB sessions with specific start and end times.
3️⃣ Adjust Visualization – Modify ORB colors and labels for better chart clarity.
4️⃣ Trade ORB Breakouts – Use these key levels to identify potential breakouts, reversals, and trend continuation setups.
Destek ve Direnç

Advanced Support and Resistance Levels[MAP]Advanced Support and Resistance Levels Indicator
Author
Developed by:
Overview
The "Advanced Support and Resistance Levels" indicator, created, is a sophisticated tool designed for TradingView's Pine Script v6 platform. It identifies and plots key support and resistance levels on a price chart, enhancing technical analysis by incorporating pivot strength, volume weighting, and level decay. The indicator overlays lines, zones, and labels on the chart, providing a visual representation of significant price levels where the market has historically reversed or consolidated.
Purpose
This indicator, authored by , aims to:
Detect significant pivot points (highs and lows) with customizable strength requirements.
Track and rank support/resistance levels based on their recency, volume, and number of touches.
Display these levels as lines and optional zones, with strength-based visual cues (e.g., line thickness and opacity).
Offer flexibility through user-configurable settings to adapt to different trading styles and market conditions.
Features
Pivot Detection:
Identifies high and low pivots using a strength parameter, requiring a specified number of bars on either side where no higher highs or lower lows occur.
Incorporates closing price checks and SMA-based trend confirmation to filter out noise and ensure pivots align with the broader market direction.
Level Management:
Maintains a dynamic array of levels with attributes: price, type (support/resistance), bars since last touch, strength, and volume.
Merges nearby levels within a tolerance percentage, updating prices with a strength-weighted average.
Prunes weaker or older levels when exceeding the maximum allowed, prioritizing those with higher calculated strength.
Strength Calculation:
Combines the number of touches (strength), volume (if enabled), and age decay (if enabled) into a single metric.
Volume weighting uses a logarithmic scale to emphasize high-volume pivots without over-amplifying extreme values.
Age decay reduces the importance of older levels over time, ensuring relevance to current price action.
Visualization:
Draws horizontal lines at each level, with thickness reflecting the number of touches (up to a user-defined maximum).
Optional price zones around levels, sized as a percentage of the price, to indicate areas of influence.
Labels display the level type (S for support, R for resistance), price, and strength score, with position (left or right) customizable.
Line opacity varies with strength, providing a visual hierarchy of level significance.
Plots small triangles at detected pivot points for reference.
Inputs
Lookback Period (lookback, default: 20): Number of bars to consider for trend confirmation via SMA. Range: 5–100.
Pivot Strength (strength, default: 2): Number of bars required on each side of a pivot to confirm it. Range: 1–10.
Price Tolerance % (tolerance, default: 0.5): Percentage range for merging similar levels. Range: 0.1–5.
Max Levels to Show (maxLevels, default: 10): Maximum number of levels displayed. Range: 2–50.
Zone Size % (zoneSizePercent, default: 0.1): Size of the S/R zone as a percentage of the price. Range: 0–1.
Line Width (lineWidth, default: 1): Maximum thickness of level lines. Range: 1–5.
Show Labels (showLabels, default: true): Toggle visibility of level labels.
Label Position (labelPos, default: "Right"): Position of labels ("Left" or "Right").
Level Strength Decay (levelDecay, default: true): Enable gradual reduction in strength for older levels.
Volume Weighting (volumeWeight, default: true): Incorporate volume into level strength calculations.
Support Color (supportColor, default: green): Color for support levels.
Resistance Color (resistColor, default: red): Color for resistance levels.
How It Works
Pivot Detection:
Checks for pivots only after enough bars (2 * strength) have passed.
A high pivot requires strength bars before and after with no higher highs or closes, and a short-term SMA above a long-term SMA.
A low pivot requires strength bars before and after with no lower lows or closes, and a short-term SMA below a long-term SMA.
Level Tracking:
New pivots create levels with initial strength and volume.
Existing levels within tolerance are updated: strength increases, volume takes the maximum value, and price adjusts via a weighted average.
Levels older than lookback * 4 bars with strength below 0.5 are removed.
If the number of levels exceeds maxLevels, the weakest (by calculated strength) are pruned using a selection sort algorithm.
Drawing:
Updates on the last confirmed bar or in real-time.
Lines extend lookback bars left and right from the current bar, with thickness based on touches.
Zones (if enabled) are drawn symmetrically around the level price.
Labels show detailed info, with opacity tied to strength.
Usage
Add to Chart: Apply the indicator to any TradingView chart via the Pine Script editor, as designed by .
Adjust Settings: Customize inputs to match your trading strategy (e.g., increase strength for stronger pivots, adjust tolerance for tighter level merging).
Interpret Levels: Focus on thicker, less transparent lines for stronger levels; use zones to identify potential reversal areas.
Combine with Other Tools: Pair with trend indicators or oscillators for confluence in trading decisions.
Notes
Performance: The indicator uses arrays and sorting, which may slow down on very long charts with many levels. Keep maxLevels reasonable for efficiency.
Accuracy: Enhanced by trend confirmation and volume weighting, making it more reliable than basic S/R indicators, thanks to 's design.
Limitations: Real-time updates may shift levels as new pivots form; historical levels are more stable.
Example Settings
For day trading: lookback=10, strength=1, tolerance=0.3, maxLevels=5.
For swing trading: lookback=50, strength=3, tolerance=0.7, maxLevels=10.
Credits
Author: – Creator of this advanced support and resistance tool, blending precision and customization for traders.

+ Stochastic S/R ZonesHey, all. I have a new indicator here that displays zones on your price chart where the stochastic oscillator has moved out of overbought or oversold back into the range of the indicator that is bounded by those two levels.
I know there are many support and resistance indicators on TradingView already, at least a couple of which use the RSI in a similar way as I am using the stochastic here, but I still believe this is a fairly novel interpretation of the stochastic, and it is, in my opinion, a better oscillator than the RSI to be used in this way.
In addition to the zones being plotted on the chart, the indicator also, optionally, can color candles or plot shapes above candles when the 50 line is crossed, so if you want to use this as a simple momentum indicator without desire of having the below chart indicator taking up screen space, you're pretty much covered on the typical signals you might want from it (with the exception of %K / %D crosses, but there are alerts for that).
Visually, it is a simple, clean indicator. There are the zones, and then candle colors or shapes if you opt to add those. These zones are actually drawn from the candle preceding the cross over or cross under. Reason for that is often times the candle of the cross is fairly impulsive and exiting a consolidation. That period of consolidation is what is important to highlight, at least as far as I am concerned. The zones themselves extend until they are broken by a candle. A support zone stops at the candle that closes below its low. Vice versa for a resistance zone.
Usage is fairly simple. All the standard stochastic inputs are available for you to adjust to your heart's content. Additionally, you can choose either the %K or %D line to use as the source from which the zones are drawn, candles are colored, and shapes are plotted. Not sure if this will matter to most people, but I figured it should be made available.
This should be obvious, but I feel it must be said, just because an oscillator (any oscillator) has exited overbought or oversold does not mean that there must be a reversal (or in the case of a trend pullback, continuation). The oscillator can always simply immediately move back into overbought/sold. Just because a support box prints does not mean you should mortgage your house on a long trade. In strong trends, and depending on your oscillator settings, the indicator might draw a box then only a couple of candles later break it, continuing on with the trend. This of course is telling you something, and you would be wise to listen. As with all things trading, context is important.
Here are a few extra screens for you.
I really hope you all like this. It's been ages since I've created anything new, and despite its simplicity and the few lines of code that make it up, it took a lot of work, as I am a poor coder.
Enjoy,
Scott

Average Daily Range ProjectionsCreates a trailing high and low projection based on the Average Daily Range.
Track the Session High and Low to determine the Daily Range.
Average the Daily Range by a fixed Period to create an Average Daily Range .
Track the Prior Daily Range .
Track the Current Daily Range .
Track the % of Range completion relative to the CDR & ADR(P).
From the Session Low, project an Average Daily Range High by adding the ADR.
From the Session High, project an Average Daily Range Low by subtracting the ADR.
When %R reaches 100% or greater, the ADR HI & LO will lock, showing the range break out or break down. As the Session High and Low create the Daily Range, observe the reaction of price as it reaches the limit of the expected daily range.
On strongly trending days, CDR is likely greater than PDR and ADR(P). Price can break away.
On ranging days, %R may fail to reach 100% and CDR may be lesser than PDR and ADR(P). Price can bounce around within the bounds of ADR HI & LO.

Fibonacci Pivot Points & Previous D,W&M Highs/LowsIndicator Overview
This indicator combines Fibonacci Pivot Points with previous high and low levels for different timeframes (day, week, month). It plots these levels on the chart to provide traders with key support and resistance areas, making it easier to identify potential trading opportunities.
Features
Fibonacci Pivot Points:
The indicator calculates pivot points based on the high, low, and close prices.
Fibonacci levels are used to determine support (S1, S2, S3, S4, S5) and resistance (R1, R2, R3, R4, R5) levels.
Users can customize the Fibonacci levels for both support and resistance.
Previous Highs and Lows:
The indicator plots previous day, week, and month high and low levels.
Each of these lines can be customized in terms of visibility, color, and width.
This helps traders to see key historical levels that might act as support or resistance in the future.
Inputs and Customization:
Fibonacci Time Frame:
Users can select the timeframe for calculating the pivot points (Daily, Weekly, Monthly).
Fibonacci Levels:
Customizable input fields for each Fibonacci level (R1, R2, R3, R4, R5, S1, S2, S3, S4, S5).
Previous High/Low Lines:
Day Lines:
Options to show or hide previous day's high/low lines.
Customizable color and width for these lines.
Week Lines:
Options to show or hide previous week's high/low lines.
Customizable color and width for these lines.
Month Lines:
Options to show or hide previous month's high/low lines.
Customizable color and width for these lines.
Technical Calculations:
Fibonacci Pivot Points:
Calculated as:
pp = (High + Low + Close) / 3
S1 = pp - ((High - Low) * Fibonacci Level)
R1 = pp + ((High - Low) * Fibonacci Level)
Previous High/Low Levels:
Uses request.security to fetch previous high and low values for the selected timeframe.
Plotted using line.new to draw lines across the chart.
Plotting:
The indicator plots Fibonacci Pivot Points and previous high/low lines on the chart, using distinct colors for each level.
Customizable transparency and linewidths make it easier to visually interpret the levels.
This indicator is particularly useful for traders who rely on technical analysis to identify key support and resistance levels, offering a blend of historical data and Fibonacci-based predictions.
Feel free to ask if you have any specific questions or need further adjustments!

Heatmap Suite [PhenLabs]📊 Heatmap Suite
Version: PineScript™ v6
📌 Description
The Heatmap Suite is an advanced technical analysis tool that combines multiple density calculation methods with dynamic visualization to identify significant price levels and trading activity zones. It features a sophisticated analysis system that processes price and volume data through various kernel methods, providing traders with insights into market structure, support/resistance zones, and potential price reaction areas.
🚀 Points of Innovation:
Multi-method density calculation incorporating three distinct approaches
Adaptive visualization system with dynamic color gradients
Real-time dashboard with key market metrics
Significant level detection with automatic threshold adjustment
🚨 Important🚨
🔸Comprehensive tooltips included in the PhenLabs dashboard for in depth guidance
🔧 Core Components
Density Analysis: Multiple calculation methods for price distribution assessment
Heat Mapping: Dynamic visualization of price congestion zones
Level Detection: Automatic identification of significant price levels
Dashboard System: Real-time market metrics and analysis
🔥 Key Features
The indicator provides comprehensive analysis through:
Kernel Density: Traditional balanced view of price distribution
Exponential Kernel: Time-weighted analysis emphasizing recent price action
Volume-Weighted: Focus on high-volume price areas
Significant Levels: Automatic detection of important price zones
Heat Distribution: Color-coded visualization of price congestion
🎨 Visualization
Heat Zones: Shows intensity of price activity
Significant Lines: Key level indicators
Color Gradients: Indicates density strength
Dashboard Display: Real-time metrics
Dynamic Opacity: Reflects density intensity
📖 Usage Guidelines
The indicator offers several customization options:
Basic Settings:
Calculation Method: Choose between three density calculation approaches
Lookback Period: Analysis timeframe adjustment
Zone Count: Price range division granularity
Heat Sensitivity: Contrast adjustment for visualization
🎛️ Visual Settings:
Dashboard Size: Text size customization
Position: Dashboard placement options
Color Scheme: Heat map gradient visualization
Level Display: Significant price zone indicators
✅ Best Use Cases:
Identify strong support/resistance zones through high-density areas
Spot potential price reversal zones at significant levels
Analyze price congestion patterns
Monitor real-time changes in market structure
⚠️ Limitations
Requires sufficient historical data
Computational intensity increases with longer lookback periods
Heat sensitivity needs adjustment based on market conditions
Dashboard placement may need adjustment based on price action
💡 What Makes This Unique
Multi-method Analysis: Three distinct calculation approaches
Adaptive Visualization: Dynamic color gradient system
Real-time Metrics: Comprehensive dashboard display
Automatic Level Detection: Significant price zone identification
Memory-efficient Design: Optimized calculation methods
🔬 How It Works
The indicator processes market data through four main components:
1. Density Calculation:
Processes price and volume data
Applies selected kernel method
Generates density distribution
2. Heat Mapping:
Converts density values to color gradients
Updates visualization in real-time
Displays price congestion zones
3. Level Detection:
Identifies significant price levels
Applies threshold filtering
Marks important zones
4. Dashboard Updates:
Calculates real-time metrics
Updates display components
Provides market context
💡Note:
The indicator performs best with adequate historical data and proper sensitivity settings. Its sophisticated density analysis provides valuable insights into market structure beyond traditional support/resistance indicators.

AEST High-Low MarkerOverview
This TradingView indicator, AEST High-Low Marker, is designed to mark the highest and lowest price levels observed between 5:00 PM and 6:00 PM AEST and extend these levels visually on the chart only between 5:00 PM and 12:00 AM AEST.
Functionality
Time Conversion for AEST
Since TradingView operates in UTC, the script translates AEST (UTC+10 or UTC+11 during daylight savings) into UTC time.
The script starts tracking from 5:00 PM AEST (7 AM UTC) to 6:00 PM AEST (8 AM UTC).
The high and low lines will be displayed only between 5:00 PM and 12:00 AM AEST (7 AM to 2 PM UTC).
Real-Time High & Low Calculation
The indicator dynamically updates the session high and low as new candles form during the 5 PM - 6 PM AEST period.
It captures the maximum high and minimum low during this timeframe.
Line Display Restrictions
The session high and low lines will only be drawn between 5:00 PM and 12:00 AM AEST to prevent chart clutter.
The lines disappear after 12:00 AM AEST.
Visual Representation
Blue Line: Marks the session high recorded between 5 PM - 6 PM AEST.
Red Line: Marks the session low recorded between 5 PM - 6 PM AEST.
Both lines extend until 12 AM AEST and then disappear.
Use Case
This indicator is useful for traders looking to track key price levels formed between 5 PM and 6 PM AEST and observe how price interacts with these levels until midnight.
It is particularly beneficial for intraday and short-term trading strategies, allowing users to identify potential support and resistance zones based on early evening price action.

Multi-Timeframe 200 EMAMulti-Timeframe 200 EMA Indicator
Description:
This indicator plots the 200-period Exponential Moving Average (EMA) from multiple timeframes on a single chart. It allows traders to visualize key trend levels across different timeframes, helping with confluence, trend identification, and potential trade setups.
Key Features:
Multi-Timeframe EMAs: Displays the 200 EMA from the 2m, 5m, 15m, 30m, 1hr, and 4hr timeframes, regardless of the chart's current timeframe.
Dynamic Labeling: Each EMA is labeled with its respective timeframe (e.g., "2m", "1hr", "4hr") and the labels update in real-time, staying on the current EMA value.
Auto-Updating Labels: The labels move with the EMAs as new candles form, ensuring a clean and informative display. Old labels automatically disappear to prevent clutter.
Color-Coded EMAs: Each EMA has a unique color, making it easy to differentiate between timeframes.
How to Use This Indicator in Trading:
Trend Confirmation: If price stays above the higher timeframe 200 EMA (e.g., 1hr, 4hr), it suggests an uptrend; below it suggests a downtrend.
Support & Resistance Zones: The 200 EMA from larger timeframes often acts as strong dynamic support or resistance.
Multi-Timeframe Confluence: If multiple EMAs are aligned in the same direction, it strengthens the trend bias.
Reversal or Breakout Signals: When price crosses above or below a higher timeframe EMA, it could indicate a potential trend change or breakout opportunity.
Best Used For:
🔹 Scalpers & Day Traders: Helps identify intraday trends and key levels across multiple timeframes.
🔹 Swing Traders: Useful for aligning trade setups with higher timeframe trends.
🔹 Trend Followers: Provides confirmation of long-term trends using the 200 EMA.

Correction Table# Correction Table Indicator
A powerful TradingView indicator that displays a comprehensive table showing price corrections from All-Time High (ATH) and the 200-day Simple Moving Average (SMA).
## Features
- Real-time calculation of 200-day Simple Moving Average (SMA)
- Display of current price deviations from 200 SMA
- ATH-based correction levels (-10%, -20%, -30%, -40%, -50%)
- Clear visualization through a customizable table
- Price differences shown in both absolute and percentage terms
- Color-coded positive/negative deviations for better readability
## Parameters
- **ATH Calculation Period**: Number of days to look back for calculating All-Time High (default: 90 days)
## Table Information
The indicator displays a table in the top-right corner of your chart with the following information:
- **200 SMA**: Current 200-day Simple Moving Average value
- **ATH-10%**: Price level at 10% below All-Time High
- **ATH-20%**: Price level at 20% below All-Time High
- **ATH-30%**: Price level at 30% below All-Time High
- **ATH-40%**: Price level at 40% below All-Time High
- **ATH-50%**: Price level at 50% below All-Time High
Each row shows:
- Target price level
- Current deviation from the price
- Percentage deviation

Timeframe Display Table with CustomizationsPlaces a single cell table in the top right of the chart to display the currently viewed timeframe at all times on the chart.

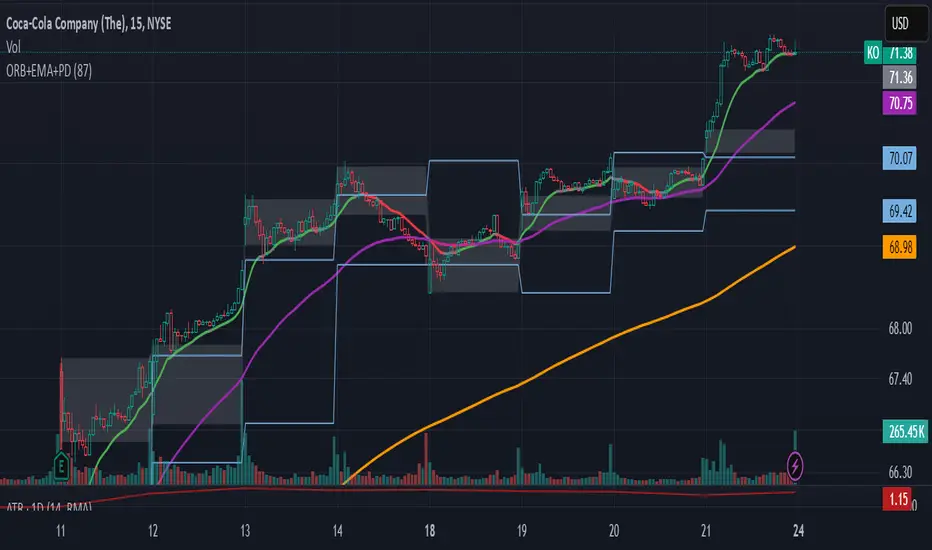
ORB-5Min + Adaptive 12/48 EMA + PDH/PDL
Overview:
This indicator combines the 5-Minute Opening Range Breakout (ORB), Adaptive 12/48 Exponential Moving Averages (EMAs), and Previous Day High/Low (PDH/PDL) levels to help traders identify key intraday levels and market trends.
Key Components and Logic:
5-Minute Opening Range Breakout (ORB):
Displays the high and low from the first 5-minute candle of the trading session.
Includes customizable opacity for the range fill.
Helps traders spot breakout opportunities and key support/resistance zones.
Adaptive 12/48 EMA System:
Displays EMAs for 9, 12, 48, and 200 periods.
The 12 EMA changes color based on whether the price is entirely above or below it.
The 48 EMA changes color depending on its relationship with the 12 EMA.
Provides dynamic trend identification and potential entry/exit signals.
Previous Day High/Low (PDH/PDL):
Displays the previous day’s high and low levels.
Useful for tracking key intraday support/resistance levels and potential reversal points.
Summary:
This script stands out by blending three popular intraday tools into a single comprehensive indicator. The combined visualization provides a layered market context that assists traders in making informed decisions quickly. The color-adaptive EMAs add clarity to trend direction, while the ORB and PDH/PDL levels highlight significant price zones for breakout or reversal trades.
How to Use:
Breakout Trades: Watch for price breaks above the ORB high or below the ORB low, especially when supported by EMA trends.
Trend Confirmation: Use the color-adaptive 12/48 EMA system to gauge momentum and market direction.
Reversal or Continuation: Observe how price reacts around PDH/PDL levels, especially if confluence with EMAs occurs.
This indicator is suitable for day traders seeking a clear and efficient way to track market structure, identify trends, and spot potential trade opportunities during regular market hours.
Adaptive Supply and Demand [EdgeTerminal]Adaptive Supply and Demand is a dynamic supply and demand indicator with a few unique twists. It considers volume pressure, volatility-based adjustments and multi-time frame momentum for confidence scoring (multi-step confirmation) to generate dynamic lines that adjust based on the market and also to generate dynamic support/resistance levels for the supply and demand lines.
The dynamic support and resistance lines shown gives you a better situational awareness of the current state of the market and add more context to why the market is moving into a certain direction.
> Trading Scenarios
When the confidence score is over 80%, strong volume pressure in trend direction (up or down), volatility is low and momentum is aligned across timeframes, there is an indication of a strong upward or downward trend.
When the supply and demand line crossover, the confidence score is over 75% and the volume pressure is shifting, this can be an indicator of trend reversal. Use tight initial stops, scale into position as trend develops, monitor the volume pressure for continuation and wait for confidence confirmation.
When the confiance score is below 60%, the volume pressure is choppy, volatility is high, you want to avoid trading or reduce position size, wait for confidence improvements, use support and resistance for entries/exits and use tighter stops due to market conditions. This is an indication of a ranging market.
Another scenario is when there is a sudden volume pressure increase, and a raising confidence score, the volatility is expanding and the bar momentum is aligning the volatility direction. This can indicate a breakout scenario.
> How it Works
1. Volume Pressure Analysis
Volume Pressure Analysis is a key component that measures the true buying and selling force in the market. Here's a detailed breakdown. The idea is to standardize volume to prevent large spikes from skewing results.
The indicator employs an adaptive volume normalization technique to detect genuine buying and selling pressure.
It takes current volume and divides it by average volume.
If normVol > 1: Current volume is above average
If normVol < 1: Current volume is below average
An example if this would be If current volume is 1500 and average is 1000, normVol = 1.5 (50% above average)
Another component of the volume pressure analysis is the Price Change Calculation sub-module. The purpose of this is to measure price movement relative to recent average.
It works by subtracting the average price from the current price. If the value is positive, price is average and if negative, price is below average.
Finally, the volume pressure is calculated to combine volume and price for true pressure reading.
2. Savitzky-Golay Filtering
SG filtering implements advanced signal smoothing while preserving important trend features. It uses weighted moving average approximation, preserves higher moments of data and reduces noise while maintaining signal integrity.
This results in smoother signal lines, reduced false crossovers and better trend identification. Traditional moving averages tend to lag and smooth out important features. Additionally, simple moving averages can miss critical turning points and regular smoothing can delay signal generation.
SG filtering preserves higher moments such as peaks, valleys and trends, reduces noise while maintaining signal sharpness.
It works by creating a symmetric weighting scheme. This way center points get the highest weights while edge points get the lowest weight.
3. Parkinson's Volatility
Parkinson's Volatility is an advanced volatility measurement formula using high-low range data. It uses high-low range for volatility calculation, incorporates logarithmic returns and annualized the volatility measure.
This results in more accurate volatility measurement, better risk assessment and dynamic signal sensitivity.
4. Multi-timeframe Momentum
This combines signals from each module for each timeframe to calculate momentum across three timeframes. It also applies weighted importance to each timeframe and generates a composite momentum signal.
This results in a more comprehensive trend analysis, reduced timeframe bias and better trend confirmation.
> Indicator Settings
Short-term Period:
Lower values makes it more sensitive, meaning it will generate more signals. Higher values makes it less sensitive, resulting in fewer signals. We recommend a 5 to 15 range for day trading, and 10 to 20 for swing trading
Medium-term Period:
Lower values result in faster trend confirmation and higher values show slower and more reliable confirmation. We recommend a range of 15-25 for day trading and 20-30 for swing trading.
Long-term Period:
Lower values makes it more responsive to trend changes and higher values are better for major trend identification. We recommend a range of 40-60 for day trading and 50-100 for swing trading.
Volume Analysis Window:
Lower values result in more sensitivity to volume changes and higher values result in smoother volume analysis. The optimal range is 15-25 for most trading styles.
Confidence Threshold:
Lower values generate more signals but quality decreases. Higher values generate fewer signals but accuracy increases.The optimal range is 0.65-0.8 for most trading conditions.

Reversal Probability Zone & Levels [LuxAlgo]The Reversal Probability Zone & Levels tool allows traders to identify a zone starting from the last detected reversal to highlight the probability of where the next reversal would be from a price and time perspective.
Price and time levels within the zone are displayed for up to 4 percentiles defined by the user.
🔶 USAGE
By default, the tool displays a zone with the 25th, 50th, 75th and 90th percentiles on both the price and time axis, indicating where, when and how many of the past reversals have occurred.
Traders can select the length for swing detection and the maximum number of reversals for probability calculations. The tool considers both bullish and bearish reversals separately, which means that if the last reversal was a swing high, the zone would show the probabilities for the last defined Maximum reversals
The Maximum reversals value has a direct impact on the probabilities, the more data traders use the more significant the result, probabilities over 10 occurrences are far weak compared to probabilities over 1000 occurrences.
🔹 Percentiles
Traders can fine-tune the percentile parameters in the settings panel.
A given percentile means that the number of occurrences in the data set is less than or equal to the percentile.
In English, this means
Percentile 20th: 20% of the occurrences are less than or equal to this value, so 80% of the occurrences are greater than this value.
Percentile 50th: 50% of the occurrences are below and 50% are above this value.
Percentile 80th: 80% of occurrences are lower than or equal to this value, so 20% of occurrences are greater than this value.
🔹 Normalize data
The Normalize Data feature allows traders to make an apples to apples comparison when we have a lot of historical data on high timeframe charts, using returns between swings instead of raw price.
🔹 Display Style
By default, the tool has the No overlapping feature enabled to display a clean chart, traders can turn it off, but this can fill the chart with too much information and barely see the price.
Traders can enable/disable settings to show only the last zone and the swing markers on the chart.
🔶 SETTINGS
Swing Length: The maximum length in bars used to identify a swing
Maximum Reversals: Maximum number of reversals included in calculations
Normalize Data: Use returns between swings instead of raw price
Percentiles: Enable/disable each of the four percentiles and select the percentile number, line style, colors, and size
🔹 Style
No Overlapping Zones: Enable or disable the No overlap between zones feature
Show Only Last Zone: Enable/disable display of last zone only
Show Marks: Enable/disable reversal markers

Enhanced Momentum Divergence Radar+ [Alpha Extract]Enhanced Momentum Divergence Radar+
The AE's Enhanced Momentum Divergence Radar+ is designed to detect momentum shifts and divergence patterns, helping traders identify potential trend reversals and continuation points. By normalizing momentum readings and applying divergence detection, it enhances market timing for entries and exits.
🔶 CALCULATION
The indicator calculates normalized momentum using a combination of Detrended Price Oscillator (DPO) and volatility-adjusted smoothing techniques. It highlights overbought and oversold conditions while identifying bullish and bearish divergences.
Core Calculation:
ATR-based volatility adjustment ensures dynamic sensitivity.
DPO is derived from the price minus a simple moving average (SMA) to isolate cyclical movements.
Momentum score is normalized using historical max values for consistent scaling.
Thresholds are dynamically adjusted based on average absolute momentum.
dpo = close - ma
sd = (dpo / volatility) * 100
normalizedSD = sd / maxAbsSD
The momentum score is plotted as a histogram, where:
Green bars indicate strong upward momentum.
Red bars indicate strong downward momentum.
Neutral values fade into gray.
🔶 DETAILS
📊 Visual Features:
Histogram bars dynamically color-coded based on momentum strength.
Threshold bands provide reference points for overbought and oversold levels.
Divergence markers (Bullish/Bearish & Hidden Bullish/Bearish) highlight key reversal signals.
🛠 How Divergences Work:
Bullish Divergence (𝓞𝓢): Price makes a lower low while momentum makes a higher low.
Bearish Divergence (𝓞𝓑): Price makes a higher high while momentum makes a lower high.
Hidden Divergences confirm trend continuations rather than reversals.
📌 Example of Divergence Logic:
bullishDiv = (low == priceLow) and (sd > momentumLow)
bearishDiv = (high == priceHigh) and (sd < momentumHigh)
🔶 EXAMPLES
📍 The chart below illustrates price reacting to momentum divergences, identifying potential tops and bottoms before major price moves.
📌 Example snapshots:
A bullish divergence leading to a reversal in price.
A bearish divergence marking the beginning of a downtrend.
🔶 SETTINGS
🔹 Customization Options:
Lookback Period: Adjusts sensitivity to market cycles.
Smoothing Period: Controls signal clarity.
Color Options: Enables bar coloring based on momentum strength.
Divergence Sensitivity: Choose to display hidden divergences.

Sma Indicator with Ratio (pr)SMA Indicator with Ratio (PR) is a technical analysis tool designed to provide insights into the relationship between multiple Simple Moving Averages (SMAs) across different time frames. This indicator combines three key SMAs: the 111-period SMA, 730-period SMA, and 1400-period SMA. Additionally, it introduces a ratio-based approach, where the 730-period SMA is multiplied by factors of 2, 3, 4, and 5, allowing users to analyze potential market trends and price movements in relation to different SMA levels.
What Does This Indicator Do?
The primary function of this indicator is to track the movement of prices in relation to several SMAs with varying periods. By visualizing these SMAs, users can quickly identify:
Short-term trends (111-period SMA)
Medium-term trends (730-period SMA)
Long-term trends (1400-period SMA)
Additionally, the multiplied versions of the 730-period SMA provide deeper insights into potential price reactions at different levels of market volatility.
How Does It Work?
The 111-period SMA tracks the shorter-term price trend and can be used for identifying quick market movements.
The 730-period SMA represents a longer-term trend, helping users gauge overall market sentiment and direction.
The 1400-period SMA acts as a very long-term trend line, giving users a broad perspective on the market’s movement.
The ratio-based SMAs (2x, 3x, 4x, 5x of the 730-period SMA) allow for an enhanced understanding of how the price reacts to higher or lower volatility levels. These ratios are useful for identifying key support and resistance zones in a dynamic market environment.
Why Use This Indicator?
This indicator is useful for traders and analysts who want to track the interaction of price with different moving averages, enabling them to make more informed decisions about potential trend reversals or continuations. The added ratio-based values enhance the ability to predict how the market might react at different levels.
How to Use It?
Trend Confirmation: Traders can use the indicator to confirm the direction of the market. If the price is above the 111, 730, or 1400-period SMA, it may indicate an uptrend, and if below, a downtrend.
Support/Resistance Levels: The multiplied versions of the 730-period SMA (2x, 3x, 4x, 5x) can be used as dynamic support or resistance levels. When the price approaches or crosses these levels, it might indicate a change in the trend.
Volatility Insights: By observing how the price behaves relative to these SMAs, traders can gauge market volatility. Higher multiples of the 730-period SMA can signal more volatile periods where price movements are more pronounced.

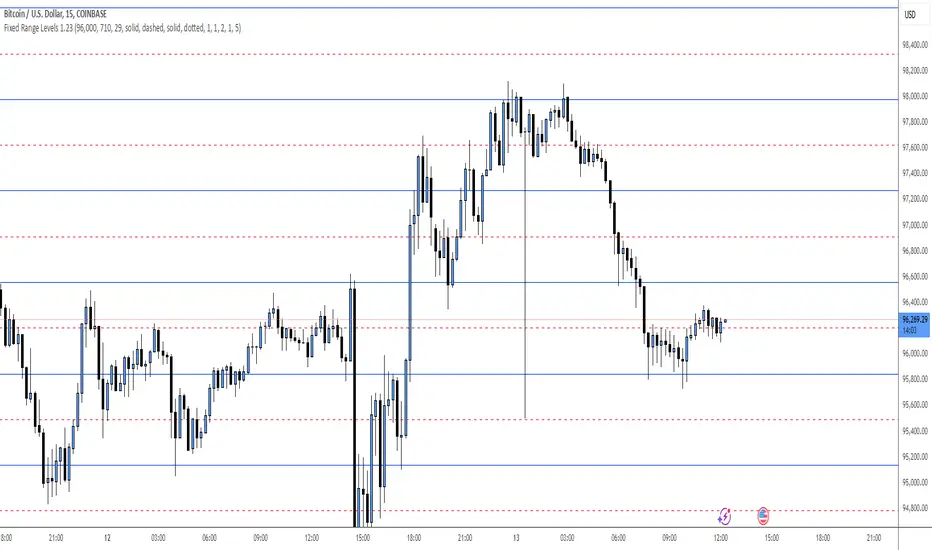
Fixed Range LevelsThis indicator draws horizontal price levels on your chart based on a starting price and a range size that you define. It can also draw midpoint lines between the main levels if enabled.
Here's a breakdown of its functionality:
Key Features:
Starting Price:
You define a starting price (e.g., 21630).
The indicator calculates a corrected base price by rounding the starting price to the nearest multiple of the range size.
Range Size:
You define a range size (e.g., 71).
The indicator draws horizontal lines at intervals of the range size above and below the corrected base price.
Dual Ranges:
You can define two range sizes (e.g., 71 and 29).
The indicator can draw levels for both ranges simultaneously or individually, depending on your settings.
Midpoint Lines:
If enabled, the indicator draws midpoint lines between the main levels.
For example, if the main levels are at 21584 and 21655, the midpoint line will be at 21619.5.
Customizable Styles:
You can customize the line style (solid, dotted, dashed) and color for both the main levels and midpoint lines.
Dynamic Levels:
The levels are recalculated and redrawn dynamically based on the starting price and range size.
How It Works:
Corrected Base Price Calculation:
The indicator calculates the corrected base price using the formula:
pinescript
Copy
correctedBasePrice = math.floor(startingPrice / rangeSize) * rangeSize
For example, if startingPrice = 21630 and rangeSize = 71:
Copy
correctedBasePrice = math.floor(21630 / 71) * 71 = 304 * 71 = 21584
Drawing Levels:
The indicator draws horizontal lines at intervals of the range size above and below the corrected base price.
For example, if rangeSize = 71 and maxLevels = 5, the levels will be drawn at:
Copy
21584 - (5 * 71) = 21249
21584 - (4 * 71) = 21320
...
21584 + (5 * 71) = 21939
Midpoint Lines:
If enabled, the indicator draws midpoint lines between the main levels.
For example, if the main levels are at 21584 and 21655, the midpoint line will be at:
Copy
(21584 + 21655) / 2 = 21619.5
Dual Ranges:
If you enable both ranges, the indicator will draw levels for both range sizes simultaneously.
For example, if rangeSize1 = 71 and rangeSize2 = 29, the indicator will draw two sets of levels:
Levels at intervals of 71 (e.g., 21584, 21655, 21726, ...).
Levels at intervals of 29 (e.g., 21634, 21663, 21692, ...).
Example Use Case:
Imagine you're trading a stock or cryptocurrency, and you want to identify key support and resistance levels based on a specific price range. Here's how you can use this indicator:
Set the Starting Price:
For example, if the current price is 21630, you can set this as the starting price.
Define the Range Size:
If you believe the price moves in increments of 71, set rangeSize1 = 71.
If you also want to track smaller increments of 29, set rangeSize2 = 29.
Enable Midpoint Lines:
If you want to see the midpoint between the main levels, enable Show Midpoint Line.
Customize Line Styles:
Choose different colors and styles for the main levels and midpoint lines to make them visually distinct.
Analyze the Chart:
The indicator will draw horizontal lines at the specified intervals, helping you identify potential support, resistance, and midpoint levels.
Why Is This Useful?
Support and Resistance Levels:
The horizontal lines act as dynamic support and resistance levels based on the range size you define.
Price Targets:
You can use the levels to identify potential price targets or areas where the price might reverse.
Midpoint Analysis:
The midpoint lines can help you identify areas of consolidation or potential breakout points.
Flexibility:
You can customize the range sizes, colors, and styles to suit your trading strategy.
Summary:
This indicator is a powerful tool for traders who want to visualize price levels and midpoints based on a specific range size. It helps you identify key levels for support, resistance, and potential price targets, making it easier to plan your trades.
Price Level Multi Timeframe [Snowdex]Price Level Multi-Timeframe Indicator
This indicator visualizes important price levels from multiple timeframes (e.g., daily, weekly, monthly) directly on the chart. It helps traders identify significant support and resistance levels for better decision-making.
Features:
Displays price levels for multiple timeframes: daily (1D), weekly (1W), monthly (1M), quarterly (3M), semi-annual (6M), and yearly (12M).
Customizable options to show or hide levels and adjust their colors.
Highlights high, low, and close levels of each timeframe with labels and dotted lines.
Includes options to extend levels visually for better clarity.
Benefits:
Easily compare price levels across timeframes.
Enhance technical analysis with multi-timeframe insights.
Identify key areas of support and resistance dynamically.

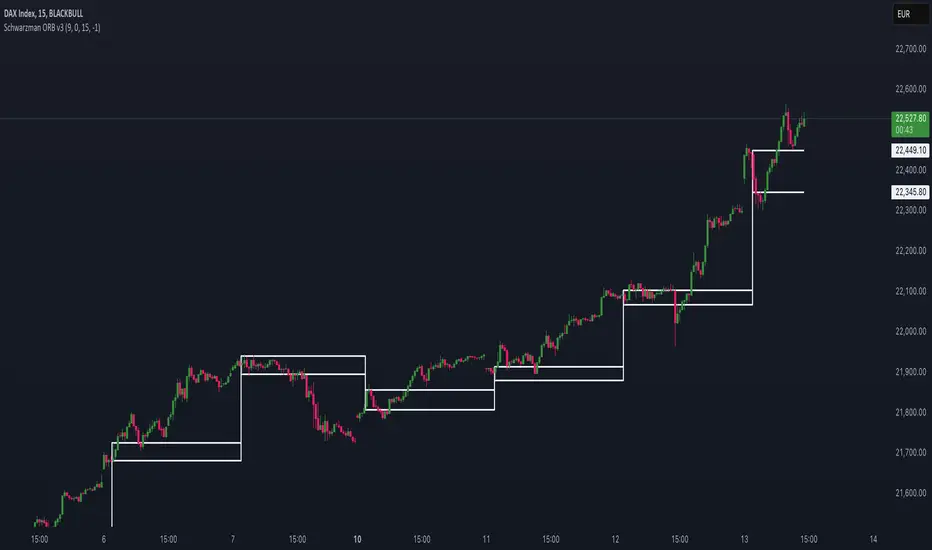
Schwarzman Custom ORB with Box DisplayIndicator Overview
The Schwarzman Custom ORB (Opening Range Breakout) Indicator is a fully self-developed script designed for traders who utilize opening range breakout strategies. This indicator allows users to customize their ORB settings, apply them to historical price data, and visually connect multiple ORBs to analyze past performance. The goal is to provide traders with a tool to backtest and refine their breakout strategies based on historical ORB data.
How the Indicator Works
1️⃣ User-Defined ORB Settings
• The user selects a custom start time (hour and minute) for the ORB.
• The user defines a duration (e.g., 15 minutes, 30 minutes, etc.) for the ORB period.
• A timezone offset is included to adjust for different market sessions.
2️⃣ ORB High and Low Calculation
• The script records the highest and lowest prices within the selected ORB time window.
• The recorded values remain static after the ORB period ends, ensuring accurate range plotting.
3️⃣ Historical ORB Visualization
• Instead of only showing a single ORB for the current session, this indicator connects multiple ORBs across past data.
• This allows traders to visually analyze previous breakout performance.
• The plotted ORBs remain fixed and do not repaint, ensuring an accurate backtesting experience.
4️⃣ Stepline Visualization & Range Filling
• The high and low ORB levels are displayed using stepline plots to maintain clear horizontal levels.
• A shaded box is applied between the ORB high and low for better visualization.
Use Cases & Strategy Application
📌 Backtesting Historical ORBs – See how past ORBs performed under different market conditions.
📌 Custom ORB Settings – Adjust the start time and duration for different trading sessions.
📌 Multi-ORB Analysis – Connect ORBs over multiple trading days to study trends and breakouts.
📌 Breakout Strategy Optimization – Use the historical ORB connections to refine entry and exit points.
This indicator is particularly useful for day traders, scalpers, and breakout traders looking for a data-driven approach to trading.
Indicator Development & Transparency Statement
As a trader, I have tested various ORB (Opening Range Breakout) indicators available in the TradingView community. Through these experiences, I aimed to develop a version that best fits my own trading needs and strategy.
This script is a self-developed ORB tool, created from scratch while drawing inspiration from the concept of opening range breakouts, which is widely used in trading. Since I initially coded in Pine Script v4, I used ChatGPT to help refine and migrate the script to Pine Script v6 to ensure compatibility with the latest TradingView features. However, the core logic, structure, and customization were entirely designed and implemented based on my own approach.
I am making this indicator public not to violate any TradingView guidelines but to share my work with the trading community and provide a tool that can help others analyze ORB-based strategies. If there are any compliance concerns, I am open to adjusting the script accordingly, but I want to clarify that this is not a copy of any existing ORB script—it is a custom-built indicator tailored to my own trading preferences.
I appreciate the opportunity to contribute to the community and would welcome any specific feedback from TradingView regarding rule compliance.
Best regards,
Janko S. (Schwarzman)
Appeal to TradingView
Dear TradingView Team,
This script is 100% self-developed and does not copy or replicate any third-party code. It is a customized ORB tool designed for traders who wish to backtest and analyze opening range breakout strategies over multiple sessions. We kindly request specific clarification regarding which exact line(s) of code violate TradingView’s guidelines. If there are any compliance concerns, we are happy to adjust the script accordingly.
Please let us know the precise rules or community guidelines that were violated so we can make the necessary modifications.
🚀 Summary
✔ Fully Custom & Self-Developed – No copied or third-party code.
✔ Innovative Feature – Connects past ORBs for strategy backtesting.
✔ Transparent & Compliant – Requesting exact details on any potential rule violations.
Market Structure HH, HL, LH and LLMarket Structure Indicator (HH, HL, LH, LL) – Explanation and Usage
Overview:
This indicator is designed to detect and visualize market structure shifts by identifying Higher Highs (HH), Higher Lows (HL), Lower Highs (LH), and Lower Lows (LL). It plots a ZigZag structure to mark trend changes, helping traders analyze price swings and market direction.
Indicator Logic:
The indicator operates based on ZigZag swing points to define trend shifts and structure changes.
Identifying Market Swings:
It finds local highs and lows using the ZigZag Length (zigzag_len), which defines how many bars back to check for a new swing high/low.
If the current high is the highest over zigzag_len periods, it marks it as a swing high.
If the current low is the lowest over zigzag_len periods, it marks it as a swing low.
Determining Market Structure:
Uptrend: Higher Highs (HH) & Higher Lows (HL)
Downtrend: Lower Lows (LL) & Lower Highs (LH)
The script continuously tracks the last two highs (h0, h1) and last two lows (l0, l1) to classify the current market structure.
Visual Elements:
ZigZag Line (Optional): Connects major swing highs and lows for trend visualization.
Labels (HH, HL, LH, LL):
HH (Higher High) – Price is making new highs → Uptrend Continuation.
HL (Higher Low) – Price forms a higher bottom → Uptrend Confirmation.
LL (Lower Low) – Price is making new lows → Downtrend Continuation.
LH (Lower High) – Price forms a lower top → Downtrend Confirmation.
Breakout Confirmation with Fibonacci Factor (Optional)
The indicator includes an option to confirm breakouts using the fib_factor, which ensures price moves beyond a certain retracement level.
How to Use This Indicator in Trading:
1. Identifying Trends & Trend Reversals
Uptrend: Look for a sequence of HH and HL.
Downtrend: Look for a sequence of LL and LH.
Trend Reversal: If price transitions from HH-HL to LH-LL, it signals a shift from an uptrend to a downtrend (and vice versa).
2. Confirming Entry & Exit Points
Buy Entry (Long Position)
Enter after a Higher Low (HL) is confirmed in an uptrend.
Combine with support zones or moving averages for confirmation.
Sell Entry (Short Position)
Enter after a Lower High (LH) is confirmed in a downtrend.
Combine with resistance zones or moving averages for confirmation.
Exit Strategy
Exit long trades when price fails to make a HH and forms an LH instead.
Exit short trades when price fails to make a LL and forms an HL instead.
3. Spotting Breakouts & Order Blocks
The Fib Factor setting allows traders to filter false breakouts by confirming price movement beyond a retracement threshold.
Potential Order Blocks can be identified by looking at the last major swing point before a breakout.
Benefits of This Indicator for Traders
✅ Trend Identification: Helps traders quickly determine if the market is in an uptrend or downtrend.
✅ Clear Market Structure Labels: Easily visualizes Higher Highs, Higher Lows, Lower Highs, and Lower Lows.
✅ Avoids Noise: The ZigZag algorithm removes small fluctuations and focuses on significant market movements.
✅ Assists with Entry & Exit Decisions: Provides objective signals for trend continuation or reversals.
✅ Works in All Markets: Useful for stocks, forex, crypto, and futures trading.
Would you like me to add additional features like Order Blocks, Breakout Confirmation, or Alerts to improve this indicator? 🚀

CandelaCharts - Fib Retracement (OTE) 📝 Overview
The CandelaCharts Fib Retracement (OTE) indicator is a precision tool designed to help traders identify Optimal Trade Entry (OTE) levels based on Fibonacci retracement principles, as taught in ICT (Inner Circle Trader) methodology.
This indicator automatically plots Fibonacci retracement levels between a selected swing high and swing low, highlighting the key OTE zone between the 61.8% and 78.6% retracement levels—a prime area for potential reversals in trending markets.
📦 Features
Automatic & Custom lookback modes
Customizable fib levels
Dynamic coloring
Reverse & extend
⚙️ Settings
Lookback: Controls the number of bars to look back. You can choose between **Automatic** or **Custom** mode.
Line Style: Sets the line style for the Fibonacci levels.
Levels: 0, 0.236, 0.0.382, 0.500, 0.620, 0.705, 0.790, 0.886, 1.000. Allows you to toggle the visibility of Fibonacci levels.
Dynamic Coloring: Colors Fibonacci levels according to trend direction.
Show Labels: Shows the price value at each Fibonacci level.
Reverse: Flips the Fibonacci levels in the opposite direction.
Extend Left: Extends the Fibonacci levels to the left.
⚡️ Showcase
Dynamic Coloring
Manual Coloring
Fib Retracement
Extended
Custom Length
📒 Usage
Using the CandelaCharts Fib Retracement (OTE) is pretty straightforward—just follow these steps to spot high-probability trade setups and refine your entries.
Identify the Trend – Determine whether the market is in an uptrend or downtrend.
Select Swing Points – The indicator automatically plots from the most recent swing high to swing low (or vice versa).
Wait for Price to Enter OTE Zone – Look for price action confirmation within the optimal entry zone (61.8%-78.6%).
Enter the Trade – Consider longs in an uptrend at the OTE zone, and shorts in a downtrend.
Set Stop & Target – Place stops below/above the swing low/high and target extension levels (127.2%, 161.8%).
🎯 Key takeways
The CandelaCharts Fib Retracement (OTE) is a must-have tool for traders looking to refine their entries and maximize risk-reward potential with precision-based ICT trading strategies. 🚀
🚨 Alerts
The indicator does not provide any alerts!
⚠️ Disclaimer
Trading involves significant risk, and many participants may incur losses. The content on this site is not intended as financial advice and should not be interpreted as such. Decisions to buy, sell, hold, or trade securities, commodities, or other financial instruments carry inherent risks and are best made with guidance from qualified financial professionals. Past performance is not indicative of future results.

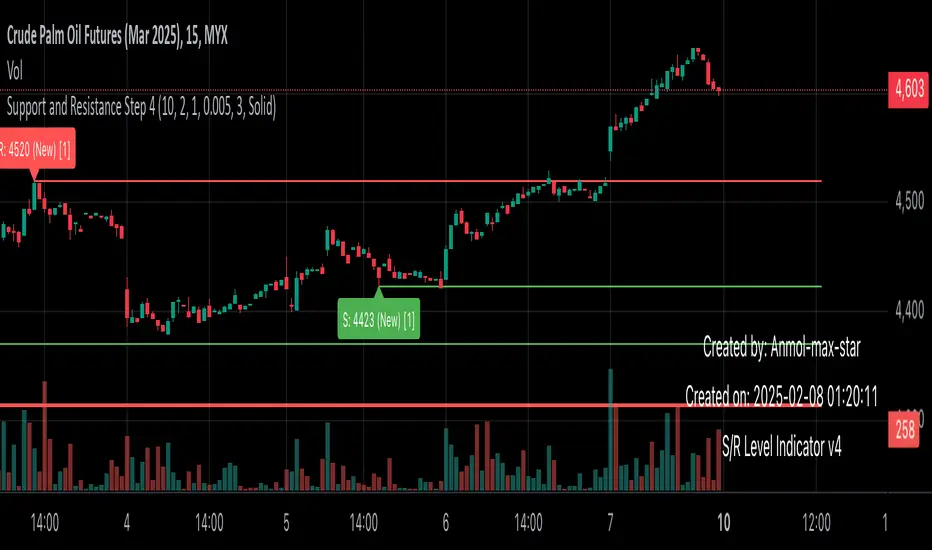
Support and Resistance all in one The Support and Resistance Indicator (v4) is designed to identify and track key price levels in financial markets. Here's how it works:
Core Functionality
Level Detection
Uses pivot points to identify significant price levels
Looks for swing highs (resistance) and swing lows (support)
Requires price action to pivot over a specified period (default 10 bars)
Dynamic Level Management
Maintains separate arrays for support and resistance levels
Limits maximum displayed levels (default 10) to prevent chart clutter
Removes oldest levels when maximum is reached
Ensures new levels are sufficiently distant from existing ones (minimum 1% separation)
Touch Detection System
Monitors price interaction with established levels
Counts when price comes within 0.1% of any level
Updates touch count and strength classification
Categories: "New" (1 touch), "Moderate" (2 touches), "Strong" (3+ touches)
Visual Representation
Draws horizontal lines at each level
Updates line width based on strength (thicker for stronger levels)
Shows labels with price and strength information
Color coding: Red (new/moderate levels), Green (strong levels)
Displays triangles (▼▲) at pivot points
Trading Applications
Support/Resistance Trading
Strong levels (3+ touches) suggest reliable trading zones
More touches indicate higher probability reversal points
Use for stop loss and target placement
Breakout Trading
Monitor breaks of strong levels
Higher touch count suggests more significant breakouts
Watch for false breakouts at weaker levels
Risk Management
Place stops beyond strong levels
Use level strength to adjust position size
Consider multiple timeframe analysis
Best Practices
Use with other indicators for confirmation
Consider market context and trend
Monitor level strength development
Don't rely solely on touch count
Watch for price reaction at levels
Customization Options
Adjust pivot length for different timeframes
Modify minimum distance between levels
Change required touches for "Strong" classification
Toggle strength labels display
Choose line style (Solid/Dashed/Dotted)
This indicator helps identify key price levels where market participants have shown interest, making it valuable for trade planning and risk management
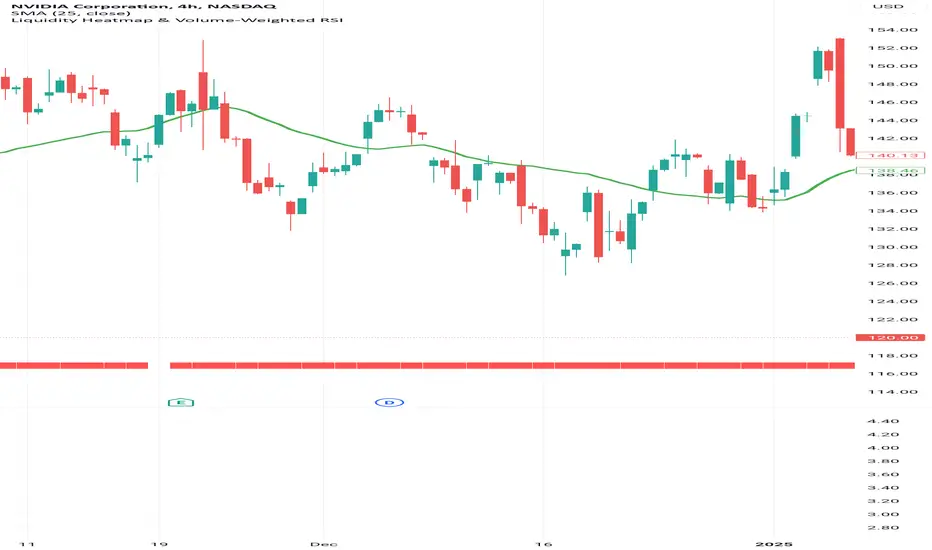
Liquidity Heatmap & Volume-Weighted RSILiquidity Heatmap Indicator with Volume-Weighted RSI
Description:
The Liquidity Heatmap Indicator with Volume-Weighted RSI (VW-RSI) is a powerful tool designed for traders to visualize market liquidity zones while integrating a volume-adjusted momentum oscillator. This indicator provides a dynamic heatmap of liquidity levels across various price points and enhances traditional RSI by incorporating volume weight, making it more responsive to market activity.
Key Features:
Liquidity Heatmap Visualization: Identifies high-liquidity price zones, allowing traders to spot potential areas of support, resistance, and accumulation.
Volume-Weighted RSI (VW-RSI): Enhances the RSI by factoring in trading volume, reducing false signals and improving trend confirmation.
Customizable Sensitivity: Users can adjust parameters to fine-tune heatmap intensity and RSI smoothing.
Dynamic Market Insights: Helps identify potential price reversals and trend strength by combining liquidity depth with momentum analysis.
How to Use:
1. Identify Liquidity Zones: The heatmap colors indicate areas of high and low liquidity, helping traders pinpoint key price action areas.
2. Use VW-RSI for Confirmation: When VW-RSI diverges from price near a liquidity cluster, it signals a potential reversal or continuation.
3. Adjust Parameters: Fine-tune the RSI period, volume weighting, and heatmap sensitivity to align with different trading strategies.
This indicator is ideal for traders who rely on order flow analysis, volume-based momentum strategies, and liquidity-driven trading techniques.
Onky's DikFat Supreme Supply and Demand
Onky's DikFat Supreme Supply and Demand (DFAT S&D)
This indicator identifies and marks potential Demand and Supply zones based on sharp price movements and volume spikes. It is designed to assist traders in recognizing areas where price could potentially reverse or move impulsively, based on the concept of supply and demand.
Key Features:
- Dynamic Demand and Supply Zones : The indicator uses historical price data and sharp price movements to detect areas where demand or supply may be concentrated. The zones are drawn as boxes on the chart for visual reference.
- Volume Spike Detection : The zones are only marked when a volume spike occurs, indicating increased market activity and potentially stronger support or resistance at those levels.
- Adjustable Parameters : Traders can adjust the Zone Size to control the lookback period for detecting supply and demand zones, and can fine-tune the Volume Multiplier to control the sensitivity of volume spikes.
- Alerts : Alerts are available for both Demand and Supply zones when they are detected, allowing traders to be notified when price enters or reacts to these areas.
How Traders Use Supply and Demand Zones:
Supply and Demand Theory suggests that prices often move in response to the balance between the amount of supply (selling pressure) and demand (buying pressure) at specific price levels. When demand exceeds supply, prices tend to rise, and when supply exceeds demand, prices tend to fall.
1. Demand Zones : These are areas where price has previously fallen to a low point and buyers have stepped in, pushing prices higher. Traders may view these zones as potential areas for price to reverse upward again.
2. Supply Zones : These are areas where price has risen to a high point and sellers have stepped in, pushing prices lower. Traders may see these zones as potential areas for price to reverse downward again.
Traders use these zones to identify potential entry points (for buying in demand zones or selling in supply zones) and exit points (if price reaches these zones in the future). The volume spike further validates the strength of these zones, as it indicates heightened market interest at those levels.
This indicator offers a flexible, visual way to identify and act upon these market dynamics. It is neutral and does not guarantee any specific outcomes, but it may assist traders in recognizing important price levels where price action could change.
Disclaimer:
This indicator is provided for informational purposes only. It is not intended to be trading advice or a recommendation to buy or sell any financial instruments. Trading involves risk, and the use of this tool does not guarantee any specific results or profits. Past performance is not indicative of future results. Users are responsible for their own decisions and should seek independent financial advice before making any investment decisions.
