OA S/R PowerPurpose of the Script
This script identifies the strength of support and resistance levels based on key factors like volume, bounce frequency, and retests. Each level is assigned a score (0-100) and visualized with color-coded labels on the chart.
Key Features
Dynamic Strength Calculation:
Volume Strength: Measures the strength based on the volume of candles touching the level.
Bounce Strength: Evaluates how often the price bounces back from the level.
Retest Strength: Scores the consistency of retests over time.
Color-Coded Visualization:
Yellow: Strong levels (Strength ≥ 70).
Orange: Medium levels (Strength between 50-70).
Red: Resistance levels (Price is below the level).
Green: Support levels (Price is above the level).
Fully Customizable Settings:
Adjust the weight for volume, bounce, and retest contributions.
Configure timeframes, percentage range, and number of levels to analyze.
How It Works
Identify Peaks and Valleys: The script calculates local highs and lows using a configurable width setting to determine potential support and resistance levels.
Filter Key Levels: Nearby levels are merged based on a user-defined percentage range, ensuring clean and relevant levels.
Strength Scoring: Levels are scored dynamically based on:
The number of touches.
The volume of touches.
The frequency of bounces and retests.
Visual Feedback: Each level is plotted on the chart with a color-coded label, indicating its importance and price relationship.
Best Use Cases
Quickly identify strong support/resistance zones for breakout or reversal trades.
Use the dynamic scoring system to prioritize key levels for your strategy.
Customize weights to align with your trading style, such as emphasizing volume or retests.
Destek ve Direnç

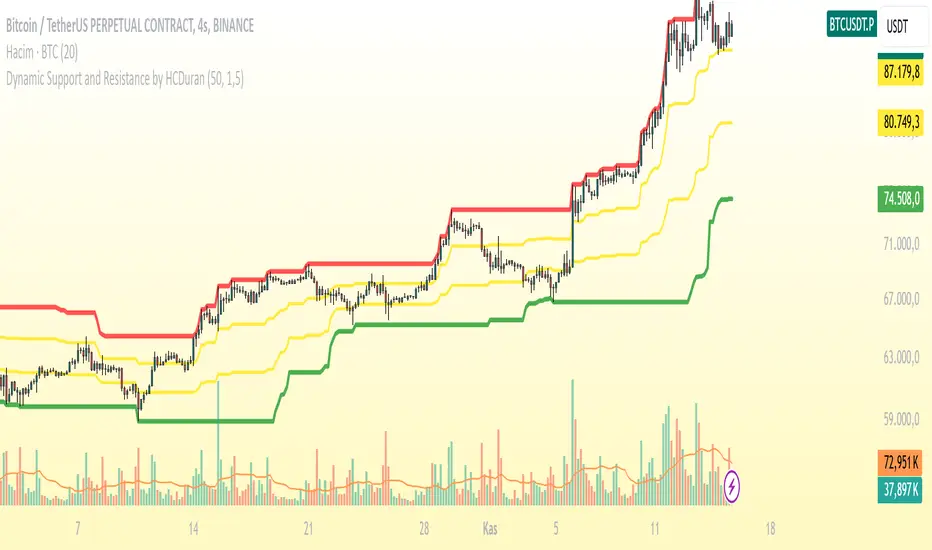
Dynamic Support and Resistance by HCDuranThis indicator dynamically plots support and resistance levels based on price action. It calculates the strongest support and resistance levels using the highest and lowest prices over a specified period, and visualizes these levels with different colors. Strong support and resistance are marked in **green** and **red** respectively, while **mid-range** support and resistance levels are displayed in **yellow**.
### Features:
- **Strong Support (Green):** The lowest price level over the last 50 bars.
- **Strong Resistance (Red):** The highest price level over the last 50 bars.
- **Mid Support (Yellow):** A support level above the strong support but below the resistance range.
- **Mid Resistance (Yellow):** A resistance level below the strong resistance but above the support range.
### Usage:
1. **Support and Resistance:** The indicator calculates dynamic support and resistance levels based on the most recent price action over a specified lookback period (e.g., 50 bars). These levels are then plotted on the chart for easy visualization.
2. **Alerts:** Alerts are triggered when the price crosses below the strong support or above the strong resistance. This can be useful for identifying potential breakouts or reversals.
### Help for Users:
This indicator helps to identify potential price reversal points by plotting dynamic support and resistance levels. Strong support or resistance levels can indicate areas where the price is likely to reverse, while mid-range levels can provide additional insights into price trends and ranges.
**Note:** The performance of this indicator may vary depending on the selected lookback period and time frame. It is recommended to experiment with different timeframes to see how the indicator performs under various market conditions.
-------------------------------------------------------------------------------------------------------------------
Bu indikatör, fiyat hareketlerine dayalı olarak dinamik destek ve direnç seviyelerini çizer. En yüksek ve en düşük seviyeler arasındaki farkı göz önünde bulundurarak, güçlü direnç ve destek seviyelerini kırmızı ve yeşil renklerle, orta seviyeleri ise sarı renk ile gösterir.
### Özellikler:
- **Güçlü Destek (Yeşil):** En düşük fiyat seviyesinin 50 barlık bir zaman dilimi boyunca belirlenen seviyesi.
- **Güçlü Direnç (Kırmızı):** En yüksek fiyat seviyesinin 50 barlık bir zaman dilimi boyunca belirlenen seviyesi.
- **Orta Destek (Sarı):** Destek seviyesinin üstünde, ancak güçlü destek seviyesinden daha yüksek bir seviyedir.
- **Orta Direnç (Sarı):** Direnç seviyesinin altında, ancak güçlü direnç seviyesinden daha düşük bir seviyedir.
### Kullanım:
1. **Destek ve Direnç:** Bu indikatör, belirli bir süre dilimindeki fiyat hareketlerine dayalı olarak destek ve direnç seviyelerini belirler ve çizer. Fiyat bu seviyelere yaklaşırken, seviyelerin ne kadar güçlü olduğunu görsel olarak değerlendirebilirsiniz.
2. **Uyarılar:** İndikatör, fiyatın güçlü destek seviyesinin altına düşmesi veya güçlü direnç seviyesinin üstüne çıkması durumunda uyarılar tetikler. Bu, trade kararları alırken önemli sinyaller sağlayabilir.
### Kullanıcıya Yardım:
Bu indikatör, dinamik destek ve direnç seviyeleri belirleyerek, potansiyel geri dönüş noktalarını ve fiyat hareketinin yönünü anlamaya yardımcı olur. Fiyatın güçlü seviyeleri kırması, önemli trade fırsatları gösterebilir.
**Not:** İndikatörün performansı, bakılan zaman dilimine ve seçilen lookback periyoduna göre değişebilir. Farklı zaman dilimlerinde kullanarak daha doğru sinyaller elde edebilirsiniz.
Fibonacci Moving Average PlusFibonacci Moving Average Plus is a sophisticated technical indicator that employs the first 15 numbers of the Fibonacci sequence to create dynamic moving average channels. This indicator aims to capture both immediate and long-term price movements by calculating Exponential Moving Averages (EMAs) based on these Fibonacci values. By using Fibonacci-based moving averages for both high and low price points, the indicator generates a visual channel that reflects the ebb and flow of market trends, acting as potential zones of support and resistance. Additionally, the indicator provides midline, retracement, and extension levels rooted in Fibonacci ratios, which are frequently observed as key levels for reversals or trend continuation.
Ideology Behind Using Fibonacci Sequence-Based Moving Averages
The Fibonacci sequence, known for its mathematical harmony and prevalence in natural patterns, is widely utilized in technical analysis to identify potential turning points in markets. In this indicator, the first 15 Fibonacci numbers (5, 8, 13, 21, etc.) are used as the lookback periods for EMAs to capture different layers of market sentiment. These moving averages represent timeframes that are theoretically in alignment with the natural rhythms of market cycles, where key levels—often coinciding with Fibonacci numbers—can act as magnetic points for price.
The Fibonacci high and low channels aim to encapsulate price action, giving traders a sense of whether the market is trending, consolidating, or experiencing reversal pressure. These levels, grounded in both mathematics and market psychology, help traders spot areas where price might face resistance or find support.
Key Features
Fibonacci Moving Average High and Low: This indicator calculates the high and low EMAs based on Fibonacci sequence numbers (e.g., 5, 8, 13, etc.) for enhanced trend analysis.
Golden Pocket Retracement (GPR) and Extension (GPE) Bands: Displays common Fibonacci retracement and extension levels (0.618, 0.65 for retracement, and 1.618, 1.65 for extension).
Midline: Plots the average of the Fibonacci high and low to act as an additional reference level.
Stop-Loss Levels: Provides suggested stop-loss levels based on Fibonacci levels for both long and short positions.
Basic User Guide
Adjust Input Settings:
Input Timeframe: Set a specific timeframe for the Fibonacci moving average calculation, separate from the chart's primary timeframe.
Show Fibonacci MA High/Low: Toggle the visibility of the high and low Fibonacci moving averages.
Show Mid Line: Display a midline for added trend reference.
Show Golden Pocket Bands: Choose to display retracement or extension bands for potential support or resistance zones.
Show Stop-Loss Levels: Enable to visualize potential stop-loss levels for both long and short trades.
Interpretation:
Fibonacci MA High and Low: Use these lines to gauge the general trend. When the price is above both, it may indicate an uptrend; below both, a downtrend.
Golden Pocket Retracement: This zone (between 0.618 and 0.65) is often a key level for potential reversals or support/resistance.
Golden Pocket Extension: The 1.618 and 1.65 levels can indicate potential profit-taking or trend exhaustion points.
Stop-Loss Levels: The calculated stop-loss levels (long SL below and short SL above) can aid in risk management.
Customization:
You can customize the appearance and visibility of each component through the input settings to fit your specific strategy and visual preferences.
This indicator should be used alongside other technical analysis tools to provide a more comprehensive trading approach.
This Indicator would not exist without the original contributions and blessing from Sofien Kaabar

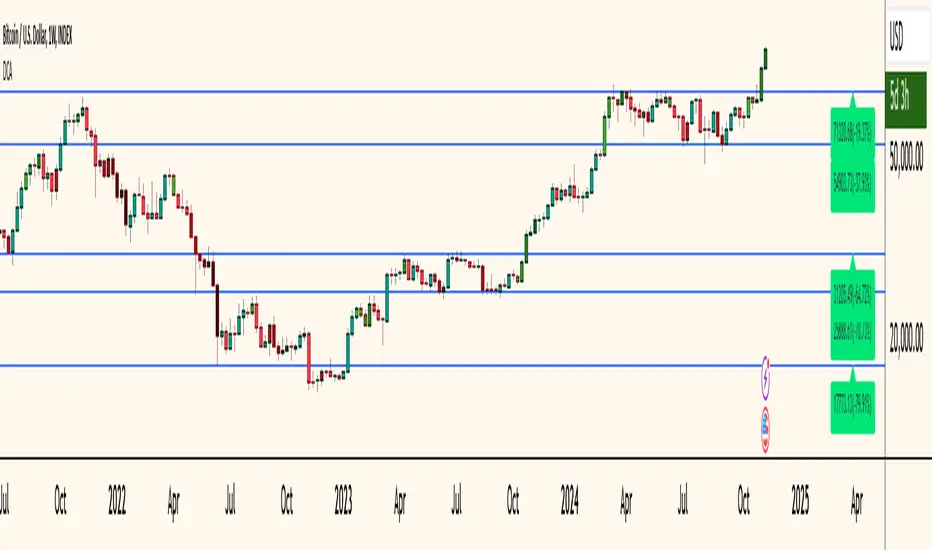
Dollar Cost Averaging (YavuzAkbay)The Dollar Cost Averaging (DCA) indicator is designed to support long-term investors following a Dollar Cost Averaging strategy. The core aim of this tool is to provide insights into overbought and oversold levels, assisting investors in managing buy and sell decisions with a clear visual cue system. Specifically developed for use in trending or fluctuating markets, this indicator leverages support and resistance levels to give structure to investors' buying strategies. Here’s a detailed breakdown of the indicator’s key features and intended usage:
Key Features and Color Coding
Overbought/Oversold Detection:
The indicator shades candles from light green to dark green when an asset becomes increasingly overbought. Dark green signals indicate a peak, where the asset is overbought, suggesting a potential opportunity to take partial profits.
Conversely, candles turn from light red to dark red when the market is oversold. Dark red signifies a heavily oversold condition, marking an ideal buying window for initiating or adding to a position. This color scheme provides a quick visual reference for investors to manage entries and exits effectively.
Support and Resistance Levels:
To address the risk of assets falling further after an overbought signal, the DCA indicator dynamically calculates support and resistance levels. These levels guide investors on key price areas to watch for potential price reversals, allowing them to make more informed buying or selling decisions.
Support levels help investors assess whether they should divide their capital across multiple buy orders, starting at the current oversold zone and extending to anticipated support zones for maximum flexibility.
Usage Methodology
This indicator is intended for Dollar Cost Averaging, a method where investors gradually add to their position rather than entering all at once. Here’s how it complements the DCA approach:
Buy at Oversold Levels: When the indicator shows a dark red candle, it signals that the asset is oversold, marking an optimal entry point. The presence of support levels can help investors determine if they should fully invest their intended amount or stagger buys at potential lower levels.
Sell at Overbought Levels: When the indicator transitions to dark green, it suggests that the asset is overbought. This is an ideal time to consider selling a portion of holdings to realize gains. The resistance levels, marked by the indicator, offer guidance on where the price may encounter selling pressure, aiding investors in planning partial exits.
Customizable Settings
The DCA indicator offers several user-adjustable parameters:
Pivot Frequency and Source: Define the pivot point frequency and the source (candle wick or body) for more tailored support/resistance detection.
Maximum Pivot Points: Set the maximum number of pivot points to be used in support/resistance calculations, providing flexibility in adapting to different market structures.
Channel Width and Line Width: Adjust the width of the channel for support/resistance levels and the thickness of the lines for easier visual tracking.
Color Intensities for Overbought/Oversold Levels: Customize the shading intensity for each overbought and oversold level to align with your trading preferences.
3 CANDLE SUPPLY/DEMANDExplanation of the Code:
Demand Zone Logic: The script checks if the second candle closes below the low of the first candle and the third candle closes above both the highs of the first and second candles.
Zone Plotting: Once the pattern is identified, a demand zone is plotted from the low of the first candle to the high of the third candle, using a dashed green line for clarity.
Markers: A small triangle marker is added below the bars where a demand zone is detected for easy visualization.
Efficient Logic: The script checks the conditions for demand zone formation for every three consecutive candles on the chart.
This approach should be both accurate and efficient in plotting demand zones, making it easier to spot potential support levels on the chart.

Support & Resistance AI LevelScopeSupport & Resistance AI LevelScope
Support & Resistance AI LevelScope is an advanced, AI-driven tool that automatically detects and highlights key support and resistance levels on your chart. This indicator leverages smart algorithms to pinpoint the most impactful levels, providing traders with a precise, real-time view of critical price boundaries. Save time and enhance your trading edge with effortless, intelligent support and resistance identification.
Key Features:
AI-Powered Level Detection: The LevelScope algorithm continuously analyzes price action, dynamically plotting support and resistance levels based on recent highs and lows across your chosen timeframe.
Sensitivity Control: Customize the sensitivity to display either major levels for a macro view or more frequent levels for detailed intraday analysis. Easily adjust to suit any trading style or market condition.
Level Strength Differentiation: Instantly recognize the strength of each level with visual cues based on how often price has touched each one. Stronger levels are emphasized, highlighting areas with higher significance, while weaker levels are marked subtly.
Customizable Visuals: Tailor the look of your chart with customizable color schemes and line thickness options for strong and weak levels, ensuring clear visibility without clutter.
Proximity Alerts: Receive alerts when price approaches key support or resistance, giving you a heads-up for potential market reactions and trading opportunities.
Who It’s For:
Whether you're a day trader, swing trader, or just want a quick, AI-driven way to identify high-probability levels on your chart, Support & Resistance AI LevelScope is designed to keep you focused and informed. This indicator is the perfect addition to any trader’s toolkit, empowering you to make more confident, data-backed trading decisions with ease.
Upgrade your analysis with AI-powered support and resistance—no more manual lines, only smart levels!

Volumetric Rejection Blocks [UAlgo]The Volumetric Rejection Blocks is designed to help traders identify and visualize key price levels where volumetric rejections occur, which may indicate a shift in market sentiment. These rejections can signal potential trend reversals or areas where price action is likely to face support or resistance. By drawing rejection blocks based on volumetric strength, the indicator allows users to observe where significant buying or selling pressure has been exerted, which can be used as a reference point for future price action.
Also indicator dynamically calculates swing highs and lows, analyzes bullish and bearish strengths based on volume-weighted price movements, and displays rejection blocks on the chart. Each rejection block represents an area where the price attempted to move beyond a certain level but faced rejection, either on a close or wick basis. This can be particularly useful for traders who rely on market structure and order flow to make informed decisions about entering or exiting trades.
🔶 Key Features
Swing Length Customization: Allows users to define the swing length, helping tailor the sensitivity of the swing high and low detection to the specific market conditions.
Rejection Block Visualization: Displays up to the last 10 rejection blocks based on user settings, clearly marking areas of significant bullish or bearish rejections.
Volumetric Strength Analysis: The indicator calculates bullish and bearish strength for each rejection block, based on volume-weighted price movements over the last few bars, giving insight into the intensity of the rejection.
Violation Check Type: Offers two options for violation detection—"Close" and "Wick". This allows traders to specify whether a price level is considered broken only if it closes beyond the level or if any wick breaches it.
Bullish and Bearish Block Coloring: Rejection blocks are colored to represent bullish (green) and bearish (red) rejection areas. The color transparency can be adjusted for clear visibility overlaid on the price chart.
Market Structure Labels: Labels and lines marking "Market Structure Shift" (MSS) and "Break of Structure" (BOS) are displayed, giving traders context about significant market structure changes.
🔶 Interpreting the Indicator
Rejection Blocks: These colored blocks on the chart indicate areas where the price faced significant buying or selling pressure. A green block suggests a bullish rejection (support zone), where buyers absorbed the sell-off, potentially pushing the price upward. Conversely, a red block indicates a bearish rejection (resistance zone), where sellers overpowered buyers, potentially driving the price lower.
Strength Analysis: The width of the green and red sections within a rejection block represents the relative bullish and bearish strengths. A wider green section indicates stronger bullish support, while a wider red section suggests more robust bearish resistance. This helps traders gauge the likelihood of price holding or breaching these levels.
Market Structure Shift (MSS) and Break of Structure (BOS): The indicator automatically detects and labels significant changes in market structure. An "MSS" label indicates the first break, suggesting a potential shift in trend direction. A "BOS" label indicates a subsequent confirmation in trend direction, allowing traders to recognize potential trend continuations.
Violation Check: Traders can choose how to interpret breaks of these rejection blocks. Using the "Close" option provides a more conservative approach, requiring a close beyond the level for confirmation. The "Wick" option is more aggressive, treating any wick beyond the level as a break.
🔶 Disclaimer
Use with Caution: This indicator is provided for educational and informational purposes only and should not be considered as financial advice. Users should exercise caution and perform their own analysis before making trading decisions based on the indicator's signals.
Not Financial Advice: The information provided by this indicator does not constitute financial advice, and the creator (UAlgo) shall not be held responsible for any trading losses incurred as a result of using this indicator.
Backtesting Recommended: Traders are encouraged to backtest the indicator thoroughly on historical data before using it in live trading to assess its performance and suitability for their trading strategies.
Risk Management: Trading involves inherent risks, and users should implement proper risk management strategies, including but not limited to stop-loss orders and position sizing, to mitigate potential losses.
No Guarantees: The accuracy and reliability of the indicator's signals cannot be guaranteed, as they are based on historical price data and past performance may not be indicative of future results.

Formation Defined Moving Support and ResistanceThe script was originally coded in 2018 with Pine Script version 3, and it was in protected code status. It has been updated and optimised for Pine Script v5 and made completely open source.
The Formation Defined Moving Support and Resistance indicator is a sophisticated tool for identifying dynamic support and resistance levels based on specific price formations and level interactions. This indicator goes beyond traditional static support and resistance by updating levels based on predefined formation patterns and market behaviour, providing traders with a more responsive view of potential support and resistance zones.
Features:
The indicator detects essential price levels:
Lower Low (LL)
Higher Low (HL)
Higher High (HH)
Lower High (LH)
Equal Lower Low (ELL)
Equal Higher Low (EHL)
Equal Higher High (EHH)
Equal Lower High (ELH)
By identifying these key points, the script builds a foundation for tracking and responding to changes in price structure.
Pre-defined Formations and Comparisons:
The indicator calculates and recognises nine different pre-defined formations, such as bullish and bearish formations, based on the sequence of price levels.
These formations are compared against previous levels and formations, allowing for a sophisticated understanding of recent market movements and momentum shifts.
This formation-based approach provides insights into whether the price is likely to maintain, break, or reverse key levels.
Dynamic Support and Resistance Levels:
The indicator offers an option to toggle Moving Support and Resistance Levels.
When enabled, the support and resistance levels dynamically adjust:
Upon a change in the detected formation.
When the bar’s closing price breaks the last defined support or resistance level.
This feature ensures that the support and resistance levels adapt quickly to market changes, giving a more accurate and responsive perspective.
Customisable Price Source:
Users can choose the price source for level detection, selecting between close or high/low prices.
This flexibility allows the indicator to adapt to different trading styles, whether the focus is on closing prices for more conservative levels or on highs and lows for more sensitive level tracking.
This indicator can benefit traders relying on dynamic support and resistance rather than fixed, historical levels. It adapts to recent price actions and market formations, making it useful for identifying entry and exit points, trend continuation or reversal, and setting trailing stops based on updated support and resistance levels.

IQ Zones [TradingIQ]Hey Traders!
Introducing "IQ Zones".
"IQ Zones" is an indicator that combines support and resistance identification with volume, the "value area" of a candlestick to be exact. IQ Zones identifies turning points in the market; however, the candlestick high or low that formed the key turning point is not necessarily distinguished as the support/resistance area. Instead, the script looks into the bar at lower timeframes and calculates the value area of the candlestick that formed the support or resistance level. Therefore, any lines protruding from a candlestick reflect the value area of that candlestick. These levels (value area high and value area low) are marked on the candlestick as a support/resistance level. If the level formed on high volume it's marked as an "IQ Zone".
Additionally, IQ Zones presents a heat map to show volume intensity at nearby price areas. The heatmap is a product of the Volume Profile (IQ Profile) located on the right of the chart.
The IQ Profile is a segmented volume profile. Recent price is split into fifths (customizable), and individual volume profiles are calculated for all segmented price areas. Price is split into more than one segment to avoid a situation where volume in a ranging price zone far surpasses all other recent price areas - creating an "unusable" volume profile that doesn't offer helpful insights. If desired, you can set the segmenting option to "1" to calculate one unified volume profile for the entire price range.
The image above shows IQ Zones in action!
Core Features of IQ Zones
Value Area Support and Resistance Levels
Segmented volume profile for the recent trading period
Volume intensity heatmap
Support and resistance levels in high volume intensity may be more significant as price stoppers
The image above explains the labels marked along the y-axis of the IQ Profile.
The "more green" a price area/label is, the higher the volume intensity at the marked support/resistance area.
The image above further explains line lines protruding from the IQ Profile.
For this example, the value area of the candlestick (where most trading action occurred) is quite far from the high price of the candlestick that formed a resistance level! Using the value area of a candlestick that marks a key turning point to draw support/resistance offers insight into where the majority of trading action took place when the support/resistance level was forming!
Additionally, you can hover your mouse over the IQ Zone labels (triangles pointing up or down) to see the prices of the value area for the support/resistance level, including the total buying volume and total selling volume at the price area!
The image above further explains the IQ Profile!
You can segment the recent price area anywhere from 1 - 15 times.
The image above further explains IQ Zones and the IQ Profile!
That will be all for this indicator - a fun project to share with the community.
Thank you!

Multi-Timeframe RangeThe Multi-Timeframe Range Indicator is designed for traders looking to monitor key price levels across various timeframes (Daily, Weekly, Monthly, Quarterly, and Yearly) directly on their charts. This indicator draws boxes and mid-lines for each timeframe’s high, low, and midpoint, enabling users to visualize price ranges and assess potential areas of support and resistance more effectively.
Features:
Dynamic Range Boxes: Displays the high, low, and midpoint levels for each specified timeframe, with customizable colors for easy differentiation.
Visual Cues for Monday’s Levels: Highlights Monday’s high, low, and midpoint levels each week to support intraday trading setups and weekly trend analysis.
Multi-Timeframe Flexibility: Easily toggle between timeframes to view ranges from daily to yearly, making this indicator suitable for both short-term and long-term traders.
Ideal Use Cases:
Identify key support and resistance zones based on multiple timeframes.
Assess weekly and monthly trends using the Monday range levels.
Gain insights into market structure across various timeframes.

ARMORE Capital: Support–Resistance Levels v2.0 [Enhanced]Enhanced S/R Levels with Signals
The "Enhanced S R Levels with Signals" indicator is designed to help traders and investors identify key Support and Resistance levels on a price chart. It also includes LONG and SHORT signals to help you see potential buy and sell opportunities. Here's a beginner-friendly breakdown of how it works and how to use it:
How it Works
Support and Resistance Levels:
Support Levels (blue lines) are prices where the stock tends to find a "floor" or buying interest, potentially pushing the price up. These levels are calculated based on the lowest prices over a period, with the sensitivity setting helping adjust the distance between each support level.
Resistance Levels (red lines) are prices where the stock often encounters a "ceiling" or selling interest, which could push the price down. These levels are calculated based on the highest prices over a period, with sensitivity adjusting the distance between each resistance level.
The indicator plots up to five support and five resistance lines, giving you a layered view of price levels where the market may react.
LONG and SHORT Signals:
LONG Signal (green arrow pointing up): When the closing price goes above the closest support level, the indicator shows a LONG signal below the bar, suggesting a potential upward trend.
SHORT Signal (red arrow pointing down): When the closing price goes below the closest resistance level, the indicator shows a SHORT signal above the bar, indicating a potential downward trend.
Background Ribbons:
When a LONG condition is met, a faint green background appears on the chart as a visual cue.
When a SHORT condition is met, a faint red background appears to signal potential bearish pressure.
How to Use It
1. Finding Entry and Exit Points: Use the LONG and SHORT signals as a guide, but remember to consider other factors before making trading decisions. A LONG signal suggests that price may rise, while a SHORT signal indicates potential downside.
2. Support & Resistance Levels: Treat these levels as potential points of interest. Prices often react at support or resistance, so you can look for confirmation (e.g., reversal patterns, volume spikes) around these levels.
3. Experiment with Sensitivity: Adjust the "Sensitivity" setting to see how it changes the spacing of support and resistance levels. Higher sensitivity may show more frequent support/resistance levels, which can be helpful for short-term traders.
DISCLAIMER : This is purely experimental and shouldn't be considered a blatant Buy-Sell Indicator. Please feel free to use it to supplement your research, share it with your friends, iterate and improve upon it, and use it to build better, more powerful tools!
Remember, always combine technical indicators with other analysis methods and manage your risk responsibly. Happy Trading!

CSP Key Level Finder This script is designed for option sellers, particularly those using strategies like cash-secured puts (CSPs), to help automate the process of identifying key levels in the market. The core functionality is to calculate a specific price level where a 5% return can be achieved based on the historical volatility of the underlying asset. This level is visually plotted on a chart to guide traders in making more informed decisions without manually calculating the thresholds themselves.
The script incorporates implied volatility (IV) data to determine the volatility rank of the asset and calculates historical volatility (HV) based on price movements. These volatility measures help assess market conditions. The resulting key level is drawn as a line on the chart, along with a label that includes relevant information about volatility, making it easier for traders to evaluate potential option selling strategies.
Additionally, the script includes user input options, allowing users to control when to display the key level on the chart, offering flexibility based on individual needs. Overall, the script provides a visual aid for option sellers to streamline the process of identifying attractive entry points.

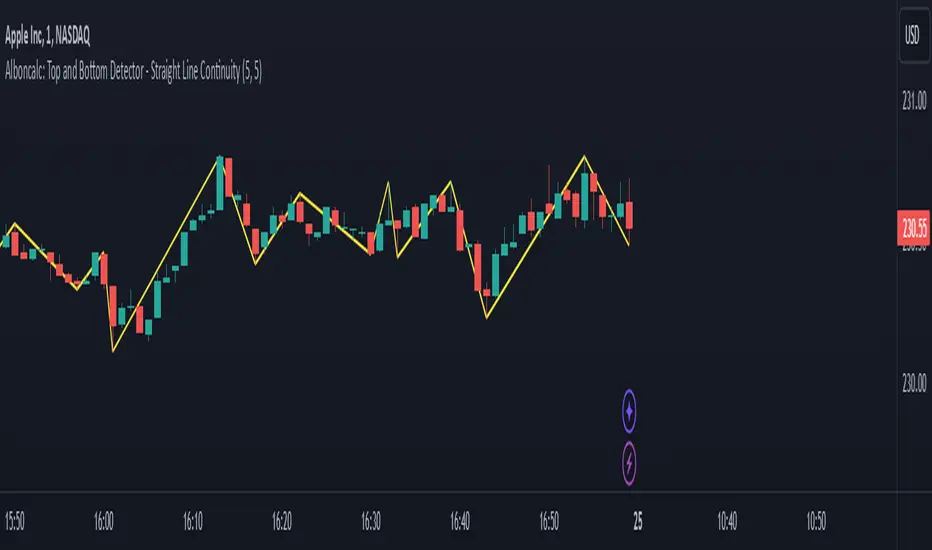
Alboncalc: Top and Bottom Detector - Straight Line ContinuityDescription:
The "Alboncalc: Top and Bottom Detector - Straight Line Continuity" is an innovative indicator for identifying key price reversal points (tops and bottoms) with precision. Unlike traditional indicators that focus on abstract data representations like oscillators or momentum-based lines, this indicator directly overlays the price chart. It draws a continuous line connecting highs and lows (tops and bottoms), providing traders with a clear and immediate visual representation of market swings. The lines automatically adjust in real-time, maintaining a straight path during trend continuations and only shifting when a trend reversal is detected.
Originality and Usefulness:
This indicator stands out from other tools available on TradingView due to its unique ability to maintain a continuous line across price swings, preserving accuracy and visual clarity. Most traditional top-and-bottom detectors merely mark points or provide indicators that are disconnected from price action, making it harder for traders to spot patterns. This script takes a different approach by drawing lines directly on the price chart, offering greater precision and better trend visualization. This innovation is particularly useful for traders who rely on visual cues and price action analysis to make decisions. It simplifies the process of identifying reversal points and trends without needing to rely on lagging indicators.
How It Works:
This indicator detects tops and bottoms based on user-defined periods. When the highest point in a given period is detected, it marks it as a top, and similarly, when the lowest point is detected, it marks it as a bottom. As the price moves, the indicator adjusts the lines to connect consecutive tops and bottoms. If the trend continues in the same direction (e.g., an uptrend), the line remains straight and extends. If a reversal is detected, a new line is drawn to connect the previous bottom (or top) to the new reversal point, providing an accurate visual representation of market trends.
How to Use:
1. Load the Indicator: Add the "Alboncalc: Top and Bottom Detector - Straight Line Continuity" to your chart from the TradingView script library.
2. Customize Settings: Adjust the "Top Period" and "Bottom Period" inputs to fine-tune the sensitivity of top and bottom detection based on your preferred timeframe.
3. Observe Price Action: As the price moves, the indicator will draw lines directly over the price chart, connecting tops and bottoms.
4. Interpret the Lines: Use the continuous lines to identify ongoing trends and potential reversal points. The line remains straight during trend continuation, indicating sustained movement in one direction. A new line signifies a reversal in the trend.
This tool is ideal for traders using trend-following strategies, breakout detection, or those who prefer clean, visual price action analysis (Only Tops and Bottons).
Underlying Concepts:
The core of this indicator is based on the highest high and lowest low concept, which is common in technical analysis. The logic is simple:
- A top is detected when the price reaches a high point compared to a user-defined number of prior candles (i.e., the `top_period`).
- A bottom is detected when the price hits a low point compared to the prior candles (i.e., the `bottom_period`).
When the price continues in the same trend, the line is extended without a break. This behavior ensures that trends are represented in a clear and consistent manner, which helps traders better identify trend continuations and reversals.
Code Breakdown:
```pinescript
//@version=5
indicator("Top and Bottom Detector - Straight Line Continuity", overlay=true)
```
- This initializes the indicator and specifies that it will overlay directly on the price chart.
```pinescript
var int top_period = input.int(5, title="Top Period", minval=1)
var int bottom_period = input.int(5, title="Bottom Period", minval=1)
```
- These inputs allow the user to customize the number of candles used to identify tops and bottoms. A higher period results in fewer but more significant top/bottom detections, while a lower period increases sensitivity.
```pinescript
isTop = ta.highest(top_period) == high
isBottom = ta.lowest(bottom_period) == low
```
- These lines check if the current candle has the highest high or the lowest low in the defined period. If true, the current price is either a top or a bottom.
```pinescript
var line currentLine = na
var float last_price = na
var int last_index = na
var bool isUpTrend = na
```
- These variables store the current line being drawn (`currentLine`), the last detected price (`last_price`), and the direction of the trend (`isUpTrend`). `last_index` tracks where the last top or bottom was detected.
```pinescript
if (isTop or isBottom)
if (not na(last_price))
if ((isTop and isUpTrend) or (isBottom and not isUpTrend))
line.set_xy2(currentLine, bar_index, (isTop ? high : low))
else
currentLine := line.new(x1=last_index, y1=last_price, x2=bar_index, y2=(isTop ? high : low), color=color.yellow, width=2)
last_price := (isTop ? high : low)
last_index := bar_index
isUpTrend := isTop
```
- The `if` block handles the logic of drawing the line. If a top or bottom is detected, and the trend continues (either an uptrend for tops or a downtrend for bottoms), the current line is extended using `line.set_xy2`. If a reversal is detected, a new line is drawn using `line.new`.
- The `last_price` and `last_index` variables are updated after each detection, and the `isUpTrend` flag is set based on whether a top or bottom was found.
Conclusion:
This indicator offers a more precise and visually intuitive way of identifying tops and bottoms directly on the price chart, making it an essential tool for traders focused on price action. Its ability to draw continuous lines through ongoing trends and adjust only upon a reversal makes it superior in terms of visual clarity compared to most conventional indicators.
$TUBR: 7-25-99 Moving Average7, 25, and 99 Period Moving Averages
This indicator plots three moving averages: the 7-period, 25-period, and 99-period Simple Moving Averages (SMA). These moving averages are widely used to smooth out price action and help traders identify trends over different time frames. Let's break down the significance of these specific moving averages from both supply and demand perspectives and a price action perspective.
1. Supply and Demand Perspective:
- 7-period Moving Average (Short-Term) :
The 7-period moving average represents the short-term sentiment in the market. It captures the rapid fluctuations in price and is heavily influenced by recent supply and demand changes. Traders often look to the 7-period SMA for immediate price momentum, with price moving above or below this line signaling short-term strength or weakness.
- Bullish Supply/Demand : When price is above the 7-period SMA, it suggests that buyers are currently in control and demand is higher than supply. Conversely, price falling below this line indicates that supply is overpowering demand, leading to a short-term downtrend.
Is current price > average price in past 7 candles (depending on timeframe)? This will tell you how aggressive buyers are in short term.
- Key Supply/Demand Zones : The 7-period SMA often acts as dynamic support or resistance in a trending market, where traders might use it to enter or exit positions based on how price interacts with this level.
- 25-period Moving Average (Medium-Term) :
The 25-period SMA smooths out more of the noise compared to the 7-period, providing a more stable indication of intermediate trends. This moving average is often used to gauge the market's supply and demand balance over a broader timeframe than the short-term 7-period SMA.
- Supply/Demand Balance : The 25-period SMA reflects the medium-term equilibrium between supply and demand. A crossover between the price and the 25-period SMA may indicate a shift in this balance. When price sustains above the 25-period SMA, it shows that demand is strong enough to maintain an upward trend. Conversely, if the price stays below it, supply is likely exceeding demand.
Is current price > average price in past 25 candles (depending on timeframe)? This will tell you how aggressive buyers are in mid term.
- Momentum Shift : Crossovers between the 7-period and 25-period SMAs can indicate momentum shifts between short-term and medium-term demand. For example, if the 7-period crosses above the 25-period, it often signifies growing short-term demand relative to the medium-term trend, signaling potential buy opportunities. What this crossover means is that if 7MA > 25MA that means in past 7 candles average price is more than past 25 candles.
- 99-period Moving Average (Long-Term):
The 99-period SMA represents the long-term trend and reflects the market's supply and demand over an extended period. This moving average filters out short-term fluctuations and highlights the market's overall trajectory.
- Long-Term Supply/Demand Dynamics : The 99-period SMA is slower to react to changes in supply and demand, providing a more stable view of the market's overall trend. Price staying above this line shows sustained demand dominance, while price consistently staying below reflects ongoing supply pressure.
Is current price > average price in past 99 candles (depending on timeframe)? This will tell you how aggressive buyers are in long term.
- Market Trend Confirmation : When both the 7-period and 25-period SMAs are above the 99-period SMA, it signals a strong bullish trend with demand outweighing supply across all timeframes. If all three SMAs are below the 99-period SMA, it points to a bear market where supply is overpowering demand in both the short and long term.
2. Price Action Perspective :
- 7-period Moving Average (Short-Term Trends):
The 7-period moving average closely tracks price action, making it highly responsive to quick shifts in price. Traders often use it to confirm short-term reversals or continuations in price action. In an uptrend, price typically stays above the 7-period SMA, whereas in a downtrend, price stays below it.
- Short-Term Price Reversals : Crossovers between the price and the 7-period SMA often indicate short-term reversals. When price breaks above the 7-period SMA after staying below it, it suggests a potential bullish reversal. Conversely, a price breakdown below the 7-period SMA could signal a bearish reversal.
- 25-period Moving Average (Medium-Term Trends) :
The 25-period SMA helps identify the medium-term price action trend. It balances short-term volatility and longer-term stability, providing insight into the more persistent trend. Price pullbacks to the 25-period SMA during an uptrend can act as a buying opportunity for trend traders, while pullbacks during a downtrend may offer shorting opportunities.
- Pullback and Continuation: In trending markets, price often retraces to the 25-period SMA before continuing in the direction of the trend. For instance, if the price is in a bullish trend, traders may look for support at the 25-period SMA for potential continuation trades.
- 99-period Moving Average (Long-Term Trend and Market Sentiment ):
The 99-period SMA is the most critical for identifying the overall market trend. Price consistently trading above the 99-period SMA indicates long-term bullish momentum, while price staying below the 99-period SMA suggests bearish sentiment.
- Trend Confirmation : Price action above the 99-period SMA confirms long-term upward momentum, while price action below it confirms a downtrend. The space between the shorter moving averages (7 and 25) and the 99-period SMA gives a sense of the strength or weakness of the trend. Larger gaps between the 7 and 99 SMAs suggest strong bullish momentum, while close proximity indicates consolidation or potential reversals.
- Price Action in Trending Markets : Traders often use the 99-period SMA as a dynamic support/resistance level. In strong trends, price tends to stay on one side of the 99-period SMA for extended periods, with breaks above or below signaling major changes in market sentiment.
Why These Numbers Matter:
7-Period MA : The 7-period moving average is a popular choice among short-term traders who want to capture quick momentum changes. It helps visualize immediate market sentiment and is often used in conjunction with price action to time entries or exits.
- 25-Period MA: The 25-period MA is a key indicator for swing traders. It balances sensitivity and stability, providing a clearer picture of the intermediate trend. It helps traders stay in trades longer by filtering out short-term noise, while still being reactive enough to detect reversals.
- 99-Period MA : The 99-period moving average provides a broad view of the market's direction, filtering out much of the short- and medium-term noise. It is crucial for identifying long-term trends and assessing whether the market is bullish or bearish overall. It acts as a key reference point for longer-term trend followers, helping them stay with the broader market sentiment.
Conclusion:
From a supply and demand perspective, the 7, 25, and 99-period moving averages help traders visualize shifts in the balance between buyers and sellers over different time horizons. The price action interaction with these moving averages provides valuable insight into short-term momentum, intermediate trends, and long-term market sentiment. Using these three MAs together gives a more comprehensive understanding of market conditions, helping traders align their strategies with prevailing trends across various timeframes.
------------- RULE BASED SYSTEM ---------------
Overview of the Rule-Based System:
This system will use the following moving averages:
7-period MA: Represents short-term price action.
25-period MA: Represents medium-term price action.
99-period MA: Represents long-term price action.
1. Trend Identification Rules:
Bullish Trend:
The 7-period MA is above the 25-period MA, and the 25-period MA is above the 99-period MA.
This structure shows that short, medium, and long-term trends are aligned in an upward direction, indicating strong bullish momentum.
Bearish Trend:
The 7-period MA is below the 25-period MA, and the 25-period MA is below the 99-period MA.
This suggests that the market is in a downtrend, with bearish momentum dominating across timeframes.
Neutral/Consolidation:
The 7-period MA and 25-period MA are flat or crossing frequently with the 99-period MA, and they are close to each other.
This indicates a sideways or consolidating market where there’s no strong trend direction.
2. Entry Rules:
Bullish Entry (Buy Signals):
Primary Buy Signal:
The price crosses above the 7-period MA, AND the 7-period MA is above the 25-period MA, AND the 25-period MA is above the 99-period MA.
This indicates the start of a new upward trend, with alignment across the short, medium, and long-term trends.
Pullback Buy Signal (for trend continuation):
The price pulls back to the 25-period MA, and the 7-period MA remains above the 25-period MA.
This indica
tes that the pullback is a temporary correction in an uptrend, and buyers may re-enter the market as price approaches the 25-period MA.
You can further confirm the signal by waiting for price action (e.g., bullish candlestick patterns) at the 25-period MA level.
Breakout Buy Signal:
The price crosses above the 99-period MA, and the 7-period and 25-period MAs are also both above the 99-period MA.
This confirms a strong bullish breakout after consolidation or a long-term downtrend.
Bearish Entry (Sell Signals):
Primary Sell Signal:
The price crosses below the 7-period MA, AND the 7-period MA is below the 25-period MA, AND the 25-period MA is below the 99-period MA.
This indicates the start of a new downtrend with alignment across the short, medium, and long-term trends.
Pullback Sell Signal (for trend continuation):
The price pulls back to the 25-period MA, and the 7-period MA remains below the 25-period MA.
This indicates that the pullback is a temporary retracement in a downtrend, providing an opportunity to sell as price meets resistance at the 25-period MA.
Breakdown Sell Signal:
The price breaks below the 99-period MA, and the 7-period and 25-period MAs are also below the 99-period MA.
This confirms a strong bearish breakdown after consolidation or a long-term uptrend reversal.
3. Exit Rules:
Bullish Exit (for long positions):
Short-Term Exit:
The price closes below the 7-period MA, and the 7-period MA starts crossing below the 25-period MA.
This indicates weakening momentum in the uptrend, suggesting an exit from the long position.
Stop-Loss Trigger:
The price falls below the 99-period MA, signaling the breakdown of the long-term trend.
This can act as a final exit signal to minimize losses if the long-term uptrend is invalidated.
Bearish Exit (for short positions):
Short-Term Exit:
The price closes above the 7-period MA, and the 7-period MA starts crossing above the 25-period MA.
This indicates a potential weakening of the downtrend and signals an exit from the short position.
Stop-Loss Trigger:
The price breaks above the 99-period MA, invalidating the bearish trend.
This signals that the market may be reversing to the upside, and exiting short positions would be prudent.

Supply and demandHi all!
This is my take on supply/demand. The gist is that it creates a zone if there is a big enough reaction. This is configurable in settings as "Minimum range (ATR factor)" (the Average True Length of length 14) that is the distance that the price must travel and "Reaction bars" that is the maximum number of bars that price must travel this distance. The zones that are shown are the ones that have a retest, break and retest or is unmitigated (untouched). If a zone is mitigated (entered) or broken it is temporarily hidden. For a zone to be created it needs to have this reaction and the previous bar does not.
So this script will show you zones that are fresh (unmitigated), retested or broken and retested. This means that the zones that are shown have "proven" that they are good zones through this. Basically it means that the script creates a bunch of zones and then picks the good once. This makes the script have some latency, but will hopefully give you good zones. A zone is completely removed if it's broken twice (it's okay if it's broken once and can still have a retest after it has flipped from previous supply (or resistance) into demand (or support)).
Here is a zone (the one that has the lowest opacity) that is broken and retested that could have resulted in a good long trade (the settings are default but has a stop in the beginning of 2024):
You have a setting to remove zones that are pierced (broken by price wicks). The following zone is pierced by price (in the beginning of May) that will not be shown after the start of May if you have "Pierced" checked (the indicator has default settings but a stop in the middle of April):
You have a trend section. Zones that create a reaction upwards can only be created if the trend is considered to be up, and vice versa. The options here are "SMA50" (the current price needs to be over the Simple Moving Average of length 50) and "SMA50, SMA200" (price needs to be over the Simple Moving Average of length 50 and the Simple Moving Average of length 50 needs to be over the Simple Moving Average of length 200). If these conditions are met the trend is considered to be up, otherwise it's down. You can disable this by choosing "No detection".
The zones that are shown also need to be within a limit (of the current price). This limit is 10 (factor of the Average True Range if length 14) by default. Set this to 0 to deactivate. This is useful for not showing zones that are far away from current price and therefore unlikely to be interacted with.
You can stop the calculation of zones (through the "Stop" value in the settings). This is useful to see if previous zones were any good. I used it in my testing of the script but left it because it can be nice to have.
The zones created by the script have different transparency based upon the zone's interaction. The clearest zones are the ones that are unmitigated, the second clearest ones are the ones having a retest and lastly the zones which are most unclear are the ones having a break and then a retest.
You can see the concept of this script to be a mix of supply/demand and support/resistance, having zones being unmitigated (untouched) as the most important but also show the zones having an interaction (in the form of a retest or a break and retest).
This is from a previous supply (or resistance) zone that has flipped into demand (or support) and has shown to be a good zone through a retest followed by a rally (default settings):
This zone has multiple retest and then rallies that could have given a good long trades (it has the default settings but a "Stop" time at 2022-01-14):
TODO:
- Create zones based on pivots
- Handle overlapping zones
- Incorporate volume in the creation and/or interaction with zones
- Add alerts
- Add ability to set maximum zone width
- Add ability to set the maximum number of retest bars
- ...?
The example for this publication has the default settings bit a "Stop" and a tighter "Limit" of 4.
I hope this explanation makes sense, let me know otherwise. Also let me know if you have any suggestions on improvements.
Best of trading luck!

Advanced Supply and Demand Indicator# Advanced Supply and Demand Indicator
This Pine Script™ indicator helps traders identify potential supply and demand zones in financial markets. It uses price action, volume, and historical data to plot these zones on your chart, providing valuable insights for trading decisions.
## Key Features:
- Automatically detects and plots supply and demand zones
- Customizable lookback period for zone identification
- Adjustable strength multiplier for more precise zone detection
- User-defined opacity for visual clarity
- Combines price action and volume analysis for improved accuracy
## How It Works:
1. Identifies significant price levels using a specified lookback period
2. Analyzes volume data to confirm potential supply and demand zones
3. Plots supply zones in red and demand zones in green
4. Displays the current price for easy reference
## Customization Options:
- Lookback Period: Adjust the historical data range (1-100 bars)
- Zone Strength Multiplier: Fine-tune the sensitivity of zone detection (1.0-3.0)
- Zone Opacity: Set the transparency of plotted zones (10-100%)
This indicator is designed to help traders identify potential areas of support and resistance, allowing for more informed entry and exit decisions in their trading strategies.

CPR by NKDCentral Pivot Range (CPR) Trading Strategy:
The Central Pivot Range (CPR) is a widely-used tool in technical analysis, helping traders pinpoint potential support and resistance levels in the market. By using the CPR effectively, traders can better gauge market trends and determine favorable entry and exit points. This guide explores how the CPR works, outlines its calculation, and describes how traders can enhance their strategies using an extended 10-line version of CPR.
What Really Central Pivot Range (CPR) is?
At its core, the CPR consists of three key lines:
Pivot Point (PP) – The central line, calculated as the average of the previous day’s high, low, and closing prices.
Upper Range (R1) – Positioned above the Pivot Point, acting as a potential ceiling where price may face resistance.
Lower Range (S1) – Found below the Pivot Point, serving as a potential floor where price might find support.
Advanced traders often expand on the traditional three-line CPR by adding extra levels above and below the pivot, creating up to a 10-line system. This extended CPR allows for a more nuanced understanding of the market and helps identify more detailed trading opportunities.
Applying CPR for Trading Success
1. How CPR is Calculation
The CPR relies on the previous day's high (H), low (L), and close (C) prices to create its structure:
Pivot Point (PP) = (H + L + C) / 3
First Resistance (R1) = (2 * PP) - L
First Support (S1) = (2 * PP) - H
Additional resistance levels (R2, R3) and support levels (S2, S3) are calculated by adding or subtracting multiples of the previous day’s price range (H - L) from the Pivot Point.
2. Recognizing the Market Trend
To effectively trade using CPR, it’s essential to first determine whether the market is trending up (bullish) or down (bearish). In an upward-trending market, traders focus on buying at support levels, while in a downward market, they look to sell near resistance.
3. Finding Ideal Entry Points
Traders often look to enter trades when price approaches key levels within the CPR range. Support levels (S1, S2) offer buying opportunities, while resistance levels (R1, R2) provide selling opportunities. These points are considered potential reversal zones, where price may bounce or reverse direction.
4. Managing Risk with Stop-Loss Orders
Proper risk management is crucial in any trading strategy. A stop-loss should be set slightly beyond the support level for buy positions and above the resistance level for sell positions, ensuring that losses are contained if the market moves against the trader’s position.
5. Determining Profit Targets
Profit targets are typically set based on the distance between entry points and the next support or resistance level. Many traders apply a risk-reward ratio, aiming for larger potential profits compared to the potential losses. However, if the next resistance and support level is far then middle levels are used for targets (i.e. 50% of R1 and R2)
6. Confirmation Through Other Indicators
While CPR provides strong support and resistance levels, traders often use additional indicators to confirm potential trade setups. Indicators such as moving averages can
help validate the signals provided by the CPR.
7. Monitoring Price Action At CPR Levels
Constantly monitoring price movement near CPR levels is essential. If the price fails to break through a resistance level (R1) or holds firm at support (S1), it can offer cues on when to exit or adjust a trade. However, a strong price break past these levels often signals a continued trend.
8. Trading Breakouts with CPR
When the price breaks above resistance or below support with strong momentum, it may signal a potential breakout. Traders can capitalize on these movements by entering positions in the direction of the breakout, ideally confirmed by volume or other technical indicators.
9. Adapting to Changing Market Conditions
CPR should be used in the context of broader market influences, such as economic reports, news events, or geopolitical shifts. These factors can dramatically affect market direction and how price reacts to CPR levels, making it important to stay informed about external market conditions.
10. Practice and Backtesting for Improvements
Like any trading tool, the CPR requires practice. Traders are encouraged to backtest their strategies on historical price data to get a better sense of how CPR works in different market environments. Continuous analysis and practice help improve decision-making and strategy refinement.
The Advantages of Using a 10-Line CPR System
An extended 10-line CPR system—comprising up to five resistance and five support levels—provides more granular control and insight into market movements. This expanded view helps traders better gauge trends and identify more opportunities for entry and exit. Key benefits include:
R2, S2 Levels: These act as secondary resistance or support zones, giving traders additional opportunities to refine their trade entries and exits.
R3, S3 Levels: Provide an even wider range for identifying reversals or trend continuations in more volatile markets.
Flexibility: The broader range of levels allows traders to adapt to changing market conditions and make more precise decisions based on market momentum.
So in Essential:
The Central Pivot Range is a valuable tool for traders looking to identify critical price levels in the market. By providing a clear framework for identifying potential support and resistance zones, it helps traders make informed decisions about entering and exiting trades. However, it’s important to combine CPR with sound risk management and additional confirmation through other technical indicators for the best results.
Although no trading tool guarantees success, the CPR, when used effectively and combined with practice, can significantly enhance a trader’s ability to navigate market fluctuations.

RSI/MFI Divergence Finder [idahodev]Monitoring RSI (Relative Strength Index) and MFI (Money Flow Index) divergences on a stock or index chart offers several benefits to traders and analysts. Let's break down the advantages:
Comprehensive Market View: Combining both indicators provides a more complete picture of market conditions, as they measure different aspects of price movement. RSI focuses on recent gains/losses relative to price change, while MFI incorporates volume data to assess money flow in and out of a security.
Enhanced Signal Accuracy: When divergences occur simultaneously in both RSI and MFI, it may be considered a stronger signal than if only one indicator showed divergence. This can potentially lead to more reliable trading decisions.
Identification of False Breakouts: Divergences between these indicators and price action can help identify false breakouts or misleading price movements that are not supported by underlying market strength or volume.
More Nuanced Market Understanding: By examining divergent behavior between money flow (MFI) and momentum (RSI), traders gain a more detailed comprehension of the interplay between these factors in shaping market trends.
Early Warning Signs: These divergences can act as early warning signs for potential trend reversals or changes in market sentiment, allowing traders to adjust their strategies proactively.
It's important to note that RSI/MFI divergences should be used as part of a broader trading strategy rather than solely relying on them for buy/sell signals. They can serve as valuable tools for confirming trends, identifying potential turning points, or warning against overbought/oversold conditions.
When using these indicators together, traders must be cautious of false signals, especially in choppy markets or during periods of high volatility. It's crucial to combine this analysis with other technical and fundamental factors before making trading decisions.
In summary, monitoring RSI/MFI divergences may offer a way to gain insights into the underlying strengths and weaknesses of market movements.
This utility differs from other in that it allows for a choke/threshold/sensitivity setting to help weed out noisy signals. This needs to be carefully adjusted per chart.
It also allows for tuning of the MFI smoothing length (number of bars on the current chart) as well as how many previous bars it will take into consideration when calculating RSI and MFI divergences. It will signal when it sees alignment forming between RSI and MFI divergences in a direction. You will likely need to tune this script's settings every few days or at least anytime there is a change in overall market behavior or sustained volatility.
Ultimately, the goal with this script is to provide an additional level of confirmation of weakness or strength. It should be combined with other indicators such as exhaustion, pivots, supply/demand, trendline breaks or tests, and structure changes, to name a few complementary tools or strategies. It's not meant to be a standalone buy/sell signal indicator!
Here are some settings for futures that may help you get started:
ES (4m chart)
RSI Length: 26
MFI Length: 8
MFI Smoothing Length: 32
Divergence Sensitivity: 124
Left Bars for Pivot: 10
Right Bars for Pivot: 1
NQ (4m chart)
RSI Length: 14
MFI Length: 14
MFI Smoothing Length: 21
Divergence Sensitivity: 400
Left Bars for Pivot: 21
Right Bars for Pivot: 1
YM (4m chart)
RSI Length: 14
MFI Length: 14
MFI Smoothing Length: 21
Divergence Sensitivity: 810
Left Bars for Pivot: 33
Right Bars for Pivot: 1

Multi-Timeframe SMA Plot**Introducing the Multi-Timeframe SMA Plot**
This script is designed to help traders easily visualize multiple Simple Moving Averages (SMAs) across different timeframes, all on a single chart. The Multi-Timeframe SMA Plot allows you to configure up to three different SMAs with customizable lengths, timeframes, colors, line styles, and line thicknesses, providing a versatile tool to analyze market trends in various granularities.
**Key Features**:
1. **Multiple SMA Timeframes**: You can plot SMAs from different timeframes like 15 minutes, 1 hour, daily, weekly, and more, enabling a comprehensive perspective of market movements.
2. **Fully Customizable**: Each SMA comes with options to adjust the length, timeframe, color, line style (solid, dashed, or dotted), and thickness, giving you control over how you visualize trend data.
3. **User-Friendly Inputs**: The script provides intuitive input fields that make it easy to adjust the settings without diving into the code, making it suitable for both beginner and advanced traders.
**How to Use**:
- Select the desired length and timeframe for each SMA (e.g., 50-period SMA on a 1-hour chart).
- Customize the line style and color to match your chart's theme or make distinctions between each SMA.
- Analyze how different SMAs align or cross over time to identify potential support, resistance, or trend changes.
The Multi-Timeframe SMA Plot is ideal for traders who rely on moving averages to gauge trend strength, direction, and potential entry or exit points. By having multiple SMAs from different timeframes on one chart, you can better understand the overall market sentiment and make more informed decisions.
Give this script a try and streamline your technical analysis with clear, customizable SMA lines!
**Code**: Check out the full script and start customizing it to fit your trading style. Your feedback is always welcome!

Ping Pong Bot StrategyOverview:
The Ping Pong Bot Strategy is designed for traders who focus on scalping and short-term opportunities using support and resistance levels. This strategy identifies potential buy entries when the price reaches a key support area and shows bullish momentum (a green bar). It aims to capitalize on small price movements with predefined risk management and take profit levels, making it suitable for active traders looking to maximize quick trades in trending or ranging markets.
How It Works:
Support & Resistance Calculation:
The strategy dynamically identifies support and resistance levels using the lowest and highest price points over a user-defined period. These levels help pinpoint potential price reversal areas, guiding traders on where to enter or exit trades.
Buy Entry Criteria:
A buy signal is triggered when the closing price is at or below the support level, and the bar is green (i.e., the closing price is higher than the opening price). This ensures that entries are made when prices show signs of upward momentum after hitting support.
Risk Management:
For each trade, a stop loss is calculated based on a user-defined risk percentage, helping to protect against significant drawdowns. Additionally, a take profit level is set at a ratio relative to the risk, ensuring a disciplined approach to exit points.
0.5% Take Profit Target:
The strategy also includes a 0.5% quick take profit target, indicated by an orange arrow when reached. This feature helps traders lock in small gains rapidly, making it ideal for volatile market conditions.
Customizable Inputs:
Length: Adjusts the period for calculating support and resistance levels.
Risk-Reward Ratio: Allows traders to set the desired risk-to-reward ratio for each trade.
Risk Percentage: Defines the risk tolerance for stop loss calculations.
Take Profit Target: Enables the customization of the quick take profit target.
Ideal For:
Traders who prefer an active trading style and want to leverage support and resistance levels for precise entries and exits. This strategy is particularly useful in markets that experience frequent price bounces between support and resistance, allowing traders to "ping pong" between these levels for profitable trades.
Note:
This strategy is developed mainly for the 5-minute chart and has not been tested on longer time frames. Users should perform their own testing and adjustments if using it on different time frames.

Chandelier Exit Pro w/ExtensionsChandelier Exit Pro w/Extensions
The Chandelier Exit Pro w/Extensions indicator is designed to assist traders in managing risk and identifying trend reversals. The strategy is based on the Chandelier Exit concept, originally created by Charles Le Beau. It uses the Average True Range (ATR) to calculate dynamic stop levels that adjust based on market volatility. This script not only implements the standard Chandelier Exit, but also introduces extension levels and alerts to enhance decision-making.
Key Features:
➡️Dynamic Stop Levels: The indicator calculates stop levels for both long and short positions based on an ATR multiple. This allows traders to determine exit points by monitoring when the price crosses above or below these levels. These levels adapt in real-time based on price volatility, making them a versatile tool for trend-following strategies.
➡️Extension Levels: In addition to the primary stop levels, the script includes extension levels for more advanced stop-loss management. Traders can view active and extension levels separately, providing more flexibility in their exit strategies.
➡️Labels and Visual Cues: The indicator provides dynamic labels that automatically update and follow the plotted stop levels. Labels include the ATR multiplier value (e.g., "2.5" or "2.5ext"), clearly showing the significance of each level. When price crosses below or above a level, the corresponding label is highlighted, aiding traders in quickly identifying the most relevant stop level.
➡️Bar Confirmation and Alerts: The script includes an "await bar confirmation" option to ensure that the stop levels and alerts only trigger after the bar has closed. Alerts are customizable and will notify traders when price crosses critical levels, helping to make timely decisions without the need to constantly monitor charts.
➡️Multiple ATR Levels for Enhanced Precision: The indicator supports up to four different ATR levels, each with customizable multipliers. This allows traders to set different thresholds for exits based on varying degrees of volatility. For example, Level 1 (2.5x ATR) might represent a tighter stop, while Level 4 (10x ATR) could serve as a wider stop for long-term positions.
➡️Calc_bars_count: Improves efficiency of the indicator by reducing the on-chart calculations in to the past. This input can be found at the bottom of the INPUTS tab.
How it Helps Traders:
💥Trend Identification: By using the Chandelier Exit levels, traders can identify when the trend is likely to reverse. When the price crosses below the stop level in a long trade or above the stop level in a short trade, it signals a potential exit point.
💥Volatility-based Adjustments: Unlike static stop-loss methods, the ATR-based stop levels dynamically adjust based on the market’s volatility. This means tighter stops during low volatility periods and wider stops during high volatility periods, reducing the chance of being stopped out prematurely.
💥Risk Management: The dynamic stop levels and extension levels provide a structured way to manage risk. Traders can set tighter stops for short-term trades and wider stops for longer-term trades. The script's visual labels make it easy to track these levels in real-time.
💥Automation with Alerts: The built-in alert system ensures that traders are notified when key levels are crossed. This helps to avoid emotional decision-making and allows for better execution of trading strategies.
Confluence and Price Fluidity:
One of the powerful ways to enhance the effectiveness of the Chandelier Exit indicator is by using it in conjunction with other technical analysis tools to create confluence. Confluence occurs when multiple indicators or price action signals align, providing stronger confirmation for a trade decision. For example:
🎯Support and Resistance Levels: Traders can use the Chandelier Exit levels in combination with key support and resistance zones. If the price is nearing a support level and the Chandelier Exit signals a bullish reversal, this alignment strengthens the case for entering a long position.
🎯Moving Averages: When the Chandelier Exit signals a trend reversal and this is confirmed by a crossover in moving averages (such as a 50-day and 200-day moving average), traders gain additional confidence in the trade direction.
🎯Momentum Indicators: Traders can also look for momentum indicators like RSI or MACD to confirm the strength of a trend or potential reversal. For instance, if the Chandelier Exit triggers a short signal and the RSI also shows overbought conditions, this could provide stronger confirmation to exit a long trade or enter a short position.
🎯Candlestick Patterns: Price fluidity can be monitored using candlestick formations. For example, a bearish engulfing pattern near a Chandelier Exit resistance level offers confluence, adding confidence to the signal to close or short the trade.
By combining the Chandelier Exit with other tools, traders ensure that they are not relying on a single indicator. This layered approach can reduce the likelihood of false signals and improve overall trading accuracy.
Practical Use Case:
Imagine a trader enters a long position, and the price moves favorably. Using the Chandelier Exit, the trader sets the initial stop level at 2.5x ATR below the highest close. As the price continues to rise, the stop level follows the price, locking in profits. If the market suddenly turns, the price crossing below the stop level signals an exit, helping the trader preserve gains. With extension levels, the trader can further refine exits, adjusting based on their risk tolerance and market conditions.
Good luck and I hope that you can find a place in your tool bag to use this dynamic indicator 🙏

Liquidity Pools [LuxAlgo]The Liquidity Pools indicator identifies and displays estimated liquidity pools on the chart by analyzing high and low wicked price areas, along with the amount, and frequency of visits to each zone.
🔶 USAGE
Liquidity Pools are areas where smaller participants are likely to place stop-limit orders to manage risks at reasonable swing points. These zones attract institutional traders who use the pending orders as liquidity to enter larger positions, aiming to influence price movements. By monitoring these zones, traders can anticipate market movements and potentially benefit from these dynamics.
Beyond general liquidity theory, identifying zones consistently visited by price aids in using them as support and resistance zones. By analyzing these areas, we can assess how effectively participants enter or exit these zones, helping to gauge their importance.
In the screenshots below, we will explore both sides of the same chart in more detail to display how each zone could be viewed from a bullish and bearish perspective.
Bullish Zones Example:
Bearish Zones Example:
🔶 DETAILS
The method behind this indicator focuses on identifying a swing point and tracking future interactions with it. It adaptively identifies high and low "potential zones". These zones are monitored over time; if a zone meets the user-defined criteria, the script marks and displays these zones on the chart.
🔹 Identification
The method to identify Liquidity Pools in this indicator revolves around 3 main parameters. By utilizing these settings, the indicator can be tailored to produce zones that fit the specific strategic needs of each trader.
Zone Identification Parameters
Zone Contact Amount: This setting determines the number of times each zone must be in contact with the price (and bought or sold out of) before being identified by the indicator as a Liquidity Pool.
For example: When a zone is first displayed, it is considered as having been reached 1 time. When the zone is re-tested for the first time, this is considered the 2nd contact, since the price has seen the zone a total of 2 times.
Bars Required Between Each Contact: This is used to rule out (or in) consecutive candles reaching each zone from the calculation, adding a separation length between zone contact points to refine the zones produced.
For example: When set to "2", the first contact point (first re-test) will be ignored by the script if it is not at least 2 bars away from the initial zone proposal point.
Confirmation Bars: After a zone has reached the desired Contact Amount, this setting will cause the script to wait a specified number of bars before identifying a zone. While this might initially seem counterintuitive, by waiting, we are able to watch the market's reaction to the proposed zone and respond accordingly. If the price were to continue through the potential liquidity zone Immediately, it would not be logical to consider this area as a valid Liquidity Pool.
Displayed in this screenshot, you will see the specific points we are looking for in order to identify these zones.
🔹 Display
After a Liquidity Pool is identified, its boundary line is extended to the current price to keep it in view for reference. This extension will continue until the zone is mitigated (price has closed above or below the zone), after which it will stop extending.
Candles can optionally be colored when returning to the most recent Liquidity Pool if it is still unmitigated, and will only color after the zone is displayed on the chart. Because of this, if a candle is colored within a zone, then its color comes from being inside a previously unmitigated zone.
🔹 Volume
Each time a candle overlaps an Unmitigated Zone, a percentage of its volume will be accumulated to the total for each specific zone. The volume total is displayed on the right end of the extended boundary lines.
This volume data could help to determine the importance of specific zones based on the amount of volume traded within.
Note: This volume is fractional to the percentage of candles that are contained within the zone. If a candle is 50% within a zone, The zone will receive 50% of the candle's volume added to its current total.
🔶 SETTINGS
See above for a more detailed explanation of the "Zone Identification" parameters.
Zone Contact Amount: The number of times the price must bounce from this zone before considering it as a liquidity pool.
Bars Required Between Each Contact: The number of bars to wait before checking for another zone contact.
Confirmation Bars: The number of bars to wait before identifying a zone to confirm validity.
Display Volume Labels: Toggles the display for the volume readout for each Liquidity Pool.
Fill Candles Inside Zones: Toggles the display of colored candles within Liquidity Pools.
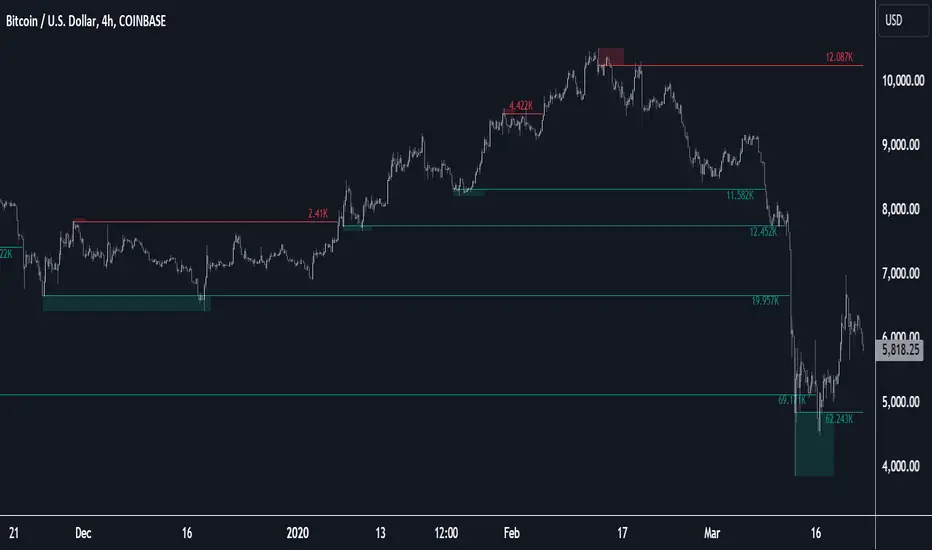
Delayed Opening Price Line with GuardrailsThis Delayed Opening Price Line with Guardrails indicator will draw 5 price level lines on the chart each day, beginning at the open of the first candle after a delay period specified by the user in the indicator settings. The default delay is 30 minutes from market open.
The lines are drawn at the open price of the first candle after the delay period, and then a specified increment above and below that price level. These increments default to 80 and 100, and can be adjusted in the indicator settings.
Most markets, indices, and equities have a finite and consistent range of price movement within a trading day. Eg. a particular stock may usually move no more that $50 up or down in a given day, which can be proven by looking at a historical chart. This indicator allows the user to quickly display that range on the chart once it's been defined.
Important note: This indicator is designed to be used on an intra-day chart - eg. minutes, or hourly. It will give an error if used on a longer time-frame chart.
