Triple ThreatThis indicator provides buy and sell signals for Bitcoin based on confluence from well-known momentum, volatility, and trend indicators. It has successfully captured the major directional trends on Bitcoin's daily chart since 2018, and the settings are currently optimized for this chart in particular. This indicator implements RSI to gauge momentum, BBWP to gauge volatility, and an EMA to gauge trend. Maximum confluence signals are represented by horizontal bars in the indicator's pane, where the tallest green bar is a confirmed buy signal, and the tallest red bar is a confirmed sell signal. The shortest bar represents a momentum-only signal, and the second-shortest bar represents a volatility signal in confluence with the previously given momentum signal.
To track momentum, the RSI is plotted to the indicator plane against a moving average of the RSI. A momentum signal is generated when the RSI crosses over its moving average, retests/approaches the moving average, and then continues in the crossover direction (i.e., it fails to cross the moving average to the opposite side, creating a successful retest). The settings that affect this trigger are the "Crossover Threshold," which specifies how much the RSI should exceed the moving average to be considered a crossover, and the "Retest threshold," which specifies how closely the RSI should approach the moving average to be considered a retest. A momentum signal is ALSO generated if the RSI or its moving average exceed their counterpart by a certain threshold. For example, if the threshold was set at 10, a BUY signal would be generated when the RSI exceeds the moving average by 10, or a SELL signal would be generated when the moving average exceeds the RSI by 10. This threshold can be set using the "Instant Signal Threshold" setting. Either type of momentum signal will be plotted on the pane as the shortest horizontal bar, with its color indicating the signal's direction.
Volatility is primarily measured using the Bollinger Band Width Percentile (BBWP) indicator, which was created by The_Caretaker. BBWP plots the volatility of the asset's price, given by Bollinger Band width, relative to past volatility by assigning the volatility readings into percentiles. The indicator also includes a moving average of the BBWP itself, where a crossover to the upside represents expanding volatility and a crossover to the downside represents contracting volatility. This indicator is used to confirm a signal given by the momentum indicators - a momentum signal that is given during a period of expanding volatility has a greater likelihood of success. Therefore, when the BBWP crosses above its moving average by a given threshold, a previously triggered momentum signal is considered to be "confirmed." The threshold for this crossover can be set using the "BBWP Confirmation Threshold" setting. However, it is also relevant that periods of extreme volatility often accompany an extremity in price action (a "top" or "bottom"), in which case the BBWP is likely to contract after price reaches such an extremity. This phenomenon is captured by also using "extreme reads" on the momentum indicator to signal that there has already been enough volatility to confirm a momentum signal. If the RSI gives an "extreme read" before triggering a signal, the momentum signal is also considered to be confirmed. For example, if the RSI is above 80, breaks below 80, and then gives a SELL signal, this sell signal is considered to be confirmed without requiring the BBWP to crossover its moving average to the upside. The threshold that would confirm a SELL signal can be set with the "Overbought" setting, and the threshold that would confirm a BUY signal can be set with the "Oversold" setting. Whenever a volatility signal confirms a momentum signal, a medium-sized horizontal bar will be plotted on the pane in the same directional color as the momentum signal. Note that a momentum signal may trigger at the exact same time as the volatility signal which confirms it; in this case, only the medium-sized bar will be visible on the pane, but its direction can still be identified by its color.
Lastly, to reduce the likelihood of "false signals," a trend indicator is used to confirm the direction of the signal. This is typically an exponential moving average. If a confirmed volatility SELL signal is given, and the closing price is below the moving average, then the SELL signal is also confirmed by the trend. Likewise, if a confirmed volatility BUY signal is given, and the closing price is above the moving average, then the BUY signal is confirmed by the trend. The type and length of the moving average used to verify the trend can be set using the "Moving Average Type" and "Moving Average Length" settings found below the momentum/volatility settings. A trend signal is plotted on the pane as a tall horizontal bar, and is more deeply colored than the momentum and volatility signals.
For maximum confluence, it is recommended that the trend signal, given by the tallest bar, is the one that forms the basis of trades executed while using the Triple Threat indicator. It is possible to enter more aggressive trades with better entries by using only the volatility signal, given by the medium-sized bar, however this entails greater risk and should only be done in confluence with an additional trading strategy of your own discretion. Backtesting has shown that using the volatility signal alone underperforms using the volatility signal in confluence with the trend signal.
Please also be advised that the default setting are optimized for Bitcoin's daily chart only. The indicator is still applicable to other timeframes and asset classes, but the settings may need to be modified. I have a list of settings for other Bitcoin timeframes, and I would be happy to share them upon request.
I hope you can find this indicator to be of some use to your trading strategies. I'd be happy to hear any feedback from the community, so please don't hesitate to reach out. Stay safe, and happy trading.
Strategy

TT Price/Trend IndicatorThe TT Price/Trend Indicator identifies potential trend changes and advises of safe places to set orders at retracements.
Main Signals:
When a "BUY" signal prints, it is suggested to set a buy order at the Blue trendline and wait until price retraces back.
When a "SELL" signal prints, it is suggested to set a short order at the Blue trendline and wait until price rises up.
Take Profit:
The Reactive Trendline (the thick line that switches from Green to Red, and Red to Green frequently) is good at finding local bottoms.
It is suggested to Take Profit on your Long once you see the first switch from Green to Red. If the Reactive Trendline is already Red when your LONG order is filled, wait until it goes from Red-Green-Red to Take Profit.
It is suggested to Take Profit on your Short once you see the first switch from Red to Green. If the Reactive Trendline is already Green when your SHORT order is filled, wait until it goes from Green-Red-Green to Take Profit.
Stop Loss Suggestions:
If you are LONG (BUY), set your Stop/Loss to slightly below the last Higher Low (HL)
If you are SHORT (SELL), set your Stop/Loss to slightly above the last Lower High (LH)
Alternatively, if you want to maximise your Risk:Reward ratio, you can CLOSE your order once a candle engulfs and closes over both the Blue Line AND the Grey Line. Once these levels are broken and you are underwater, the risk to hold that position is no longer worth it. However, this approach can shake you out of winning trades, so I advise you to use other strategies such as Volume, Fibonnaci and RSI etc to help you make a final decision.
Important: If you are taking this approach, don't panic sell - wait for the close of the current engulfing candle to make this decision, because quite often it will just be a wick up or down in your favour.
What are the best Strategies?
The best timeframes are as follows:
- 1 Hour
- 2 Hour
- 4 Hour
- 1 Day
- 1 Week
My Favourite is 1 Hour.
Scalping for advanced traders:
- 1 minute
- 5 minutes
If you are scalping, it is highly recommended to use the TT Volume Indicator as well, to confirm price with volume (see scripts under my profile). Price on its own will not be good enough.
I also recommend the RSI with a 14 SMA to identify Strength breakouts.
Other Features:
- VWAP (Dotted Red/Green line) - this is common liquidity and can be one of the most important Support/Resistance levels in Crypto, which is why it is included.
Can you FOMO order?
Unless you are using this with a combination of other indicators (such as the TT Volume Indicator), it is not recommended to FOMO orders at the "BUY" or "SELL" signal unless you have a clear volume breakout. Please see this explanation on FOMO ordering for further information:

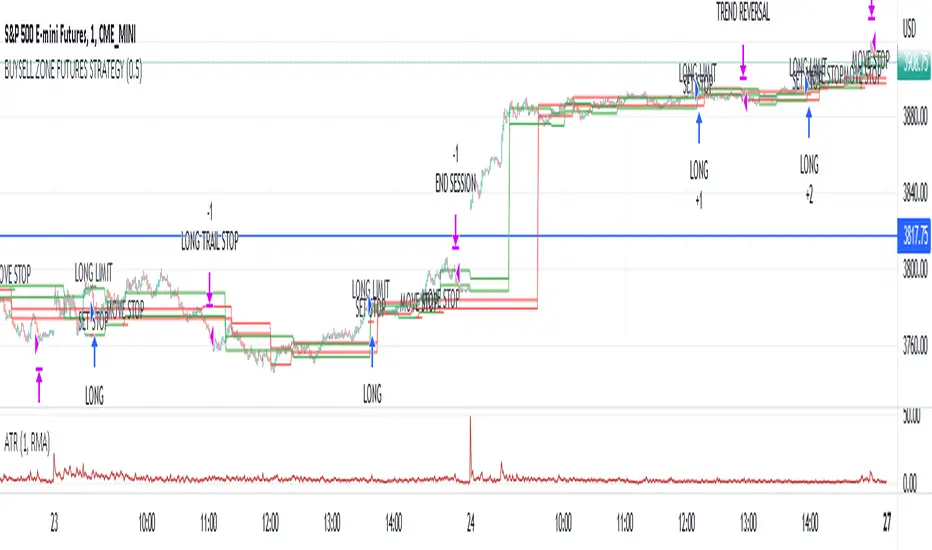
Market structure intraday ES futures strategy - BuySell ZonesThis market structure strategy for ES Mini Futures optimized for intraday market analysis ( RTH ).
Entry condition identified by bearish and bullish market structure.
Support level (Green Lines) is identified based on different variations of price fluctuations followed by the close above the range.
Resistance level (Red Lines) is identified based on different variations of price fluctuations followed by the close below the range.
The idea is to spot areas where market players were fighting for the best price and one side finally won.
Bullish trend is identified by consecutive series of support levels developing in upside direction.
Bearish trend is identified by consecutive series of resistance levels developing in downside direction.
When market develops bullish trend , strategy sets LONG limit order at fresh support level .
When market develops bearish trend , strategy sets SHORT limit order at fresh resistance level .
If there is an open position no new entries are performed.
For longs initial stop is set at previous support level adjusted by ATR.
For shorts stop is set at previous resistance level adjusted by ATR.
Stop trailing is also based on market structure.
If new support level is identified, stop moves to previous support level .
If new resistance level is identified, stop moves to previous resistance level .
There are no target. Strategy either gets stopped at current stop level or exits at session end.
Strategy calculates position size based on the previous market structure and ATR.
Strategy performs compounding position sizing so as account amount increases so does amount of traded contracts.
Usage:
Add script to your favorites and apply it on ES1! 1 minute time frame setting regular trading hours.
Script will print the limit order as well as stop levels according to the rules described above. As trade will progress, script will print levels to move the stop to.
Settings:
I added an option to disable the support and resistance lines printing if you prefer to have clean charts.
You can also change risk % to best fit your trading style.
If you just want to use the support and resistance levels as indicator you can also disable the strategy execution.
Support and Resistance indicator itself is universal and can be used on any market or timeframe.
If you want the strategy to be optimized for other markets or timeframes or have other rule set in mind feel free PM me, we will create the solution that best fits your needs and styles.
Real life trading is not get rich scheme. It is continuous process that involves various steps and dedication. If you are willing to take this path please PM me to enable the strategy for you.
Enjoy!
Loft Strategy V1This strategy consists of a kalman filter (by alexgrover ) and a "stop and reverse" line which is following the kalman filter.
If the price goes in the same direction as the position side, the "stop and reverse" line approaches the kalman filter as set on the "Approach Decrease Step" parameter.

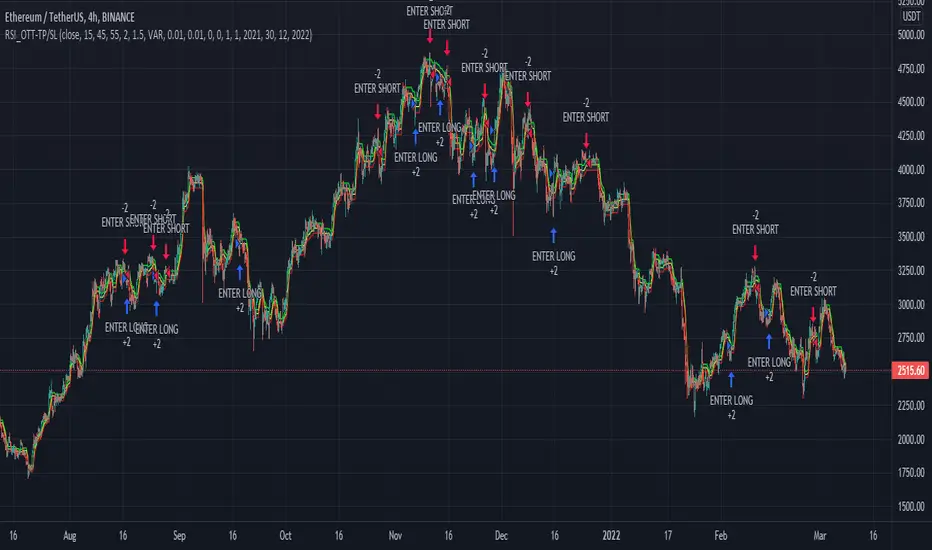
RSI_OTT - TP/SLWhile creating this strategy, I was inspired by "ott(by Anıl Özekşi)" and "RSI + Bollinger Double Strategy(by ChartArt)".
Basically, the strategy uses ott bands instead of bollinger bands in the "RSI+Bollinger Double Strategy".
User can select take profit, stop loss, position direction(long, short or both) and the other ott parameters via interface.
OTT-Stoch-TP/SLThis strategy combines stochastic oscillator and OTT (OTT is originally owned by Anıl Özekşi).
The strategy is triggered at fast OTT and slow OTT crossing points. User can select the "Evaluate Stoch OTT" option which is validate the crossing points through stochastic oscillator.
In the same way, user can select "take profit", "stop loss" and position direction(long, short or both) via interface.
By the way, Stoch OTT is not classic Stochastic oscillator. Actually, it is also combined classic stochastic oscillator and OTT for long term validation to base strategy.

RSI_Boll-TP/SLThis strategy is originally "Bollinger + RSI , Double Strategy (by ChartArt)"
I added just TP/SL exit point, position direction selection(long, short or both) and time window into that strategy.

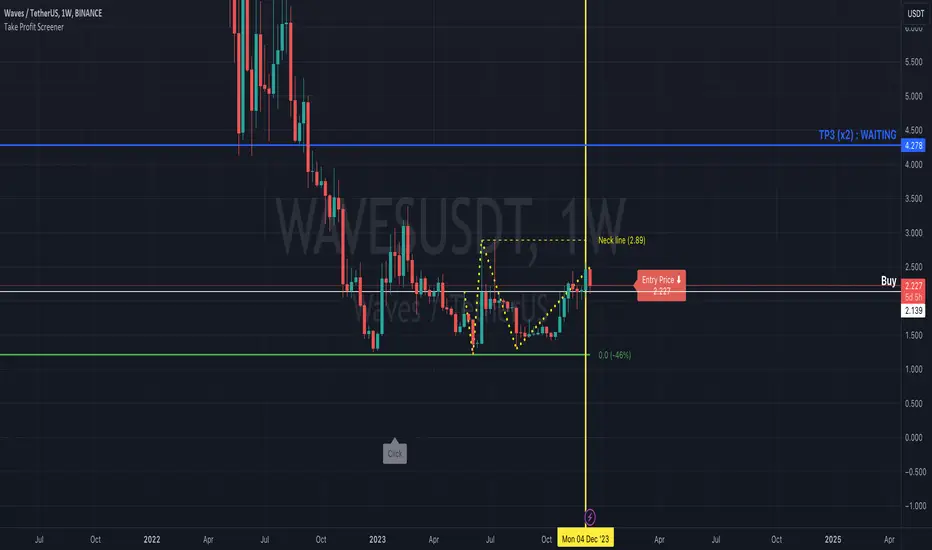
Take Profit ScreenerI'm going to introduce you to the Take Profit Screener tool.
It allows you to manually scan your watchlist to determine at a glance the assets that have the best profitability potential.
It is a 2 in 1 tool that allows you to :
identify where your Take Profit ratios are located whether you are in SHAD or Cycle Strategy
identify the potential reward percentages when approaching the key Fibonacci levels
Before you start using it, you need to:
sort your watchlist according to the price (Last) in order to have price ranges more or less close to each other when jumping from a symbol to another
disable the Auto Scale and Magnet feature
select your first symbol
display the tool (the indicator more exactly)
The settings dialog box is organised in 3 sections:
Strategy : By setting this section, you will answer the question " Where do my Take Profit ratios stand in relation to my entry price, and according to Risk Management Strategy adopted (SHAD or Cycle)? "
Fibonacci : By setting this section, you will answer the question " What percentage gain can I expect as I approach one of the key Fibonacci levels? "
Layout : This is the settings for the look and feel
Strategy Section
Active : This part of the indicator won't display on your chart if unchecked
Type : Choose between SHAD or Cycle Strategy. When choosing SHAD, you can select 2, 4, 8 or 16 SHAD Levels. When choosing Cycle, you can enter whatever ratio value you wish in the Strategy Ratio (Cycle only) input.
SHAD xNN : When choosing SHAD Strategy, you should select at least one level and more if need be.
Strategy Ratio (Cycle only) : When choosing Strategy Type Cycle, you can enter whatever ratio value you wish there.
Freeze Entry Price & Value : Leave it unchecked whenever the current price of the asset is located within your desired area (i.e. Reload Zone) while attempting to estimate its potential reward. Conversely, keep it checked whenever the current price of the asset is outside your desired area, but you need to anticipate the potential reward of this asset if its price reaches a certain level, your Entry price. Enter this price there and check the box.
Show price : If checked, both Take Profit ratio and Price are displayed. If unchecked, then price is hidden.
Extend Line : If checked, then lines showing Take Profit levels extend to the left.
Label Offset : If checked, then the label that displays Take Profit ratio and price shift to the right by a value that ranges from 0 to 100 candles.
Label Style : You can choose between Right or Top. This will determine the orientation of the label.
Fibonacci Section
Active : This part of the indicator won't display on your chart if unchecked
Type : Choose between SHAD or Cycle Strategy. When choosing SHAD, you can select 2, 4, 8 or 16 SHAD Levels. When choosing Cycle, you can enter whatever ratio value you wish in the Strategy Ratio (Cycle only) input.
SHAD xNN : When choosing SHAD Strategy, you should select at least one level and more if need be.
Strategy Ratio (Cycle only) : When choosing Strategy Type Cycle, you can enter whatever ratio value you wish there.
Freeze Entry Price : Leave it unchecked whenever the current price of the asset is located within your desired area (i.e. Reload Zone) while attempting to estimate its potential reward. Conversely, keep it checked whenever the current price of the asset is outside your desired area, but you need to anticipate the potential reward of this asset if its price reaches a certain level, your Entry price. Enter this price there and check the box.
Color : You can define the color of Fibonacci line levels
EDMA Scalping Strategy (Exponentially Deviating Moving Average)This strategy uses crossover of Exponentially Deviating Moving Average (MZ EDMA ) along with Exponential Moving Average for trades entry/exits. Exponentially Deviating Moving Average (MZ EDMA ) is derived from Exponential Moving Average to predict better exit in top reversal case.
EDMA Philosophy
EDMA is calculated in following steps:
In first step, Exponentially expanding moving line is calculated with same code as of EMA but with different smoothness (1 instead of 2).
In 2nd step, Exponentially contracting moving line is calculated using 1st calculated line as source input and also using same code as of EMA but with different smoothness (1 instead of 2).
In 3rd step, Hull Moving Average with 2/3 of EDMA length is calculated using final line as source input. This final HMA will be equal to Exponentially Deviating Moving Average.
EDMA Defaults
Currently default EDMA and EMA length is set to 20 period which I've found better for higher timeframes but this can be adjusted according to user's timeframe. I would soon add Multi Timeframe option in script too. Chikou filter's period is set to 25.
Additional Features
EMA Band: EMA band is shown on chart to better visualize EMA cross with EDMA .
Dynamic Coloring: Chikou Filter library is used for derivation of dynamic coloring of EDMA and its band.
Trade Confirmation with Chikou Filter: Trend filteration from Chikou filter library is used as an option to enhance trades signals accuracy.
Strategy Default Test Settings
For backtesting purpose, following settings are used:
Initial capital=10000 USD
Default quantity value = 5 % of total capital
Commission value = 0.1 %
Pyramiding isn't included.
Backtesting data never assures that the same results would occur in future and also above settings use very less of total portfolio for trades, which in a way results less maximum drawdown along with less total profit on initial capital too. For example, increasing default quantity value will definity increase maximum drawdown value. The other way is also to use fix contracts in backtesting but it all depends on users general practice. Best option is to explore backtesting results with manually modified settings on different charts, before trusting them for other uses in future.
Usage and In-Detail Backtesting
This strategy has built-in option to enable trade confirmations with Chikou filter which will reduce the total number of trades increasing profit factor.
Symmetrically Weighted Moving Average (SWMA) on input source, may risk repainting in real-time data. Better option is to run a trade on bar close or simply left this optin unchecked.
I've set Chikou filter unchecked to increase number of trades (greater than 100) on higher timeframe (12H) and this can be changed according to your precision requirement and timeframe.
Timeframes lower than 4H usually have more noise. So its better to use higher EDMA and EMA length on lower timeframes which will decrease total number of offsetting trades increasing average total number of bars within a single trade.
Original "Exponentially Deviating Moving Average (MZ EDMA )" Indicator can be found here.

Trend Follower Strategy v2 [divonn1994]The Trend Follower Strategy that I made classifies red and green candles into tiny, small, and big sizes and will send buy or sell signals depending on if the candle is classified as "big" so you get into and out of a position when there is a big candle. Out during a big green candle to take profit. Out during a big red candle in case the market is turning down. It also won't enter a position unless there is positive EMA momentum.
For the chart there is a Buy and a Sell signal. Buy = 1, Sell = 0, and when the value crosses above or below 0.5 it will trigger a long position or close the long position. The graph isn't necessary to the strategy, but can help with visualizing the trade patterns in the past if you like.
This strategy works best so far with these coins at time of posting (March 4th, 2022):
KCSUSDT (621x profit), HTUSDT (45x profit), LUNAUSDT (45x profit), BNBBTC (1553x profit), ETHBTC (219x profit), KCSBTC (1222x profit), LUNABTC (83x profit), FTMBTC (52x profit).
It can work with other pairings, but I personally like these pairings best. I didn't test it with coins outside of the top 100 coins by market cap. Use it however you want.
Works best on 1 Day charts.
The strategy would rather be in the market than out. It gets out when it see's a red flag, but can immediately go back in in the next bar if the red flags are all gone. So it makes a lot of trades.
------------------------------------------------------------------------------------------------------------------------------------------------------------------------------------------------------------------------
Update: This is the same strategy I uploaded before but I made the code Open for anyone to check it out and so it has a similar description as the previous version. Let me know what you think. I'd remove the old version if I could, but I guess it's site policy to not be able to remove scripts that have been uploaded.

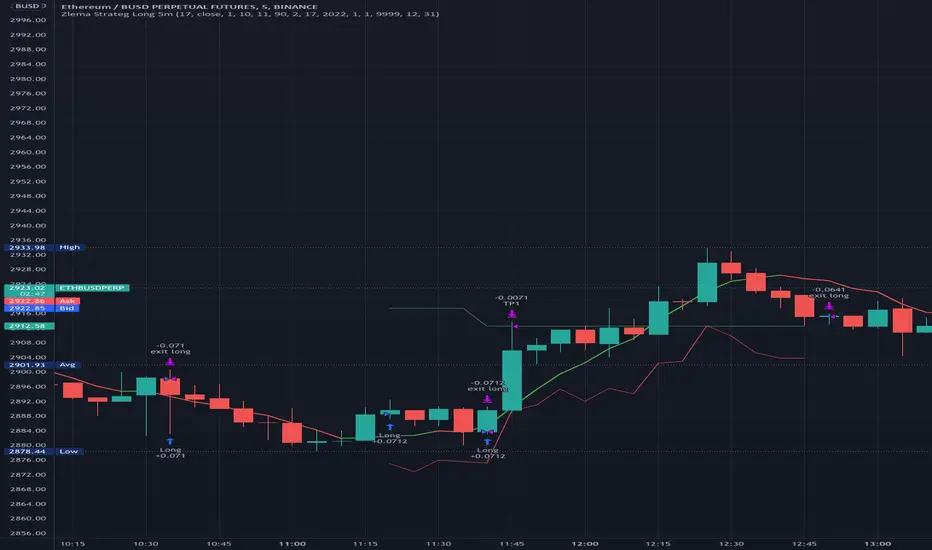
Zlema Strateg Long 5mJust putting this out there.
I created this Strategy based on Everget Zlema.
Opens long trade when Zlema changes color.
It is profitable as it is, but just putting it out to the community to see if someone else has ideas to make it better.
How to make this strategy better?
1. FInd a way to filter ranging bad trades.
2. Trades would be more profitable if entry point had an entry on the candle the zlema changes color.
3. I had to put TP 5 limit, but the optimal would be when the zlema changes color back to red (if ranging trades can we filtered that is).
In any case, just putting it out there, hope it is useful for someone, and I am open to suggestions.
Co-relation and St-deviation Strategy - BNB/USDT 15minThis indicator based on statistical analysis. it uses standard deviation and its co-relation to price action to generate signals. and following indicators has been used to calculate standard deviation and its co-relation values. finally it is capable to identify market changes in bottoms to pic most suitable points.
1. Parabolic SAR (parabolic stop and reverse)
2. Supertrend
3. Relative strength index (RSI)
4. Money flow index (MFI)
5. Balance of Power
6. Chande Momentum Oscillator
7. Center of Gravity (COG)
8. Directional Movement Index (DMI)
9. Stochastic
10. Symmetrically weighted moving average with fixed length
11. True strength index (TSI)
12. Williams %R
13. Accumulation/distribution index
14. Intraday Intensity Index
15. Negative Volume Index
16. Positive Volume Index
17. On Balance Volume
18. Price-Volume Trend
19. True range
20. Volume-weighted average price
21. Williams Accumulation/Distribution
22. Williams Variable Accumulation/Distribution
23. Simple Moving Average
24. Exponential Moving Average
25. CCI (commodity channel index)
26. Chop Zone
27. Ease of Movement
28. Detrended Price Oscillator
29. Advance Decline Line
30. Bull Bear Power

Trend Follower Strategy [divonn1994]The Trend Follower Strategy that I made classifies red and green candles into tiny, small, and big sizes and will send buy or sell signals depending on if the candle is classified as "big" so you get into and out of a position when there is a big candle. Out during a big green candle to take profit. Out during a big red candle in case the market is turning down. It also won't enter a position unless there is positive EMA momentum.
For the chart there is a Buy and a Sell signal. Buy = 1, Sell = 0, and when the value crosses above or below 0.5 it will trigger a long position or close the long postion. The graph isn't necessary to the strategy, but can help with visualizing the trade patterns in the past if you like.
This strategy works best so far with BNBUSDT, ETHUSDT, KCSUSDT, HTUSDT, BNBUSDT, BNBBTC, ETHBTC, KCSBTC, LUNABTC, SOLBTC, ADABTC, SANDBTC, HNTBTC, KDABTC.
It can work with other pairings, but these have the healthiest charts in my opinion, as in, the profit factor is high and is greater than a simple buy and hold strategy, and the largest drawdown isn't very high.
Works best on 1 Day charts.

Inside Breakout PerQuantumCoin Premium Indicator (strategy)HOW IT WORKS:
- The Inside Breakout gives signals on the chart on the breakout of inside bar chart pattern;
- It allows to trade trend or counter-trend signals;
- Computes intrinsic values to access the strength of the Buy/Sell signal;
- Allows users to adjust their own settings, adapting the signals produced;
- These signals can be also set up as Alerts;
- The indicator has a few custom features that allows users to filter out signals using multi-timeframe trend indicator and to keep tracking positions so that one can only get new signals when they reserve position;
This Strategy version is meant to be a companion to the main indicator in order to backtest your SLT/TP settings with different instruments and adapt results.
Please NOTE:
Results may vary depending on TP/SL settings. Also, previous performance is not a indicator for future results.

Bias Master SystemName: Bias Master System
Category: Bias (Template/Master).
Operating mode: enters and exits at specific times of the day
Trades duration: a few hours, usually intra-day.
Timeframe: 1H.
Suggested usage: in markets where hourly biases are present.
Entry: enters long and short in predefined times, with possibility to manage trend or volatility filters.
Exit: exits in predefined times.
Usage: It can be used in a variety of ways:
- Together with the Bias Analyzer to quickly check the Bias found by the tool. This allows you to create profitable strategies in less than an hour, as an example the starting point with the Analyzer
- The strategy itself can be used to study the market for interesting biases.
- The strategy can be used as a starting code for the development of one's own strategies.
A tutorial with working examples on BTC and ETH is also available and will be provided with the access.
Configuration:
- Long Trades: possibility to specify two long trades configuration and filter them by day of the week, trend or volatility.
- Short Trades: possibility to specify two short trades configuration and filter then by day of the week, trend or volatility.
- Backtest dates: for splitting the available data in develop, test and validation.
- Results table: possibility to specify decimal precision and Dark Mode
Credits:
- QuantNomad for Results Table
Backtesting:
⁃ Exchange: BINANCE
⁃ Pair: ETHUSDTPERP
⁃ Timeframe: 1H
⁃ Fee 0.025%

STR:EMA Oscilator [Azzrael]Strategy based on EMA and EMA Oscilator
(EMA - close) + Std Dev + Factor = detecting oversell/overbuy
Long only!
Pyramiding - sometimes, depends on ...
There're 2 enter strategies in one script:
1 - Classic, buy on entering to OverSell zone (more profitable ~> 70%)
2 - Crazy, buy on entering to OverBuy zone (catching trend and pyramiding, more net profit)
Exit - crossing zero of (EMA - close)

Volatility Breakout StrategyThis is a strategy used by Larry R. Williams called Volatility Breakout.
By identifying a strong uptrend that exceeds 'a certain level' on a daily basis as a breakout signal, enter long position, take advantage of long at the the next day's open.
'a certain level (Entry Price)' is calculated by { close + 'k' * high -low }, and applied logarithmic calculation.
Stop loss level is calculated by half of the previous day's Low and Entry Price.
Strategy exit always at UTC+0.
And expressed day session with the background color.
Thanks and hope this helps you.
(kor)
이건 Larry R. Williams가 사용하는 변동성 돌파 전략입니다.
특정 수준을 넘는 강한 상승세를 돌파 신호로 파악하여 매수하고, 장시간이 종료될때에 빠르게 수익을 실현하는 전략입니다.
"특정 레벨(진입가)"은 close + 'k' * high -low 로 계산되며 로그 계산을 적용했습니다.
손절 레벨은 전일 저가 및 진입 가격의 절반으로 계산됩니다.
전략은 항상 UTC+0에서 종료합니다. ( 한국 기준 오전 9시 )
그리고 배경색으로 일일세션을 표현했습니다.
트뷰에 오픈소스의 래리윌리엄스 변동성전략이 없는것 같아 간단하게나마 만들어 보았습니다. 도움이 되었으면 좋겟워요..

Buy Monday, Exit Tuesday with Stop Loss and Take ProfitStrategy to go long at end of Monday before market closes and exit before Tuesday close, or at stop loss or take profit percentages
This runs strategy on entering by weekday name and also by session time.
Implemented are also Take Profit and Stop Loss to exit position using custom inputs.
Added stoploss and take profit plot lines

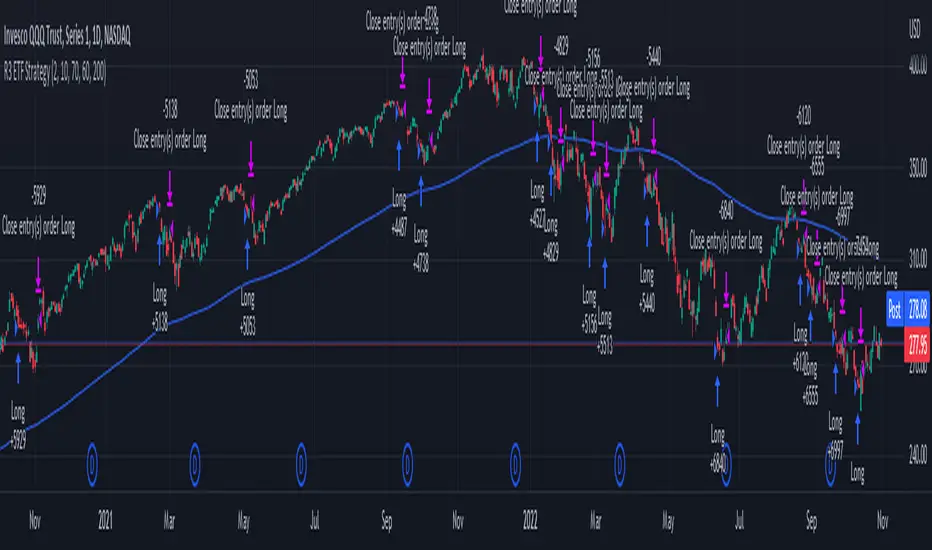
R3 ETF StrategyThis strategy is a modification of the “R3 Strategy” from the book "High Probability ETF Trading" by Larry Connors and Cesar Alvarez. This RSI strategy is for a 1-day time-frame and has these 3 simple rules:
Criteria:
The price must be above the 200 day moving average.
The 2-period (day) RSI drops 3 days in a row.
The 2-period RSI must have been below 60 3 days ago and below 10 today.
Entry and Exit:
If the 3 rules above are true, then buy on the close of the current day.
Exit on the day's close when the RSI crosses above 70.
How it works :
The Strategy will buy when the buy conditions above are true. The strategy will sell when the RSI crosses above 70. The RSI period/length, and RSI entry/exit criteria thresholds have all been coded to be adjustable with inputs.
Plots :
Blue line = 200 Day EMA (Used as Entry Criteria)
Disclaimer: Open-source scripts I publish in the community are largely meant to spark ideas that can be used as building blocks for part of a more robust trade management strategy. If you would like to implement a version of any script, I would recommend making significant additions/modifications to the strategy & risk management functions. If you don’t know how to program in Pine, then hire a Pine-coder. We can help!
Titan EMA Averaging Strategy - (DYOR) By MrCryptoTitan EMA Averaging Strategy (VIP Only) Enable Longs or Shorts only Works With Crypto + Forex with correct back tested settings This is not set and forget. This requires you to back test and have relevant Risk Management in place.
The Strategy: The script uses 3EMA with engulfing candle to enter a trade in either short or long direction.
You will need to test the settings and adjust them so there isn't too many - re-entries and make sure you take profit big enough to not trigger on same candle.
When setting alerts you can use once per bar however this may trigger multiple alerts if the candle is moving very fast so this is not recommended. So doing once per bar close will mean entry is confirmed as bar is closed. You will need to select this in drop down menu.
- Max Trade Limit.
- All in one Alert. - Basically add syntax for example- Long/Take Profit/Re-entry/Emergency Stop. Then add one alert and select "Alert() function calls Only" Change Alert name to custom. That's it.
-Built-in Strategy tester.
- Trade Filter - Multi-MA Filters. - MA", "EMA", "WMA", "HullMA", "VWMA", "RMA", "DEMA", "TEMA", VWAP
- ADX Filter based on Level.
Please note when running this strategy you can only trade longs only or shorts only for this setup to be potentially profitable. Also note that setting unrealistic profit targets will make a loss. So it is very important to back test everything.
This Script does not use any Security functions. All indicators which are used part of the strategy are obtained from Trading View indicator Library and have source code has been changed to make this into Strategy.
Please Do Your Own Research before using this.
Anymore information please DM me directly

SHAD helperDisplays lines and labels for prices following the SHAD strategy.
SHAD strategy consists in selling half the position every time price doubles, thus this indicator displays values for x2, x4, x8 and x16 of current closing price.
You can also see "/2" (-50%) and "/4 " (-75%) values.
You can edit display colors and labels text size in the indicator's settings

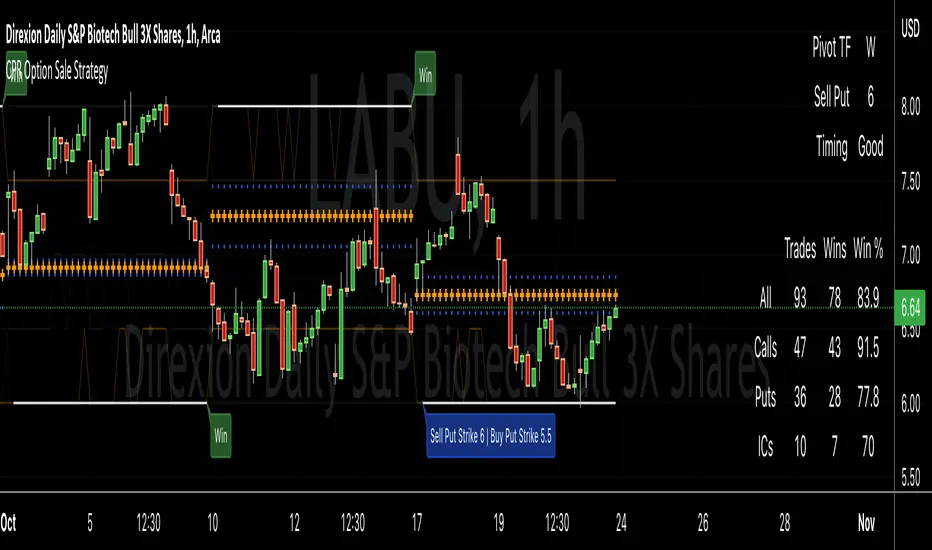
CPR Option Selling StrategyGood afternoon traders,
This is a script I built for option selling, in attempt to have a high success rate.
The gist of how it works:
It uses the opening or close of the current chart's timeframe opening bar when referenced against a designated (higher) timeframe's central pivot range (CPR).
Using that comparison, this script calculates an option to sell: put, call, or iron condor. It will calculate a call value using an average of the CPR central pivot and the max value of the prior higher timeframe's high or R1 (whichever is higher.)
It does the same for the put side, but uses the higher timeframe's low or S1 (whichever is lower.)
It will use the option on the other side of the source (open or close) of the CPR as the "option in play."
Settings:
There are many settings, most are simply "viewable" settings, and probably self explanatory, others, not so much:
"Source for Trigger" - this is the value used on the "opening bar," such as the close. This value is the one compared to the Central Pivot Range in determining whether to sell a call (if the source is lower,) sell a put (if the source is higher,) or an iron condor if it's in the CPR.
"Show Historical Win/Loss Percentages" - this shows a table in the bottom right of the W/L percentages for the current ticker and settings. Used for a quick glance at historical success rates.
"Extend Developing Levels Into the Future" - This will extend the developing values for CPR values, call and put values into the future (good for trying to trade early or setting up pre-market trades, assuming there will not be huge gap in one direction or another.)
"Select Higher Timeframe" - "Auto" will choose the higher timeframe for you. "Manual" will use the next field...
"If Manual, Timeframe for Pivots" - allows you to choose a different higher timeframe.
The next two sections are simply whether to show the plots for different levels of traditional and/or camarilla pivot points.
The last section will allow you to just filter on certain days. Really only useful for "backtesting" certain 0DTE trades on some daily options during the hourly chart.
Example use:
An example use (which I completed last week) on the chart referenced in this share: I sold a put-spread for $0.90, selling a 590 and buying a 570 strike in the middle of the week. I was looking at an hourly timeframe chart with a weekly pivot timeframe for the strategy.
Obviously, making only $0.90 on a $20 spread, there is a lot more to lose than to make, but I did some other analysis to go with it, so I felt safe, and I had a stop set for $1.50. So it worked, along with 3 other plays I did, very similar, and if that "Historical Win/Loss Percentage" is accurate, which I am fairly certain it is, I felt good about it.
The key all comes down to what you sell it for, right? That piece only you can determine. :)
Happy trading and enjoy,
Deuce
Renko Candles OverlayHello All,
For long time I got many request for Renko Candles and now here it's, Renko Candles Overlay . I tried to make almost everything optional, so you can play with the options as you want.
Let see the options:
Method: the option for brick scaling method: ATR, ATR/2, ATR/4, Percent, Traditional
- ATR Period: period for Average True Range and it's valid if the method is ATR
- ATR/2 Period: period for Average True Range and it's valid if the method is ATR/2
- ATR/4 Period: period for Average True Range and it's valid if the method is ATR/4
- Traditional: User-defined brick size, it's valid if the method is Traditional
- Percent: Percent of Close price, it's valid if the method is Percent
if the method is not Traditional (fixed brick size) then Brick size is calculated/updated when new bricks added. so The box sizes may be different because of the calculation is dynamic.
Levels & Lines for new Bricks: if you enable this option then the script shows the levels for new brick
Change Bar Color: optionally the script changes the bar color by using direction of the bricks
and some other options for coloring.
The script shows the bricks for visible area, which is approximately 280 candles. so if you change the width and number of the bricks then number of bricks that is shown is adjusted automatically to fit the screen. you can see the examples below:
The script shows the levels to new brick as a line and label:
Because of real-time bar is not confirmed until the candle close, the script shows the bricks as Unconfirmed , and unconfirmed bricks shown in different color:
You can change the width of the bricks (width is 10 in following example):
Optionally candle colors are changde by the direction of the bricks:
If you have any recommendation then please drop a comment under the script ;)
Enjoy!
