Super Breakout day trading This is an intraday indicator which uses Bollinger band and volume flow and MA to alert buy and sell signal.
A user can use this indicator to help make entry and exits. This indicator wont show entry and exist of larger time frames like Day week month.
This indicator uses Bollinger bands but try to minimize it shortcoming where it will buy and keep holding and eventually sell at a loss.
By adding addition parameters around volume it check if the price has reached its peak
Strategy

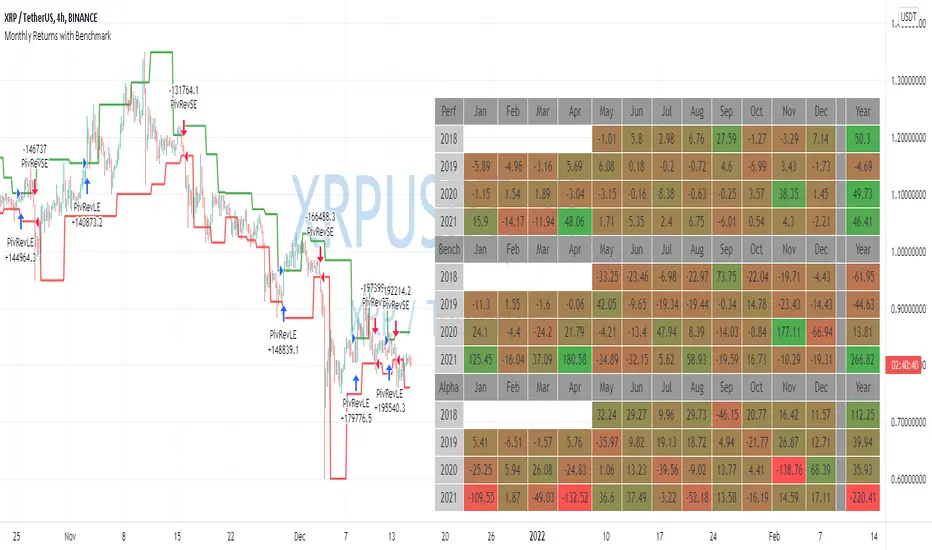
Monthly Returns with BenchmarkI keep working on trying to make TradingView strategies look fancier.
A few months ago I published the first version of the Monthly Returns for Strategies in Pine Script. I received quite a lot of good feedback and quite a lot of requests to update it.
This is a more advanced version of the Monthly Returns, in it, you can:
Display monthly returns of your strategy, benchmark, and alpha over this benchmark.
Select benchmark to be another instrument
Select the date from which you want to compute monthly returns
Show/hide benchmark and alpha
Choose colors for gradient for gain/loss values
Use it with any type of strategy
Use it with replay
I hope it will be useful for you.
It's not about the strategy itself but the way you display returns on your chart. So pls don't critique my choice of the strategy and its performance 🙂
Disclaimer
Please remember that past performance may not be indicative of future results.
Due to various factors, including changing market conditions, the strategy may no longer perform as well as in historical backtesting.
This post and the script don’t provide any financial advice.
Contrarian Scalping Counter Trend Bb Envelope Adx and StochasticContrarian Scalping is an trading strategy designed to take advanted of a counter-trend.
The advantage of these strrategies types is that they have a good profitability but with do not great gain (in relation at the time frame).
Indicators used:
Bollinger
Envelope
ADX
Stochastic
Rules for entry
For short: close of the price is above upper band from bb and envelope, adx is below 30 and stochastic is above 50
For long: close of the price is below lower band from bb and envelope, adx is below 30 and stochastic is below 50
Rules for exit
For short: either close of the candle is below lower band of bb or enveloper or stochastic is below 50
For long: either close o the candle is above upper band of bb or envelope or stochastic is above 50
If there are any questions let me know !

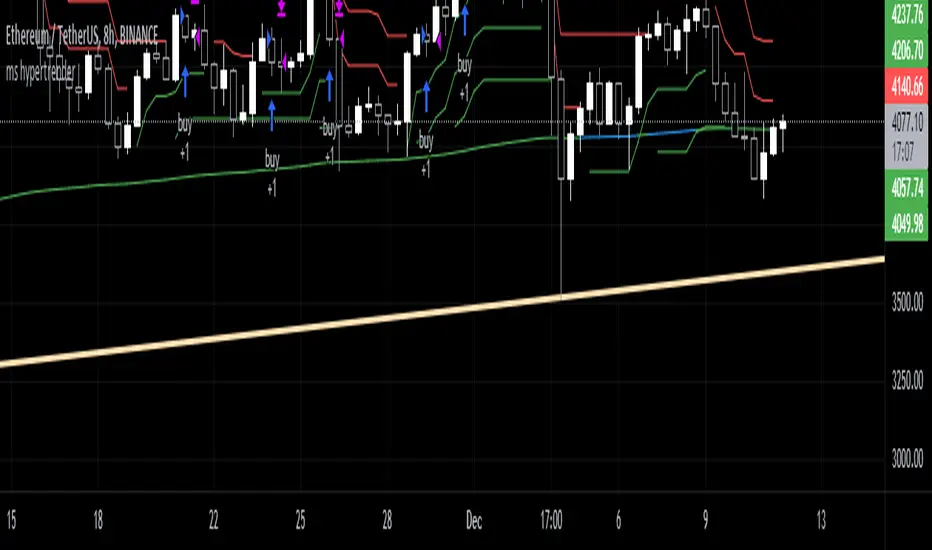
moonshot hypertrender (supertrend strategy)
This is a well-known strategy by using 3 different Supertrends and a trend-defining EMA,
feel free to play around with the settings, a backtest on 8h ETHUSDT pair brought some good results using
the 233EMA and investing 75% of a 10k start capital.
The idea is to have at least 2 Supertrends going green above the trend-EMA to go into a long position. The exit
will be triggered if 2 Supertrends change to red (idea: 1 super trend in red could initialize a take profit).
Taking shorts works vice versa.
The EMA shows in green for uptrends and in red for downtrends, if it is blue (ranging market) no Signal will be taken because
the 3 Supertrends are not all above or below the trendline(EMA).
I heard about this strategy on youtube but I can't get the promised 60% win-rate ;)
any suggestions to improve it are welcome
Hope you find it useful and it would be nice to get your feedback
-theasgard-
A simple trading strategy for XTZ/EUR (December 2021)This is my current trading strategy for XTZ/EUR for this month of December.
It tries to avoid pumps/dumps (i.e. does not trade on big candles).
It always performs one order in each candle for the trading window of the rebalance bear/bull market indicator (check my profile for it).
It has alerts configured so that you can use it in your server/broker (just pass along the `{{strategy.order.alert_message}}` in the alert message, it will include a positive number of XTZ when to buy, or a negative number when to sell).
It does not repaint.
The amount of crypto and fiat in the portfolio can be configured in the cog.
It does not outperform buy/hold for the bull months.
Check the results in the Data Window of Trading View (please avoid the Strategy Tester, it has too many bugs and is not intended for out of the box strategies such a this one).
All code is open source.

Joint Conditions Strategy Suite + TradingConnector alerts bot"Please give us combined alerts with the possibility of having several conditions in place to trigger the alert." - was the top voted request from users under one of the recent blogposts by TradingView.
Ask and you shall receive ;)
TradingView is a great platform, with unmatched set of functionalities, yet this particular combo of features indeed seems not to be in place. Fortunately, TradingView is also very open platform, thanks to PineScript coding language, which enables developing combos like the requried one and plenty of other magic.
I have already published numerous "educational" scripts, showing how to code indicators and alerts with PineScript, but... this is not one of them. This one is for real. READY FOR USE on real markets, also by the non-coding traders. Just take my script, set parameters with dropdowns, backtest the strategy, fire the alerts and execute them.
HOW TO USE IT
In "Settings" popup I tried to mimic the CreateAlert popup dropdowns for selecting logic. Let's say you want to enter Long position at Stochastic KxD crossover. In first line of Long Entry conditions set "StochK" + "Crossing Up" + "StochD". Last field doesn't matter because in 3rd dropdown something else than "value" was selected. In second line you could set "maB" + "Greater Than" + "maC" to filter out those entries which are in direction of the uptrend. And yeah, add ADX>25 to make sure the market is actually moving: "ADX" + "Greater Than" + "value" + "25". All condition lines must be TRUE (or skipped) for the entry to be triggered. Toghether with an alert.
The same for Short entries. Combinations are limitless.
INDICATORS AND MTF (MULTI-TIMEFRAME)
In those dropdowns you can select candle values like open/close/high/low/ohlc4, but also some most popular indicators, which I have pre-built into this script: RSI, various Moving Averages, ADX-DMI, Stochastic and Bollinger Bands for start. You can configure parameters of those indicators also in "Settings" popup, in "Indicator Definitions" section. What's important, you can use any of these indicators from higher timeframe, setting MTF multiplier. So if you applied this indicator to 1h chart, but want to use rsi(close,14) from 4h chart, set MTF to 4. If you want to use current timeframe indicators, keep MTF at 1, which is a default setting here.
Note for coders: to keep focus of this script on joining conditions, entire logic for those indicators has been moved to external library, also open source. I encourage you to dig into the code and see how it's done. I love the addition of libraries concept in PineScript.
CUSTOM INDICATOR
Following the "openness" spirit of my master - which is TradingView itself - my work is also open, in 2 ways:
1. This script is open source. So you can grab it, modify or add any functionalities you want. I cannot and don't want to stop you from doing that. I'm asking for only one favor - please mention this source script in your credits.
2. You can import the plot (series) from any other indicator on TradingView. In Settings popup of my script, scroll down to "Indicator Definitions" section, and select the series of your choice in the first dropdown. Now it is ready to use in conditions dropdowns on top of the Settings popup.
Let me give you an example of that last scenario. Take another script of mine, "Pivot Points on SR lines DEMO". You can find it in "Indicators & Strategies" library or here: (). Attach it to your chart. Now come back to THIS script, open Settings popup and in "Custom Indicator aka Imported Source" select "Pivot Points on SR lines: ...". The way it works - it detects if a pivot point happened on Support/Resistance line from the past and returns 1 for PivotLow and -1 for Pivot High. Now in first Long Entry condition set: "custom indicator" + "Greater Than" + "value" + "0" and long entries will be marked on every pivot low noticed on Support/Resistance line.
ALERTS
Last but not least - the alerts. This script produces alerts on the entries calculated by strategy logic, as marked on the chart by the backtester. Moreover, syntax of those alerts is already prepared and fully compatible with TradingConnector - alerts executing tool (bot), if you want to auto-execute those trades. Apart from installing the tool, you need to set
up the alerts in TradingView, here is how:
open CreateAlert popup
in first dropdown select "Joint Conditions Strategy Template"
in second dropdown select "alert() function calls only"
And that's all. You only need to set one alert for the whole script, not one for Longs and one for Shorts as it was in the past. Also, you don't need to setup closing alerts, because stop-loss/take-profit/trailing-stop information is embedded in the entry alert so your broker receives it as early as possible. Alerts sent will look like this: "long sl=40 tp=80", which is exactly what TradingConnector expects.
Phew, that's all folks. If you think I should add something to this template (maybe other indicators?) please let me know in comments or via DM. Happy trading!
P.S. Pyramiding is not supported in this script.
Disclaimer : I'm not saying above combination of conditions will make you money. Actually none of this can be considered financial advice. It is only a software tool. Use it wisely, be aware of the risk and do your own research!

Multi MA Trend Following Strategy TemplateTrend following is one of the better known technical trading strategies. But, which trend should you follow? Today I am sharing with the community a trend following template script that includes a selection of over 20 different trends / regressions. Some of these are in the Pine library, and some have been custom coded and contributed over time by the beloved Pine Coder community.
How it works:
This template will plot any of the 20+ trends that you can select in the settings. The strategy component will buy if the trend line is moving up, and will sell if it moves down. If the line is green that indicates that the trend is higher than the prior bar. If the line is red that indicates that the trend is lower than the prior bar. This script is different from many moving average scripts in that it follows the trend itself and doesn't look for a cross of multiple trends.
How to use it:
When wanting to trend follow an instrument, you can use this template to help identify what approach you might want to take and/or which indicator you might want to use. You can also modify the strategy as you see fit and make use of the 20+ incorporated indicators. Incorporate your trade and risk management strategy, or use it as an indicator.
Disclaimer: Open source scripts I publish in the community are largely meant to spark ideas that can be used as building blocks for part of a more robust trade management strategy. Even though this example script might beat buy and hold over the back-test time-frame, I wouldn't advise using it as a stand-alone strategy without significant additions/modifications to the strategy and risk management functions.

Premium ScalperThe strategy works with a combination of a number of different factors, including:
- Volume
- Moving averages
- Volatility
- RSI
This strategy generates long and short signals based on volume movements, moving averages and RSI. By combining other algorithms, low volatility periods can be filtered out.
The best results can be achieved by pairing the indicator with a bot through 3Commas and using a diversification strategy. This way you spread your risk over different pairs and you therefore also have a great chance of taking big moves.
The strategy results we display are results WITHOUT leverage. It is therefore also possible to only long on spot with this strategy, but for optimal results a trading bot link is required.
The settings we have used for these results are an order size of 100% with a 0.08% commission size.
Side note: This indicator does NOT use repainting!
We offer the possibility to try the indicator for free for 7 days.

Simple scalping strategy for SOLThis is a simple scalping strategy for trading SOL made on top of the Rebalance Oscillator and the Rebalance Bear/Bull market indicators.
It is intended mostly as proof that these two indicators have their benefits even in simpler strategies.
This strategy in particular works well for the Bear months (check Nov. in the data window) but considerably underperforms Buy&Hold for the Bull months.
It tries to do a market operation per candle whenever the candle happens in a buy/sell trading window of the
Rebalance Bear/Bull indicator ().
It always buys/sells the same amount by default (you can set it in the cog menu in the option "Base Crypto Amount To Trade"),
for SOL this is set to 1.0SOL.
This is my first attempt at scalping, it differs slightly from the standards because it does not require fast
response candles or immediate market operations (it can work well with limit trading) and on top of this it also
does not require a stop loss since it uses an indicator that provides the trading windows (surprises can still happen though).
The profit that this strategy tries to take for each buy/sell pair is not configurable and is set at 12% each way when it happens.

XTZ trading strategy for Bear monthsThis is my 3rd approach into trading XTZ. It is tuned into bear months and needs to work for at least 30 days.
It looks at the rebalance oscillator and bear market indicator and tries to find a position in the market that does not lose money within the month.
Use the cog icon to update the trading window to fit previous months, and check out the data window for its real performance. Do not rely on the Strategy Tester since this strategy is performing only with `strategy.order` making the values of the Strategy Tester irrelevant and inconsistent with its performance.

Linear trendSimple way how to use Linear Regression for trading.
What we use:
• Linear Regression
• EMA 200 as a trend filter
Logic:
Firstly we make two different linear regression movings as oscillator. For this we need to subtract slow moving from fast moving, so we get the single moving around zero. This is the green/red line which appears on the chart.
The trade open when LR cross over the threshold. The trade close when LR cross under the threshold below. Crossing over the threshold is the same as faster moving cross over slower moving.
Also we use EMA as a filter. The trades would be only when the price is over than EMA 200.

Double SupertrendThis strategy is based on a custom indicator that was created based on the Supertrend indicator. At its core, there are always 2 super trend indicators with different factors to reduce market noise (false signals).
The strategy/indicator has some parameters to improve the signals and filters.
TECHNICAL ANALYSIS
☑ Show Indicators
This option will enable/disable the Supertrend indicators on the chart.
☑ Length
The length will be used on the Supertrend Indicator to calculate its values.
☑ Dev Fast
The fast deviation or factor from one of the super trend indicators. This will be the leading indicator for entry signals, as well as for the exit signals.
☑ Dev Slow
The slow deviation or factor from one of the super trend indicators. This will be the confirmation indicator for entry and exit signals.
☑ Exit Type
It's possible to select from 4 options for the exit signals. Exit signals always take profit target.
☑ ⥹ Reversals
This option will make the strategy/indicator calculate the exit signals based on the difference between the given period's highest and lowest candle value (see Period on this list). It's displayed on the chart with the cross. As it's possible to verify in the image below, there are multiple exit spots for every entry.
☑ ⥹ ATR
Using ATR as a base indicator for exit signals will make the strategy/indicator place limit/stop orders. Candle High + ATR for longs, Candle Low - ATR for shorts. The strategy will show the ATR level for take profit and stick with it until the next signal. This way, the take profit value remains based on the candle of the entry signal.
☑ ⥹ Fast Supertrend
With this option selected, the exit signals will be based on the Fast Supertsignal value, mirrored to make a profit.
☑ ⥹ Slow Supertrend
With this option selected, the exit signals will be based on the Slow Supertsignal value, which is mirrored to take profit.
☑ Period
This will represent the number of candles used on the exit signals when Reversals is selected as Exit Type. It's also used to calculate the gradient used on the Fills and Supertrend signals.
☑ Multiplier
It's used on the take profit when the ATR option is selected on the Exit Type.
STRATEGY
☑ Use The Strategy
This will enable/disable the strategy to show the trades calculations.
☑ Show Use Long/Short Entries
Option to make the strategy show/use Long or Short signals. Available only if Use The Strategy is enabled
☑ Show Use Exit Long/Short
Option to make the strategy show/use Exit Long or Short signals (valid when Reversals option is selected on the Exit Type). Available only if Use The Strategy is enabled
☑ Show Use Add Long/Short
Option to make the strategy show/use Add Long or Short signals. With this option enabled, the strategy will place multiple trades in the same direction, almost the same concept as a pyramiding parameter. It's based on the Fast Supersignal when the candle fails to cross and reverses. Available only if Use The Strategy is enabled
☑ Trades Date Start/End
The date range that the strategy will check the market data and make the trades
HOW TO USE
It's very straightforward. A long signal will appear as a green arrow with a text Long below it. A short signal will appear as a red arrow with a text Short above it. It's ideal to wait for the candle to finish to validate the signal.
The exit signals are optional but give a good idea of the configuration used when backtesting. Each market and timeframe will have its own configuration for the best results. On average, sticking to ATR as an exit signal will have less risk than the other options.
☑ Entry Signals
Follow the arrows with Long/Short texts on them. Wait for the signal candle to close to validate the entry.
☑ Exit Signals
Use them to close your position or to trail stop your orders and maximize profits. Select the exit type suitable for each timeframe and market
☑ Add Entries
It's possible to increase the position following the add margin/contracts based on the Add signals. Not mandatory, but may work as reentries or late entries using the same signal.
☑ What about Stop Loss?
The stop-loss levels were not included as a separated signal because it's already in the chart. There are some possible ideas for the stop loss:
☑⥹ Candle High/Low (2nd recommend option)
When it's a Long signal from the entry signal candle, the stop loss can be the Low value of the same candle. Very tight stop loss in some cases, depending on the candle range
☑⥹ Local Top/Bottom
Selecting the local top/bottom as stop loss will give the strategy more room for false breakouts or reversals, keeping the trade open and minimizing noises. Increases the risk
☑⥹ Fast Supertrend (1st recommend option)
The fast supertrend can be used as stop-loss as well. making it a moving level and working close to trail stop management
☑⥹ Fixed Percentage
It's possible to use a fixed risk percentage for the trades, making the risk easier to control and project. Since the market volatility is not fixed, this may affect the accuracy of the trades
☑⥹ Based on the ATR (3rd recommend option)
When the exit type option ATR is selected, it will display the take profit level for that entry. Just mirror that value and put it as stop-loss, or multiply that amount by 1.5 to have more room for market noise.
EXAMPLE CONFIGURATIONS
Here are some configuration ideas for some markets (all of them are from crypto, especially futures markets)
BTCUSDT 15min - Default configuration
BTCUSDT 1h - Length 10 | Dev Fast 3 | Dev Slow 4 | Exit Type ATR | Period 50 | Multiplier 1
BTCUSDT 4h - Length 10 | Dev Fast 2 | Dev Slow 4 | Exit Type ATR | Period 50 | Multiplier 1
ETHUSDT 15min - Length 20 | Dev Fast 1 | Dev Slow 3 | Exit Type Fast Supertrend | Period 50 | Multiplier 1
IOTAUSDT 15min - Length 10 | Dev Fast 1 | Dev Slow 2 | Exit Type Slow Supertrend | Period 50 | Multiplier 1
OMGUSDT 15min - Length 10 | Dev Fast 1 | Dev Slow 4 | Exit Type Slow Supertrend | Period 50 | Multiplier 1
VETUSDT 15min - Length 10 | Dev Fast 3 | Dev Slow 4 | Exit Type Slow Supertrend | Period 50 | Multiplier 1
HOW TO FIND OTHER CONFIGURATIONS
Here are some steps to find suitable configurations
select a market and time frame
enable the Use This Strategy option on the strategy
open the strategy tester panel and select the performance summary
open the strategy configuration and go to properties
change the balance to the same price of the symbol (example: BTCUSDT 60.000, use 60.000 as balance)
go back to the inputs tab and keep changing the parameters until you see the net profit be positive and bigger than the absolute value of the drawdown
in case you can't find a suitable configuration, try other timeframes
Since the tester reflects what happened in the past candles, it's not guaranteed to give the same results. However, this indicator/Strategy can be used with other indicators as a leading signal or confirmation signal.

RSI + MA StrategyHello, everyone!
We have just released an innovative strategy for TradingView. It allows you to facilitate the trading process when you have to use both indicators.
This strategy is:
User-friendly
Configurable
Equipped with the combination of Relative Strength Index (RSI) and Moving Average (MA) indicators
Designed with all required functions to manage positions
Features
The RSI+MA strategy can:
Identify entry points for Long and Short positions.
Depict RSI and MA values concerning each other.
Reduce visual congestion and import usability thanks to using a combo of 2 indicators.
Allow using pivot trading. The RSI+MA strategy will enter a Long position according to the Short position conditions. And vice versa.
Note! If you want to open a Long position, the RSI line should cross MA from top to bottom. If you want to open a Short position, RSI has to cross MA from bottom to top.
Parameters
We have equipped our strategy with more than 14 additional parameters. So, you can configure the EA according to your needs!
Inputs :
Use Reverse Trade — allows swapping Long and Short positions opening conditions.
Resolution — allows you to view an indicator with data on a higher or lower timeframe on the current chart.
RSI Length
RSI Source: Open, High, Low, Close, HL2, HLC3, OHLC4
Show MA — allows you to enable or disable MA displaying.
MA Length
MA Offset
Style:
RSI — RSI indicator line color and style settings.
MA — MA indicator line color and style configuration.
Upper Band — allows customizing line style, color, and RSI upper bound value.
Lower Band — allows you to customize line style, color, and RSI lower bound value.
Background — background color setting within the RSI upper and lower borders.
Precision — number of decimals for RSI values.
Note! Try RSI+MA on your demo account first before going live.

RSI StrategySimple way how to use RSI and MA indicators for trading.
What we use:
• RSI
• SMA calculated by RSI (title: SMA_RSI)
• Delta of RSI and SMA_RSI (title: delta)
• SMA calculated by delta of RSI and SMA & RSI (title: SMA_RSI2)
Logic:
Upon the fact that we use the difference between two indicators that have similar values ( RSI and SMA_RSI), we get number around zero. Next, result is smoothed by calculated the SMA . This is the blue/purple line that appears on the chart - SMA_RSI2.
The trade open when SMA_RSI2 cross over the threshold. The trade close when SMA_RSI2 cross under the threshold below.
Also, the usual EMA 200 is used as a filter, which you can switch on or switch off.

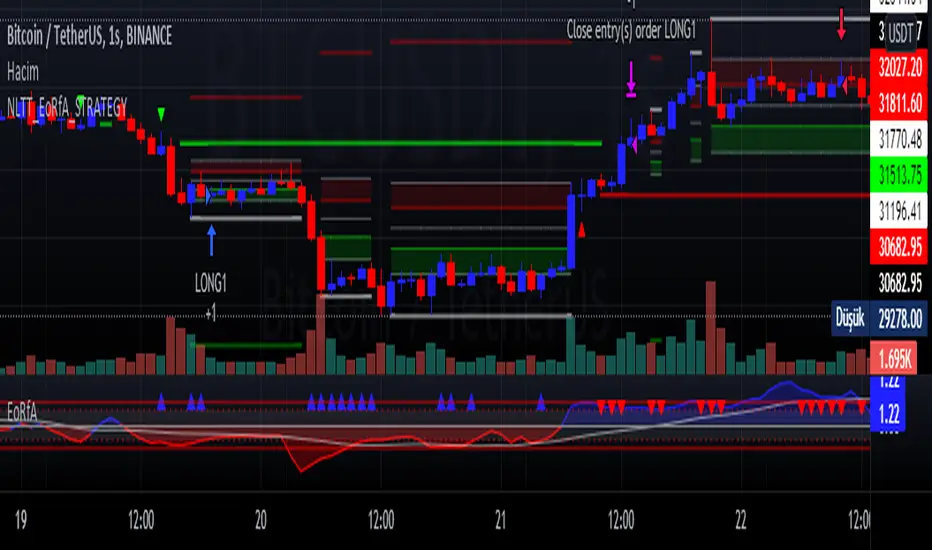
No-lose trading targets (Based on EoRfA) By Mustafa ÖZVERI simulated the NLTTa_EoRfA indicator with the Bitcoin-USD
For details about the indicator, visit my profile on tradingview
For Simulation, with default settings, we order
When on Long setup and price on green area
- open a long position that closes on red area
When on Short setup and price on red area
- open a short position that closes on green area
And we got
- about 15% profit
But only this value can not guarantee good results for trading. BE CAREFUL
Cyatophilum Smart rebalance strategyAn indicator to backtest and create automated Smart Rebalance strategies.
The strategy tries to beat holders while keeping your portfolio repartition stable.
Configure the indicator to receive alerts for several pairs at a choosen rebalance time frame.
═════════════════════════════════════════════════════════════════════════
█ HOW IT WORKS
Here is an example:
The user chooses a certain number of pairs, up to 4 pairs for now. An initial capital, a fees % and a rebalance time frame.
The capital is split equally between each pair. (ex. for 2 pairs: 50% on each).
On each rebalance time frame (on the bar it happens), pairs balance who grew bigger than 50% will be redistributed to other pairs, making sure that after the transaction, the total capital is once again split equally through all pairs. This means selling pairs whose price went higher than the others, and buying those who dropped. In other words, selling high and buying low.
On each interval, the strategy will send orders for each pair saying whether to buy or to sell, and the quantity.
█ HOW TO USE
Creating a strategy
When adding the indicator to the chart, you must confirm the pairs you want to use, the rebalance time frame, the initial capital and commission fees.
The inital capital corresponds to the quote currency of all pairs, so each pair must have the same quote currency. (ex: USDT or BTC markets)
It will also be asked to select a "Strategy Start Date", which is the starting point of your strategy. Select the current bar if you want to start a strategy and get accurate order quantities. Otherwise, select a bar in the past for backtesting.
When setting the "Strategy Start Date" to the current day, it will look like this:
The strategy equity is equal to the intial capital, and no order has happened yet, the backtest panel shows 0%.
The first rebalance will happen at the next interval: here the 15th november.
Since this is the first rebalance, the strategy buys each pair with the same quantity in quote currency value.
After 1 rebalance, the strategy equity drops a little, since we only bought and paid fees.
Backtesting
Since the strategy is trading several pairs, the Strategy Tester cannot really be used. This is why the indicator has a backtest panel and a equity line plot that shows the progress of the strategy.
This view can be replicated by disabling the labels in the style tab.
You can also use the Data Window to track the strategy pairs balances on each bar.
Creating Alerts
The indicator is using the alert() calls: it only uses 1 alert slot to send order messages for each pair.
To set your alert messages, open the indicator settings.
You can use the placeholders {pair}, {order_direction} and {quantity} to get their values replaced by respectively the pair ticker (symbol name without the exchange prefix), the order direction "BUY" or "SELL", and the quantity amount in quote currency.
Create your alert after you set the messages in the indicator settings, and make sure "Any alert() function call" is set in the alert option.
█ LIMITATIONS
• Small quantities
An order with a too small quantity might not get executed by the exchange. To increase the quantity of the strategy orders, either increase your strategy capital, increase the rebalance time frame, or reduce the number of pairs.
• Not enough data
The strategy will give an error if one of the pair data does not go back to the strategy start date. Typically if a crypto pair is new and was added to TradingView recently, you will not be able to backtest prior to that.
• Chart and rebalance Time Frame
The strategy will give an error if one of the two conditions are not met:
- The Rebalance time frame must be greater than current chart's time frame.
- The Rebalance time frame must be a multiple of current chart's time frame.
Please read the author instructions below for access and automation.

IDEAL BB with MA (With Alerts)It gives well combination of Moving average and Bollinger bands with signals

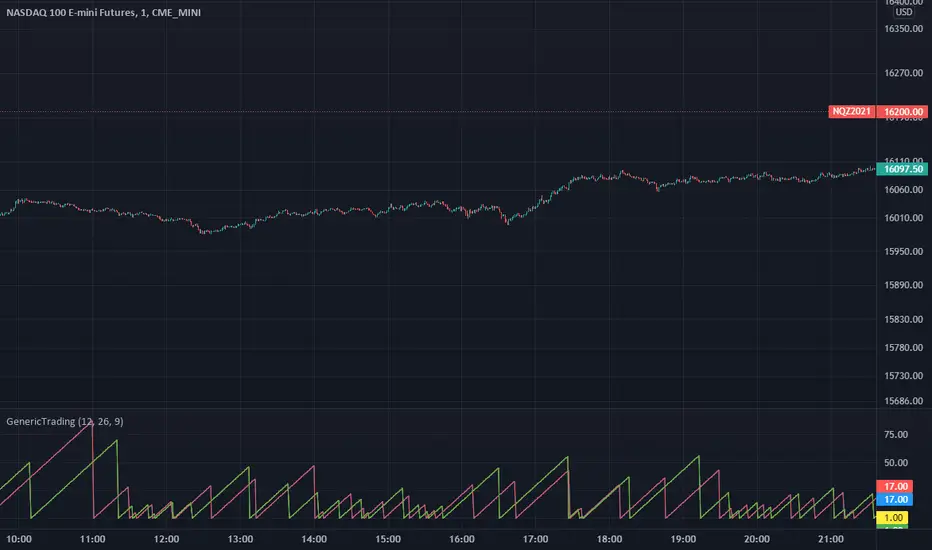
GenericTradingLibrary "GenericTrading"
This library aims to collect rare but useful operations for
get_most_recent_long_or_short_position_closed_index() : returns most recent long/short closed bar index.
get_most_recent_long_or_short_position_open_index() : returns most recent long/short closed bar index.
These two functions designed to help to speed up the coding for strategies that contains "re-enter" logic.
These two functions also could applies in the situations where time-count is needed in your condition.
EneX SignalEneX is signal that give recommendation signals for entry and exit on spot market. This indicators not suitable for leverage trading in futures market.
EneX signal consider several indicators and has entry and exit rules.
EneX signal is suitable for investors who believe in trend following strategy (disclaimer on).
This script composed by Yohan Naftali for educational purpose only. Reader who will use this signal must do own research.
Indicator and Plot Involved
1. Williams Fractals with default periods = 2
2. William Alligator Indicators with default simple moving average 8, 13, and 21
3. Exponential Moving Averages with default value EMA 50, 100, and 200
4. Relative Strength Index with default overbought level = 80 and oversold level = 20
5. Williams Fractals are joined to create support and resistance line and fill area between support and resistance lines.
Entry signal conditions
1. Entry on Weakness when bullish fractal appear on n/2 period
2. Entry when price break resistance line
All entry condition must above EMA and alligator signal and not in overbought RSI
Exit signal conditions
1. Lowest price is below Exponential Moving Average
2. Lowest price is below William alligator lines
You can easily find entry and exit points by using Entry (E), Exit(X) signals
How to use
1. Monitor chart and wait until E or X signals
2. Entry if Entry Signal (E) appear (green colored label)
3. Exit if Exit Signal (X) appear (red colored label)
4. Change indicators setting when necessary
Best Practice
1. Entry only when entry signal (E) appear
2. Never entry when price below William alligator signal
3. Exit when exit signal (X) appear
4. Not exit when exit signal appear when you believe or you have information that price will be rebound
5. Exit if you believe that current price meet your target price
6. Always wise when use EneX signals
Disclaimer
Do your own research and consider fundamental price of asset.
The indicators provided on this script is for educational purposes only.
Author does not offer advisory or brokerage services, nor does it recommend or advise users to buy or sell particular stocks or securities.
Please examined script and give feedback for further improvement.

Low-High-Trend StrategyWhen asked what the key to successful investing was, Warren Buffet famously said “buy low, sell high.” Was he onto something? Today I am sharing with the community a simple “buy low, sell high” strategy with an optional trend filter and take-profit target. I’ve found that this strategy works well in a variety of markets but has a higher tendency to out-perform buy & hold in markets that are ranging sideways.
How it works:
The strategy tracks the highest and lowest price over the last X number of bars (you select the look-back period). The highest price line is plotted in green and the lowest price line is potted in red. If the price crosses over the lowest price in the last X number of bars, then a buy signal is generated. Exit options include a take-profit % or selling when the price crosses over the highest price in the last X amount of bars. I.e. “Buy low, sell high.” An EMA is also plotted as a blue trend line, and there is an option to only trade if the price is above the EMA trend line.
Disclaimer: Open source scripts I publish in the community are largely meant to spark ideas that can be used as building blocks for part of a more robust trade management strategy. Even though this example script beats buy and hold over the back-test time-frame, I wouldn't advise using it as a stand-alone strategy without significant additions/modifications to the strategy and risk management functions. In this example the script is being used as a medium-term strategy with just 10% leverage over account equity, a $25k start balance, and back-testing 10+ years. Modifiable slippage and commissions are included in the model.
Green line = Highest price in the look-back period
Red line = Lowest price in the look-back period
Blue line = EMA Trend

ProProfits LongStrategy made ready for automated trading based on Wavetrend/VWAP/RSI.
Whenever a 18 minute timeframe wave reaches below -60 is followed by a 3 minute timeframe VWAP cross up, a long signal will be given.
Once an RSI cross on the 10 minute timeframe above 60 is followed by a red dot on the momentum waves on the 1 minute timeframe, a Take Profit signal will be given.
The timeframes are adjustable in the settings interface, so this automated strategy can be used with any timeframe combination for the Wavetrend/VWAP/RSI.
Always make sure to view the chart from the lowest timeframe you're using.

TradingGroundhog - Fundamental Bot Automation - Fractal/Wave -V1PLEASE READ THE DESCRIPTION - AS THE SCRIPT IS USED FOR AUTOMATION AND TRADING PAIR SWITCH THE MECHANISM CAN BE COMPLICATED TO UNDERSTAND
#-- Pairs Switching - No Repaint - Fractals - Wavetrend --
This strategy uses my fractal/wavetrend previous methods in order to buy/sell.
However, it has been designed in order to switch automatically the pairs on which it trades to reduce the loss and risk.
#-- Synopsis --
To do so, the script uses a Daily wavetrend oscillator. The oscillator is used to find uptrend periods.
From it, the number of uptrend days are counted.
#-- Wavetrend --
For exemple, if BTC/EUR goes from downtrend to uptrend, the script will start to count since how many days the market is uptrend.
Then, if BTC/EUR goes from uptrend to downtrend, the counter will be reset to 0.
The script only trades during uptrend periods.
#-- Pairs --
Up to 35 pairs can be used at the same time. The user can enable of disable to trade on certain pairs.
Uptrend days are counted for each one of those pairs. The user can define on how many pairs the script can trade at the same time.
The select which pairs will be trade, the script sort all the enabled pairs based on their uptrend days counters.
#-- Trade organization --
For exemple if we set 5, as the number of maximum pairs to trade on.
Trades will be conducted on the 5 pairs being in uptrend for the longest time.
Therefore, to organize the money placement on each pair, the equity is used.
For 100% of equity, 10% are kept if losing trades occur.
The remaining 90% are divided by the number of maximum pairs to trade on.
If we chose 5, we will have (90/5) 18% of our capital placed in each bot.
#-- Setting it --
As explained before, this script is used for automation.
For exemple, lets say you are interested by 15 pairs with promising evolution and you set the number of maximum pairs to trade on to 5.
You will have to set alerts for the script on each of the 15 pairs.
You will receive alerts for when to buy and sell.
Note that the script has to be set for each of the selected pairs, it is not able to trade on 15 pairs (thus, webpages) if only set on one Tradingview webpage.
#-- Plot--
Once launch, you can see a plot.
The plot represent the Uptrend days counter for 20 pairs. It also project the organization of the ENABLED pairs.
If a pair is part of the one with the highest number of uprend days. It's name will be displayed under the plot in a yellow comment box.
Four other box are projected to the right of the plot:
White comment : All the pairs sorted from highest number of uptrend days to the lowest.
Red comment : Pairs with the lowest number of uptrend days.
Blue comment : Interesting pairs which will may be uptrend for a long time.
Green comment : Actual pairs with active trading (thus, the pairs with the maximum number of uptrend days)
#-- Bot automation --
If you use 3commas or other trading bot platforms, you will have to set as comments the BUY/SELL alerts. <= Which is what I am doing with it.
Doing so make you trade on multiple pairs, automatically.
However, you will need to set as input the 3commas signal.
For the moment, the script will be needed for it.
However, I will soon release a V2 taking as input the 3commas strategy comments.
For the moment, you can set the script in different webpages and follow BUY/SELL orders by eyes of alerts. ;)
#-- Parameters --
*** Parameters have been intensively optimized using 35 cryptocurrency pairsin order to have potent efficiency for each of them. I would recommend to only change the METHOD SETTINGS. For the others, I don't recommend any modifications. If you need precision on the other parameters of if you want to modify them, more informations can be found in my previous scripts and ***
Filtering method :
Used to reduce or not the risks. If you set Wavetrend, less trades will be conducted as the wavetrend filter from will be used. If you choose Fractal, no Wavetrend signals will be used.
(I prefer to use Fractal as I am using 1 or 3 minutes timeframes for the moment.)
Market Pairs : You can select on which markets the script will trade by enabling it's checkbox.
*** Also, for the moment, due to Pinescript limitation, I cannot set as input the number of active pairs. So I set 5, after optimization, as the default number of maximum pairs to trade on. Thus, you should open webpage for each ENABLED pairs and load the script in each on them. 5 Tradingview webpage will always be active. ***
#-- Timeframe --
You can use the script for Short or Long term trading:
For Short term, you will have to use 1 or 3 minutes timeframes, depending on the volatility of the market. (What I am using)
For Long term, you will have to use 5 or 15 minutes timeframes, depending on the volatility of the market.
#-- Strategy abilities and results for more than a month of activity -- *** !!! IMPORTANT SECTION !!! ***
I have simulated the profit for the 21 ACTIVE pairs I selected has been potent with my Fractal strategy. Different maximum number of trading pairs were used in order to find the best one. The script was run for the last 46 or 30 days.
Different timeframe have been used as pairs have different volatility.
*** If you use the script, SET IT UP with the following pairs and the following timeframes. ***
-------------------------------------------------------------------------------------------------------
Parameters | Maximum number of trading pairs
-------------------------------------------------------------------------------------------------------
Timeframe | Pairs | 1 2 3 5 6 10
-------------------------------------------------------------------------------------------------------
3M | SHIB | 0 0.98 3.63 2.17 2.56 2.56
1M | SOL | 0 1.5 1.08 1.26 0 0
3M | XRP | 10.5 4.56 3.29 2.19 1.52 1.52
3M | ETH | 9.94 6.97 4.55 3.45 2.19 2.19
3M | BTC | 1.7 2.32 1.74 1.88 1.33 1.33
3M | DOT | 0 3.5 2.32 2.27 1.99 1.99
1M | DOGE | 0 0 0 3.14 1.93 1.93
1M | LUNA | 0 0 0 0.23 2.35 2.35
3M | AVAX | 8.92 0 0.53 3.63 1.17 1.17
1M | HOT | 0 0 2.12 7.96 4.69 4.69
3M | GRT | 0 -1.09 -0.82 0.25 -0.191 0
1M | LINK | 0 0 0 0 0 0
1M | CHZ | 0 0 0.4 0.85 1.89 1.91
3M | WIN | 0 0 0.52 5.89 2.8 2..8
3M | ENJ | 32.63 15.65 12.55 10.31 5.62 5.62
3M | RUNE | 0 4.68 3.42 -1.18 2.3 2.3
3M | LTC | 0 -0.06 1.1 1.29 3.49 3.49
3M | BTT | 0 0 0 0.85 1.63 1.63
3M | BCH | 0 0 0 1.36 2.36 2.36
3M | WRX | 0.26 4.66 5.36 4.29 3.01 3.01
3M | ETC | -0.92 0 0 3.6 3.31 3.56
-------------------------------------------------------------------------------------------------------
Net profit % | 63.03 43.67 37.24 55.69 45.949 43.61
Number of days | 46 30 30 46 46 46
Net profit % per day | 1.38 1.46 1.25 1.22 1.00 0.95
-------------------------------------------------------------------------------------------------------
*** Therefore, we are around more than 1% per day in each case. ***
#-- Choosing pairs --
I selected the 35 cryptocurrencies which can be exchange with EUR and evaluated the ability of my Fractal script on them. The on which have been ENABLED (true) are the best.
BINANCE:SHIBEUR | true
BINANCE:SOLEUR | true
BINANCE:XRPEUR | true
BINANCE:ETHEUR | true
BINANCE:BTCEUR | true
BINANCE:DOTEUR | true
BINANCE:ENJEUR | true
BINANCE:DOGEEUR | true
BINANCE:LUNAEUR | true
BINANCE:VETEUR | false
BINANCE:BNBEUR | false
BINANCE:AVAXEUR | true
BINANCE:HOTEUR | true
BINANCE:EGLDEUR | false
BINANCE:GRTEUR | true
BINANCE:MATICEUR | false
BINANCE:LINKEUR | true
BINANCE:CHZEUR | true
BINANCE:ICPEUR | false
BINANCE:UNIEUR | false
BINANCE:WINEUR | true
BINANCE:ADAEUR | false
BINANCE:RUNEEUR | true
BINANCE:TRXEUR | false
BINANCE:THETAEUR | false
BINANCE:EOSEUR | false
BINANCE:LTCEUR | true
BINANCE:XLMEUR | false
BINANCE:BTTEUR | true
BINANCE:SXPEUR | false
BINANCE:LAZIOEUR | false
BINANCE:YFIEUR | false
BINANCE:BCHEUR | true
BINANCE:WRXEUR | true
BINANCE:ETCEUR | true

when bull D timeframeEcco a voi la mia strategia basata su atr con implementazioni personali per definire facilmente la condizione di mercato su btc e eth, come potete vedere punta ad identificare solo le salite più importati ignorando i falsi segnali che avvengono nelle fasi di bear market (o di incertezza). Da utilizzare con timeframe D.
Condivido una versione disponibile e funzionante gratuitamente fino al 31/12/2022 dopo tale data lo script tornerà a pagamento.
Here is my strategy based on atr with personal implementations to easily define the market condition on btc and eth, as you can see it aims to identify only the most important climbs ignoring the false signals that occur in the bear market (or uncertainty) phases. For use with timeframe D. I share a version available and working for free until 31/12/2022 after that date the script will return not for free.
Stay Tuned
