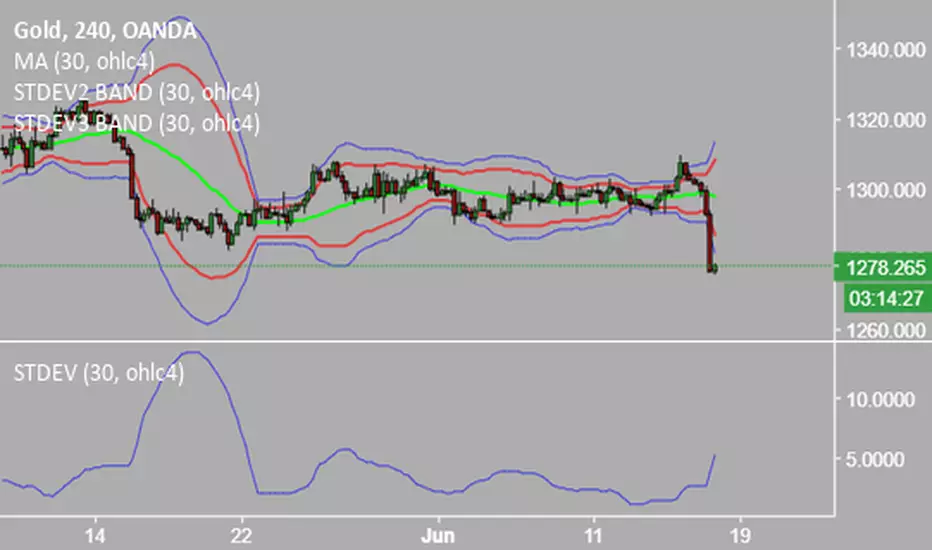
Triple Standard Deviation==日本語説明も併記 // Japanese discription is following ==
■ Momentum Indicator (Triple Indication of Standard Deviation Volatilities)
■ Effective assets: All
■Example of utilization
1) Assume that a trend is generated at the timing when the yellow area chart (26) rises
2) Confirm the candlestick and if the price jumps out of the Bollinger band ± 1 σ, the trend toward that direction
3) If the closing price is confirmed within ± 1σ of the Bollinger band, close the position
■ Detailed explanation
Three standard deviation volatilities with different parameters are displayed at the same time. As represented by convergence divergence of Bollinger, it has a characteristic that it rises in the trend generation period and falls during the trend convergence period.
It develops color in a rising phase so that trend generation is easy to recognize, and fades in a falling phase.
Daily use is basic, but you can use it with the same parameters for other time feet.
The basic parameter (26) is displayed in yellow area for the most visibility.
The long-term parameter (52) is indicated by a yellow dot as an auxiliary element for judging the rising margin of the basic line.
The short-term parameter (13) is displayed as a line as an auxiliary element for recognizing the peak out of the basic line in advance.
In some cases, by changing short term (13) to super long term (100) you can recognize the major market price level once in several years.
Three periods The phrase "all lines" goes from "low position" to "rising together" is considered the strongest trend.
On the other hand, in the case where the short-term line rises backwards as the longer-term line goes down, it tends to end up with short-lived trends and failure to form trends.
If the trend speed is constant as a standard feature of calculating the standard deviation, the standard deviation may decrease even during trend continuation. Therefore, it is desirable to make a comprehensive judgment by comparing the shape of candlestick with the longer-term line.
Please note that there is no way to judge whether the trend suggested by this index rises or falls from this index, so it is necessary to confirm the main chart. (It is preferable to display parabolic or Bollinger band)
■ Remarks
It is an index created assuming that it is used as Triple STD-ADX in combination with Triple Smoothed ADX(to be posted later).
■ About Triple STD-ADX
Triple Standard Deviation "and" Triple Smoothed ADX "are superimposed and displayed as" Screen (without scale) "to function as" Triple STD - ADX ".
The method of utilization is the same as Triple Standard Deviation and Triple Smoothed ADX, but by simultaneously displaying two momentum indicators with different calculation approaches with multiple parameters, we aim to mutually complement the cognitive power of trends.
STD (13, 26, 52, 100, 200) and ADX (7, 14, 26, 52, 100) correspond to reaction rates respectively.
By choosing different reaction rates you can expect to further increase reliability.
You can estimate the reliability of the trend most reliably in a situation where all six signals in total rise from low to high.
■Sample: STD-ADX Trade Signal
========================================================
■ モメンタム指標(標準偏差ボラティリティの3連表示)
■ 有効アセット:すべて
■ 活用の一例
1)黄色のエリアチャート(26)が上昇したタイミングでトレンド発生を想定
2)ローソク足を確認し、ボリンジャーバンド±1σの外に価格が飛び出している場合はその方向へのトレンドと認識
3)ボリンジャーバンド±1σ以内で終値が確定した場合にはポジションクローズ
■ 詳細説明
パラメーターの異なる3つの標準偏差ボラティリティを同時に表示します。ボリンジャーの収束発散に代表されるように、トレンド発生期に上昇しトレンド収束期に低下する特性を持ちます。
トレンド発生を認識しやすいように上昇局面で発色し、下降局面で退色します。
活用は日足が基本ですが、他の時間足に対しても同一パラメーターで使用することができます。
基本パラメーター(26)は最も視認しやすいように黄色のエリア表示にしています。
長期パラメーター(52)は基本線の上昇余力を判断するための補助要素として黄色の丸点で表示しています。
短期パラメーター(13)は基本線のピークアウトを先行して認識するための補助要素としてラインで表示にしています。
場合によって、短期(13)を超長期(100)に変更することで数年に一度のレベルの大相場が認識できます。
3期間「全てのライン」が「低い位置」から「揃って上昇」する局面を最も強いトレンドと考えます。
一方、より長期のラインが低下する中、より短期のラインが逆行して上昇するケースでは、短命のトレンドやトレンド形成失敗に終わることが多くなります。
標準偏差の計算上の特徴としてトレンドの速度が一定の場合にトレンド継続中も標準偏差が低下することがあります。そのため、ローソク足の形状とより長期のラインを見比べて総合的に判断することが望ましいです。
なお、本指標が示唆するトレンドが上昇か下降かは本指標からは判断する術はないため、必ずメインチャートを確認する必要があります。(パラボリックやボリンジャーバンドを表示すると好適)
■備考
追って掲載するTriple Smoothed ADXと併用して、Triple STD-ADXとして使用することを想定して作成した指標です。
■Triple STD-ADXについて
「Triple Standard Deviation」と「Triple Smoothed ADX」を一方を「スクリーン(スケールなし)」として重ねて表示させることで「Triple STD-ADX」として機能します。
活用方法はTriple Standard DeviationやTriple Smoothed ADXと同じですが、算出アプローチの異なる2つのモメンタム指標を複数パラメーターで同時に表示させることで、トレンドの認識力を相互に補完する狙いがあります。
反応速度はそれぞれSTD(13,26,52,100,200)とADX(7,14,26,52,100)がほぼ対応します。
異なる反応速度を選択することで信頼度をさらに高めることを期待できます。
合計6本のシグナル全てが低い位置から揃って上昇する局面でトレンドの信頼性を最も高く見積もることができます。
Standart Sapma

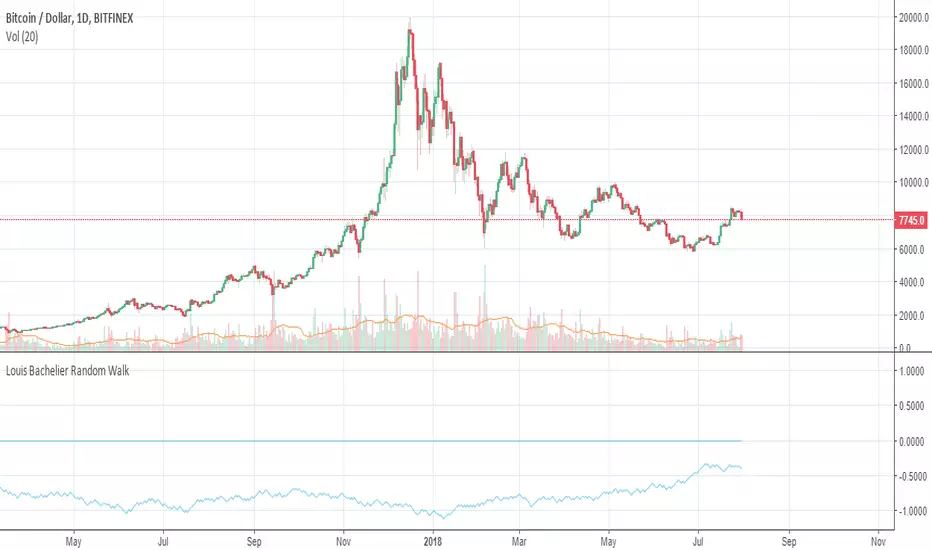
Louis Bachelier's Random WalkSeveral tests of market efficiency have been developed over the years. The very first test, constructed by Louis Bachelier in 1900, measured the probability of a number of consecutively positive or consecutively negative price changes, or “runs.”
The randomness of runs is rejected with 95 percent statistical confidence whenever the plotted value is greater than 0. The randomness of runs cannot be rejected if it's < 0.

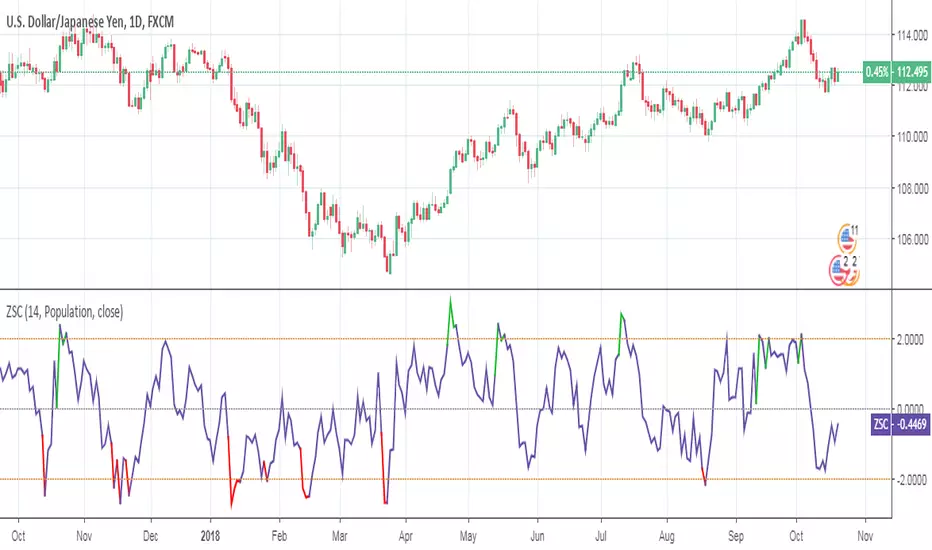
Z-Score (Close)A Z-score is a numerical measurement of a value's relationship to the mean in a group of values. If a Z-score is 0, it represents the score as identical to the mean score.
Z-scores may also be positive or negative, with a positive value indicating the score is above the mean and a negative score indicating it is below the mean. Positive and negative scores also reveal the number of standard deviations that the score is either above or below the mean.

Standard Deviation Pivot pointsSupport Resistance points that are calculated based on the standard deviation of the traditional pivot point(previous session's high, low and close). More often stocks tend to oscillate between 3 levels of deviation forming day's high or low. A breakout of the 3rd SR level with volume indicates a strong trend day.

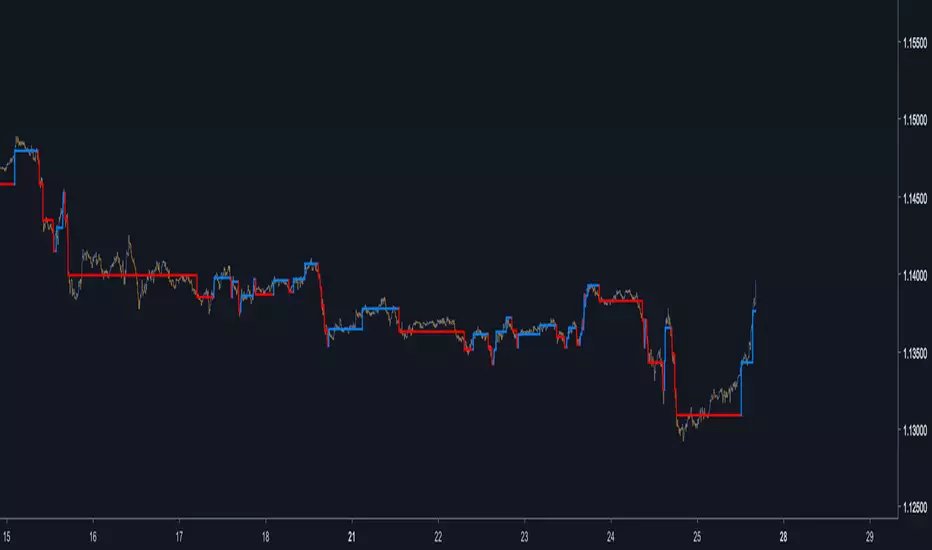
Auto-LineAn indicator inspired by the Renko chart.Instead of using a static box size we use standard deviation, this make the indicator more reactive to the market state.
If the indicator show no values then you have to round the price to the nearest integer, for that use the round parameter.
Hope you enjoy :)
Relative Volatility IndexCorrected Relative Volatility Index. This indicator was originally developed by Donald Dorsey (Stocks & Commodities V.11:6 (253-256): The Relative Volatility Index).
The indicator was revised by Dorsey in 1995 (Stocks & Commodities V.13:09 (388-391): Refining the Relative Volatility Index).
I suggest the refined RVI with optional settings. If you disabled Wilder's Smoothing and Refined RVI you will get the original version of RVI (1993, as built-in).
Also, you can choose an algorithm for calculating Standard Deviation.

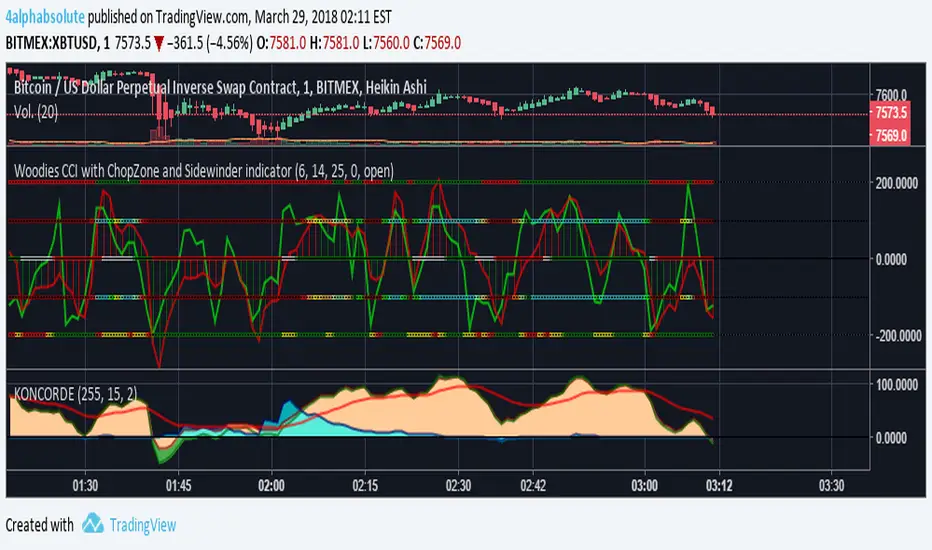
Woodies CCI with ChopZone and Sidewinder indicatorExcelente indicador a mi parecer, bastante complejo pero muy bien acoplado; dejo aquí las fuentes para aprender a utilizarlo:
www.x-trader.net
www.x-trader.net www.x-trader.net www.x-trader.net
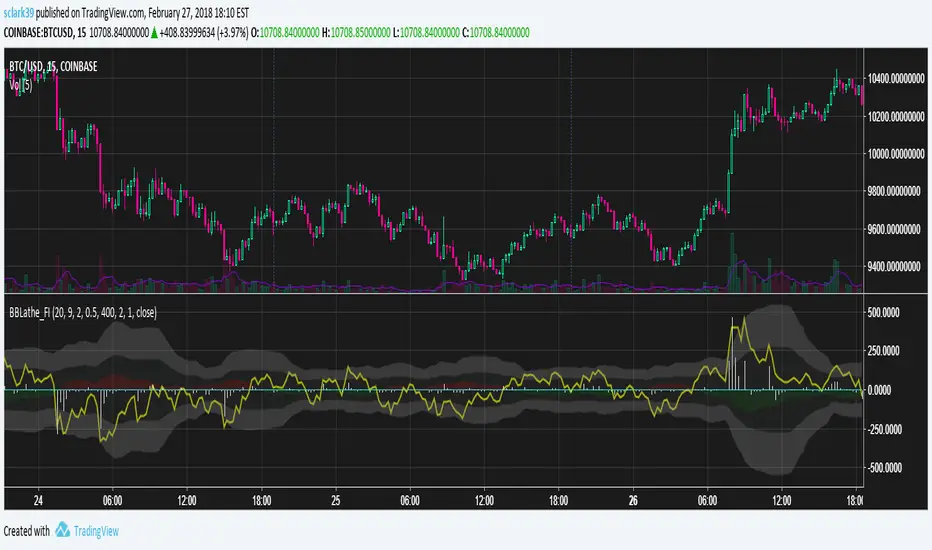
BBLathe2: Bollinger Band Lathe w/ Elder's Force Index [sclark39]Welcome to the second version of the BBLathe!
This shows Bollinger Bands centered on a horizontal basis, to make it easier to see how volatility is changing and identify squeeze opportunities. By default Bollinger bands are calculated using an exponential moving average and an improved higher precision stdev implementation, but this can be disabled. Version 2 also shows Elder's Force Index as a white histogram, so you can see some volume information to help confirm the power of the bears/bulls. The green/red shadow shows how the Bollinger's basis is changing, and when it is going up there will be a green shadow underneath the basis line (this can be inverted in the settings). There is also price line (yellow) showing the location of the price within the Bollinger Bands.
Use this indicator for trades at your own risk, I made this for fun and it is not a trade recommendation.
That being said, if you like my work please tip me!
ETH: 0xf8E0Ea503B5c833fD4546E7fa2c70EcE42A27C8A
Please comment with feedback and requests!
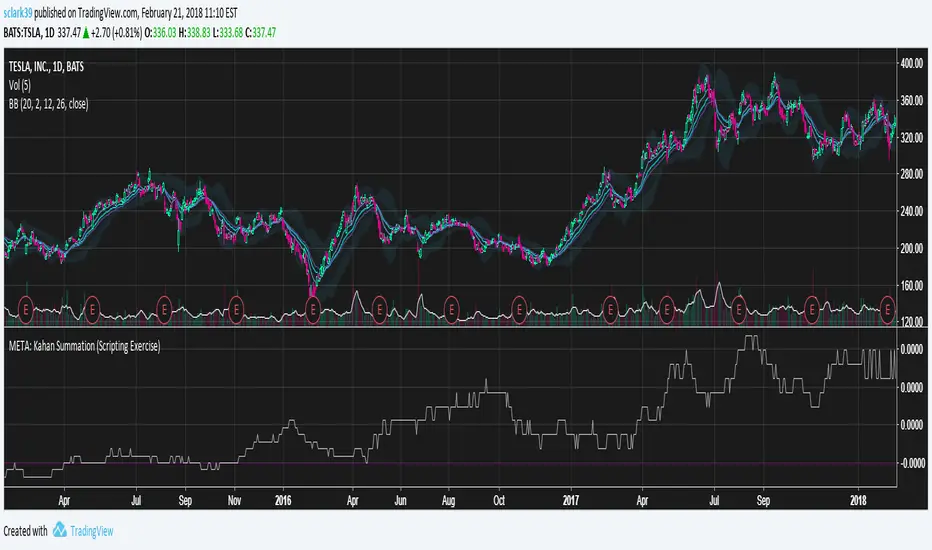
META: Kahan Summation (Scripting Exercise)I was curious to see what Pine uses to accumulate numbers. It looks like it uses the simple "add em up" approach, rather than a compensated summation. This means that especially for large numbers, there is an inherent error amount.
This script implements the Kahan Summation Algorithm, also known as compensated summation.
en.wikipedia.org
This is part 2 of my study into the builtin stdev function. I think this is why it differs so much from the simple two-pass solution.
META: STDEV Study (Scripting Exercise)While trying to figure out how to make the STDEV function use an exponential moving average instead of simple moving average , I discovered the builtin function doesn't really use either.
Check it out, it's amazing how different the two-pass algorithm is from the builtin!
Eventually I reverse-engineered and discovered that STDEV uses the Naiive algorithm and doesn't apply "Bessel's Correction". K can be 0, it doesn't seem to change the data although having it included should make it a little more precise.
en.wikipedia.org

SD_Bull_Bear_Engulfing_Rsi_SdThis strategy combines the idea of a bullish or bearish candle engulfing coupled with standard deviation (a 100% increase or a 50% decrease). The exit condition is placed if the percentage increase is achieved or 35<rsi<65.
The strategy requires refinement so please test the script and let know what can be incorporated to improve the efficiency.

Exponential Bollinger Bands [Updated Feb 2018]The same as my previous Exponential Bollinger Bands script, but now you can set a desired offset for the indicator. I have published this as a new script that way those who prefer the old script can continue to use it without seeing any changes.

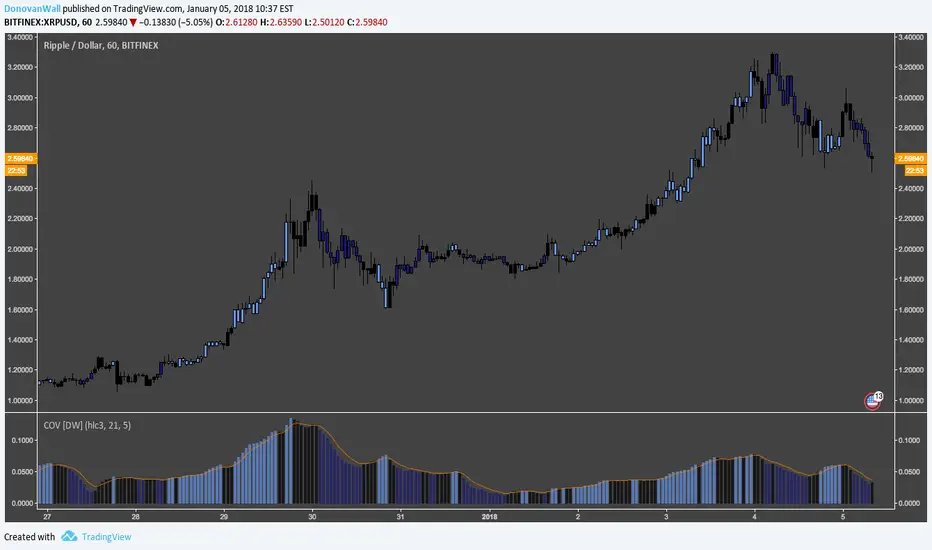
Coefficient of Variation [DW]This is a simple gauge of volatility using the Coefficient of Variation.
COV is calculated by dividing standard deviation of price by the expected (average) price.
Custom color scheme indicates increases and decreases in volatility, which is indicated when the COV forms new half period highs and lows.
SigmaSpikes(R) per Adam H. GrimesEach bar’s return against a volatility-adjusted baseline, as a standard deviation of the last 20 bars’ returns as per Adam H. Grimes SigmaSpikes(R).
adamhgrimes.com
www.marketlifetrading.com

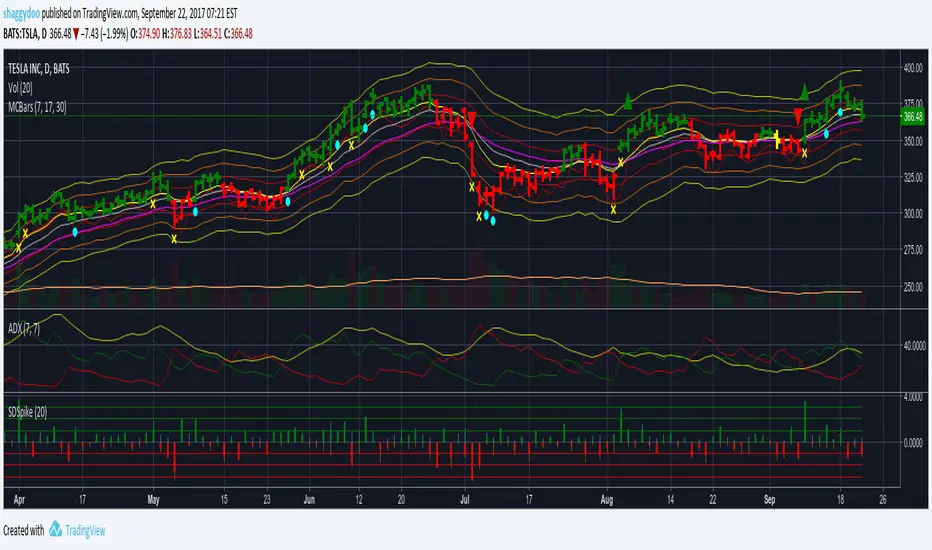
SDSpikePrice Change as Standard Deviation Spikes
Plots price changes scaled to daily StdDev for the period
The Close price change is plotted as a thick bar coloured green for up close, red for down close
The High price change is plotted as a thin bar coloured aqua
The Low price change is plotted as a thin bar coloured orange
Can be used to understand the statistical price behaviour of the symbol.
Very useful for earnings trades and in general for options trades.
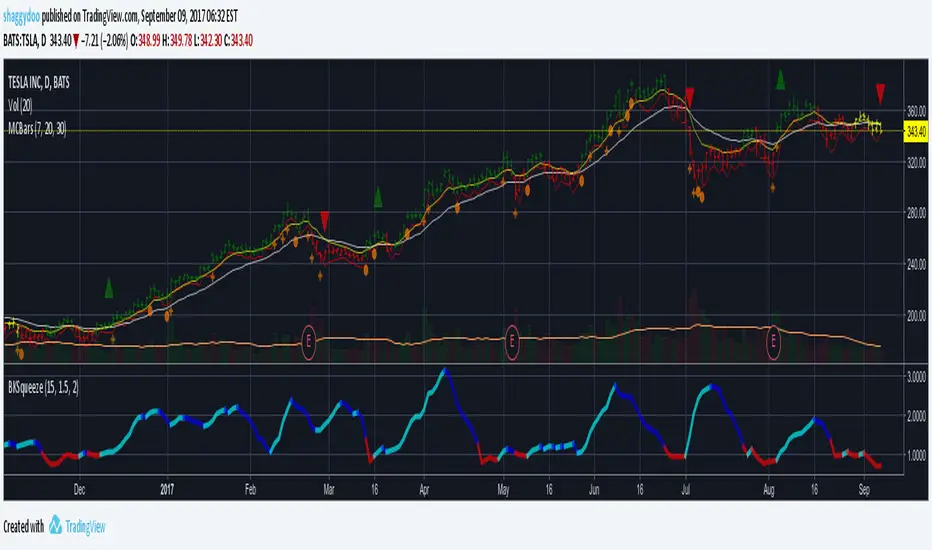
BKSqueezeThis is a price volatility compression and expansion indicator that uses the ratio of the Bollinger Band and Keltner Ratio.
Red segments indicate extreme price volatility compression that can be ideal entry points for stock/futures/forex and/or options positions.
Aqua segments indicate price volatility is expanding.
Blue segments indicate price volatility is compressing - can be used as an exit point or partial scale out point.
Note that the indicator doesn't indicate direction. One suggestion is to use the DMI indicator for this purpose - really depends on how early you enter the trade.
Suggest using a time period of 15 bars for volatile stocks, such as TSLA for example, otherwise a period of 20 bars suits most stocks/futures/forex symbols.
OHLC Volatility Estimators by @Xel_arjonaDISCLAIMER:
The Following indicator/code IS NOT intended to be a formal investment advice or recommendation by the author, nor should be construed as such. Users will be fully responsible by their use regarding their own trading vehicles/assets.
The embedded code and ideas within this work are FREELY AND PUBLICLY available on the Web for NON LUCRATIVE ACTIVITIES and must remain as is by Creative-Commons as TradingView's regulations. Any use, copy or re-use of this code should mention it's origin as it's authorship.
WARNING NOTICE!
THE INCLUDED FUNCTION MUST BE CONSIDERED AS DEBUGING CODE The models included in the function have been taken from openly sources on the web so they could have some errors as in the calculation scheme and/or in it's programatic scheme. Debugging are welcome.
WHAT'S THIS?
Here's a full collection of candle based (compressed tick) Volatility Estimators given as a function, openly available for free, it can print IMPLIED VOLATILITY by an external symbol ticker like INDEX:VIX.
Models included in the volatility calculation function:
CLOSE TO CLOSE: This is the classic estimator by rule, sometimes referred as HISTORICAL VOLATILITY and is the must common, accepted and widely used out there. Is based on traditional Standard Deviation method derived from the logarithm return of current close from yesterday's.
ELASTIC WEIGHTED MOVING AVERAGE: This estimator has been used by RiskMetriks®. It's calculation is based on an ElasticWeightedMovingAverage Standard Deviation method derived from the logarithm return of current close from yesterday's. It can be viewed or named as an EXPONENTIAL HISTORICAL VOLATILITY model.
PARKINSON'S: The Parkinson number, or High Low Range Volatility, developed by the physicist, Michael Parkinson, in 1980 aims to estimate the Volatility of returns for a random walk using the high and low in any particular period. IVolatility.com calculates daily Parkinson values. Prices are observed on a fixed time interval. n=10, 20, 30, 60, 90, 120, 150, 180 days.
ROGERS-SATCHELL: The Rogers-Satchell function is a volatility estimator that outperforms other estimators when the underlying follows a Geometric Brownian Motion (GBM) with a drift (historical data mean returns different from zero). As a result, it provides a better volatility estimation when the underlying is trending. However, this Rogers-Satchell estimator does not account for jumps in price (Gaps). It assumes no opening jump. The function uses the open, close, high, and low price series in its calculation and it has only one parameter, which is the period to use to estimate the volatility.
YANG-ZHANG: Yang and Zhang were the first to derive an historical volatility estimator that has a minimum estimation error, is independent of the drift, and independent of opening gaps. This estimator is maximally 14 times more efficient than the close-to-close estimator.
LOGARITHMIC GARMAN-KLASS: The former is a pinescript transcript of the model defined as in iVolatility . The metric used is a combination of the overnight, high/low and open/close range. Such a volatility metric is a more efficient measure of the degree of volatility during a given day. This metric is always positive.

Daily Deviations (Self Input Version)
Plots the standard deviation resistance/support levels.
Input the previous settlement price and the implied volatility.
credit to u/UberBotMan and u/Living_Granger for the idea and formulas
(preview example is using settlement of 2420 and IV of 11)

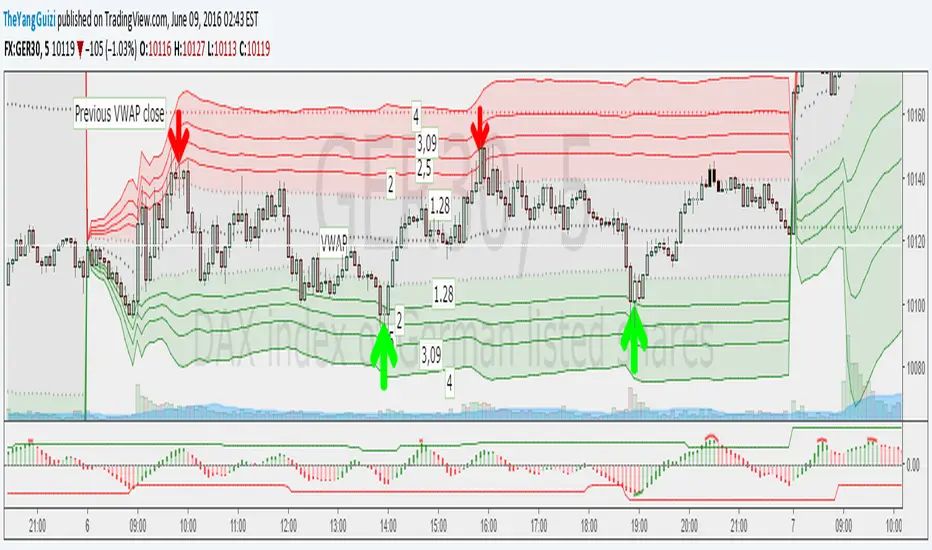
VWAP Stdev Bands v2 Modoriginal script by /u/SandroTurriate/ - I just made some small changes.
Vwap + standard deviation bands. Good for reversal trading among other things. Used intraday.
Very useful when price is ranging.
I added the option to fill the spaces between the deviation lines with color and also the option to add some extra bands. That's about it. Color/length/style etc is customizable.