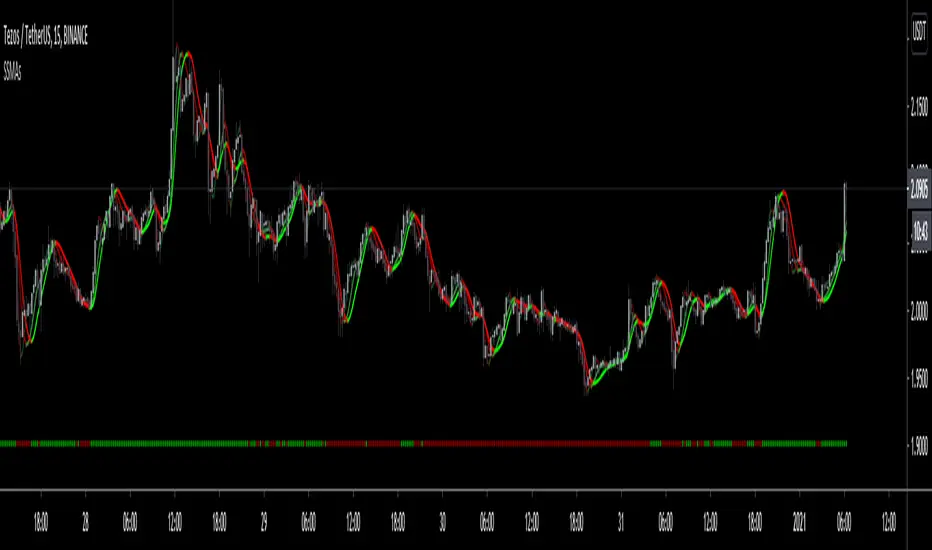
Scalping using RSI 2 indicator with TSLThis strategy implements a simply scalping using the RSI (calculated on two periods), the slopes of two MAs ( EMA or SMA ) having different lengths (by default, I use 50 and 200).
A trailing stop loss (%) is used.
Entry conditions:
.) Fast MA > Slow MA and Price > Slow MA and RSI < Oversold Threshold ------> go Long
.) Fast MA < Slow MA and Price < Slow MA and RSI > Overbought Threshold ------> go Short
Exit conditions:
.) Long entry condition is true and (close >= TP or close <= TSL ) ----> close short position
.) Short entry condition is true and (close <= TP or close >= TSL ) ----> close long position
The strategy performed best on Bitcoin and the most liquid and capitalized Altcoins but works excellent on volatile assets, mainly if they often go trending.
Works best on 3h - 4h time frame.
There's also an optional Volatility filter, which opens the position only if the difference between the two slopes is more than a specific value, which can be set in the study inputs. The purpose is not opening positions if the price goes sideways and the noise is way > than the signal.
Note:
.) the RSI length is 2;
.) the oversold Threshold is 90%;
.) the overbought Threshold is 10%;
.) by default, the trailing stop loss per cent is 1%;
.) by default, the fast MA length is 50;
.) by default, the slow MA length is 200;
.) by default, the MA used is EMA.
Cheers.
Sma

Customisable Moving Averages x5This is a Moving Averages pack with 5 lines.
This indicator is different from others because with it you can select the MA type used in calculations for each line.
Available MA types are (currently):
SMA
EMA
WMA
VWMA
RMA
HMA
Also configurable (for each line) are data source (open, close, hlc3, etc) and period.
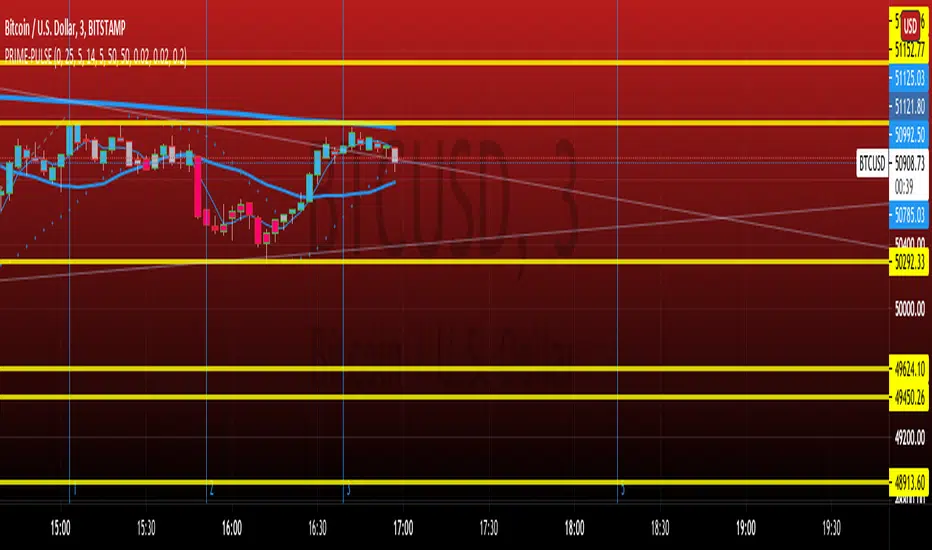
PRIME IMPULSE W/ 3MAThis indicator bundle, combined with PRIME-QUARTERS, provides a trader with everything needed, on chart, to make swing and scalper entries. The short candle SMA are used to execute immediate entries, while the larger candle tf indicate Continuation, trend changes and swing points. The color coded impulse indicator used both RSI and TSI variables to determine divergences and the probability of the impending impulse thereafter. Red and green within the candles indicate bull or bearish impulses, while the yellow bars signal decreased volume and momentum for the current impulse, indicating the possible end of trend and either retracement, or Reversal. $auceCamp
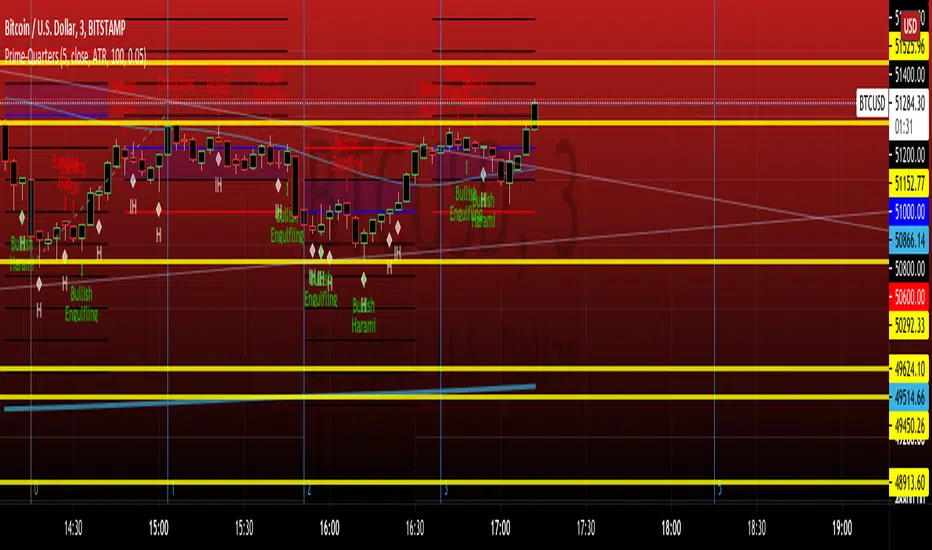
PRIME-QUARTERS W-XsThis script applies both the Quaters theory for easy analysis of market structure, as well as a 50 and 800 SMA to be used in conjunction with the 4 and 21 SMA found in Prime-Pulse, to pin point sniper entries. $auceCamp
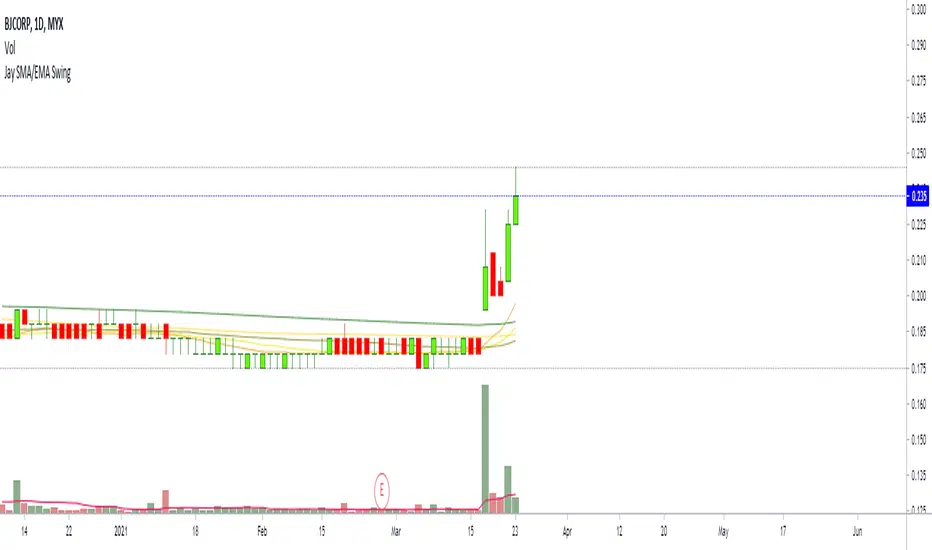
Swing Trade - Jay Swing
shortest = ema(low, 9)
short = sma(low, 45)
longer = ema(close, 100)
longest = ema(close, 200)
MA, MATR, ChEx | All in One - 4CR CUPIn trade position setup, we always need to determine the market structure and manage the position sizing in a short period of decision time. Indicators such as moving average, initial stop loss and trailing stop loss are always helpful.
This indicator put all these handy tools into a single toolkit, which includes the following price action and risk management indicators:
MA - Moving Average
MATR - Moving Average less Average True Range
ChEx - Chandelier Exit
This script further enhances the setting so that you can easily customize the indicators.
For both the Moving Averages and the Moving Average less Average True Range , you can pick a type of moving average which suits your analysis style from a list of commonly used moving average formulations: namely, EMA , HMA , RMA, SMA and WMA , where EMA is selected as default.
The Moving Average less Average True Range , MATR, is usually applied as a reference to set the initial stop loss whenever opening a new position.
The abbreviation, MATR, is picked, so that this can serve as a handy reminder of a very good trading framework as elaborates as below:
M – Market Structure
A – Area of Value
T – Trigger
R – Risk Management (aka. Exit Strategy)

AEP Trend IndicatorWARNING!!!
This indicator is used not to sell and buy but to predict a trend.
Different Moving Averages are used for different periods.
Moving average is used for support and resistance line.It is safer to wait for the closing after the signals.
The bottom red line is the stop level.
The top black line is the dynamic resistance line.
The blue zone represents between resistance and stop line.
The green zone represents a rising trend.
The red zone represents a falling trend.
A close above resistance is a buy signal or you can wait for the indicator to signal.
For now, it only works in 15-minute, 1-Hour and 4-hour time frames and it’s public.

Rainbow Trend IndicatorThis is an indicator based on the MA rainbow concept. It is possible to choose between 15 or 20 MA's and if all 15 MA's is picked, the calculation will be calculated on 15 MA's and if 20 is picked the calculation is calculated on 20 MA's. The indicator will then be a line which is assigned a value from the calculation based on the MA's. If the line is above the dashed zero line, meaning the line's last value is a positive value, the price is in a uptrend and if the line is below the dashed zero line, meaning the line's last value is a negative value, the price is in a downtrend.
In short
If the line is green, the price is in a uptrend. If the line is red, the price is in a downtrend.

NSDT Anchored MAThis script allows you to choose a starting point or "anchor" for a moving average. You can choose an EMA, SMA, or WMA and set the length and the source (close, open, hlc3, etc...). Keep in mind that it needs to count the number of candles you specify as the length in order to begin an accurate representation. So we suggest to start the plot earlier since it will need time to calculate the "average". For example: If you choose 20 as the length, it is going to take 20 candles to become accurate.

Triple SMA Strategy with entries based on sma price closesHi! :)
This strategy is made for intraday trades, especially on 5 sec - 5 min charts to follow the trend.
I have not tested on higher timeframes, but feel free to play with the values.
I have set a basic value for the 3 SMA at
-200
-400
-600
We will use an oscillator for entries which is not mine. Link ->
The oscillator mentioned above is just for visualization purposes, You do not need to get the signals, but You can see how scripts are generated with different values.
When the price above/below all the 3 SMA and oscillator crosses above/below "value you set" - You will get the buy or sell signal.
Your stop will be where the slowest SMA is.
Pyramiding is set for 10.
You can manually set 3 take profit and quantity levels.
Basic values are 1 %, 2 %, and 6 % for taking profits - You can change it based on how volatile the asset is.
Basic quantity values are 30 % at each level.
Hope You find it useful :)

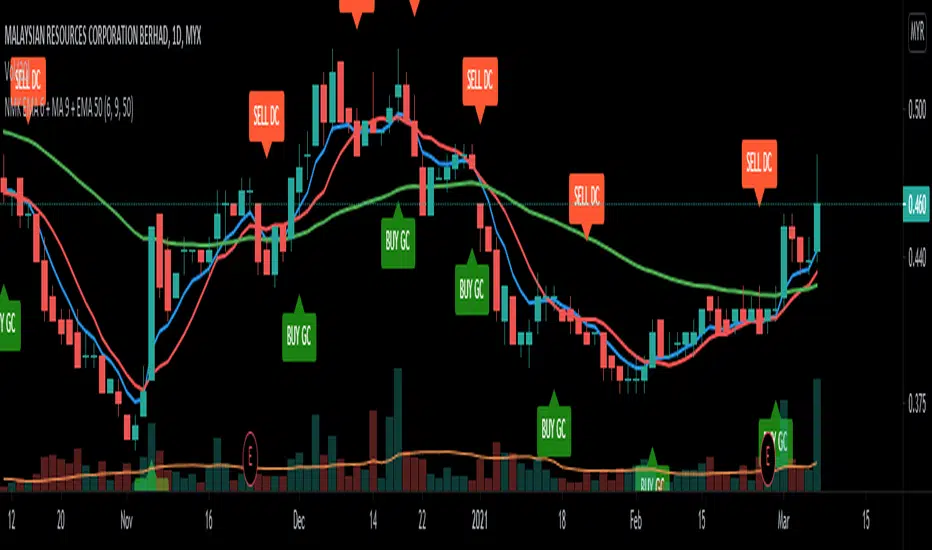
NMK EMA 6 + MA 9 + EMA 50Conceived by Murad Khalid
Shows the GC of EMA 6 and MA 9
Shows the DC of EMA 6 and MA 9
Use EMA 50 as the dynamic support
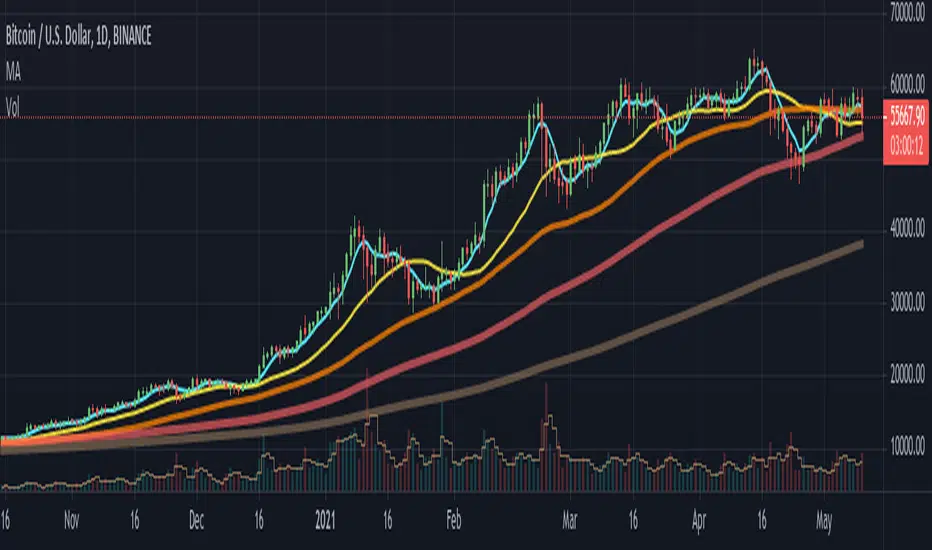
TradiKator 01 MATradiKator 01 MA is the a visual indicator that plots market capitalized cost following moving average (SMA and EMA) , based on LEI & LoneCapital defined metrology method and includes the TradiKator creative idea to help visualize the Price action in relation to the market capitalized cost.
Q&A
Q1.Why Moving Average ?
As LEI & LoneCapital explained moving average is indicating market capitalized cost moving.
If you are a trend following trader, you should participate in upside while sidestepping downside.
You need a indicator that help you to make money while prices are rising, then exit when they are falling.
A classical approach is the moving average strategy.
Nevertheless as efficient-market hypothesis (EMH) states that asset prices will reflect all available information.
The smart trader should focus on price moving i.s.o. reading all available information which is not practical.
Q2.What is Moving Average ?
As the name implies, the moving average is an average of a price's movement over time.
The simple moving average (SMA) is a just simple average over time.
The exponential moving average (EMA) on the other hand gives greater weight to more recent price action.
Q2.What are the Period Moving Average based on ?
The default Moving Average Period setting are based on LEI & LoneCapital defined Short term 20 (days in month), Mid term 60 (days in quarter), Long term 120 (days in half year).
We use 3 colors to represent these 3 periods. Black as Short term , Red as Mid term , Blue as Long term
You will see same color scheme in our indicators.
Of cause you can change the default setting to switch to your favorite Moving Average Period. How to do it is listed in setting.
Function and Setting
1.MA period setting
"Adjust All MA Period" --> Users can increase or decrease all 3 period in the same time. For example, input "-1" , you will have 3 periods as "19","59","119"
"Fix the M_MA=3*S_MA,L_MA = 6*S_MA (overwrite below 2 settings)" --> It will fix the Mid period as 3 times of short, Long period as 6 times of short. Meanwhile the separated setting for Mid and long will be ignored.
"3 period separated settings" --> Please disable the "fix ..." setting for individual 3 periods
"Source" --> Allow user switch used source from "close" to any other data source like"hl2","hlc3" and etc.
2.Deduction price Setting
"Show deduction price label (Pls disable the angle)" --> Will show 3 deduction price. Please disable the "Show Angle ..." before enable this switch.
"Arrow on Slope (Deduction vs Today Which is higher)" --> Will show 3 arrows aim to the higher price between Deduction and Today.
Also the dashed slope line will change to solid line. It helps when Deduction is very close to Today
3.Angle for slope line ---> Killer feature
"Show Angle ..." --> As LEI & LoneCapital explained current trend can be described as "o'clock direction wise" .
By measuring current trend's "angle" we can has a fuzzy image about current trend.
Note: In fact there is real 12 o'clock or 90 degree, therefore we define our "90 degree" and all called value of "angle" is based on our defined metric.
Also everyone has different opinion about the start point of current trend.
We choose the 3 MA periods as the start point to measure the angles.
There are 3 mod prepared for the angle measure metrology.
Abs % --> "90 deg" = increase 100% in 20 days. It is the most robust mod.
1Y rel % --> "90 deg" = increase 50% of 1Y Absolute price range in 20 days. It can't be used in case of minus price.(like CL future in 2020 Mar)
1Y rel log --> "90 deg" = increase 50% of 1Y log scaled price range in 20 days. Also it can't be used in case of minus price.
4.Deduction price trail and Background color
"Show Deduction price trail" --> Enable it to show the 3 Deduction prices' trail.
"Show trail in the coming days" --> Enable : the prices' trail is showed in the coming days. Disable : the prices' trail is showed on the MA period historical days.
"MA long term Trend Background Color" --> Similar to the "fill EMA with color", fill the Background with color which represent the EMA trend.
5.High volume and Show gap
"High volume label" --> Highlight the high volume with label.
We define the volume which is higher than percentile value of 3 MA historical volume statistical metrics.
So the black label means this volume is higher than 97 percentile value of 20 days' volume. Red 60 days and Blue 120 days.
The percentile can be set by user. Also the MA period can be adjusted by user.
"Show gap" --> Highlight the gap between close and next day open.
Note: We don't measure whether the gap is closed or not.
6.Forecast SMA ---> Killer feature
As you noticed the dashed line after today, it is our killer feature: forecast SMA.
Green Dashed line: The close price according to the assumption user input.
3 colors' Dashed lines: The SMA based on the Green Dashed line's close price.
"Days to plot forecast SMA (Max=14, SwitchOff=0)" --> Please decide how many days' SMA user would like to forecast.
"Mod1 Assumed chg ratio ‰ in the every days (10=1%)" --> Mod1: User should give the change rate in the coming every days. For example, user's assumption is that price will increase 10% everyday.
"Mod2 Assumed chg % in the ?th day (1=1%)(Pls set Mod1 to 0)" --> Mod2: User should give the change rate in the future ?th days. For example, user's assumption is that price will increase 30% in the 3rd day.
"Mod2 Need ? day to reach the chg % (tomorrow = 1 day)" --> Mod2: User should give the future ?th days.
note: While using Mod2, user has to disable Mod1 by set Mod1 to 0 (default setting)
TradiKator is Traders' indicator.
Please visit TraiKator for more free script.
We also support Chinese.

Combined EMA & MA crossovers [CDI]Implementation of the strategy of moving averages crossings combining two fast and two slow that are used to confirm the entry.
The purpose is to be able to quickly see a backtesting of the strategy by easily configuring the profit / loss percentage. In this script the profit percentage is used for the loss percentage as well.
Additionally you can see the moving averages all in a single chart tool.
In the community to which I belong, this strategy is used in daily candles, especially for swing trading, but it can be used in different time frames.
WARNING:
- For purpose educate only
- The entries are used under your responsibility

Multiple Moving AveragesThis script adds up to 5 moving averages to your chart - and you can select which moving average type (and timeframe) you want to use for each.
The possible MA type options are:
EMA
SMA
HMA
WMA
DEMA
VWMA
VWAP
You can specify the length of each moving average, and you can override the type of all moving averages with the setting "ALL MA TYPE".
There is also higher-timeframe functionality, so you can select the timeframe for each moving average.
If the "Smooth HTF MA" setting is turned on then the script will fill any gaps in intraday price data by averaging the difference (giving it a regular smooth look), and if it's turned off then the HTF MAs will have a "stepped" look to them. Technically speaking, the non-smoothed setting is more accurate and so it's turned off by default.
And finally, the first option "Color MA 1" will change your first MA's color based on whether price action is above that MA's price or below it. If it's above it then the color turns green, if it's below it then it turns red.
If you set an MA's length to zero it will disable that MA.
The source code is protected but available on my website (link in my profile).
Enjoy! Good luck with your trading :) 😎

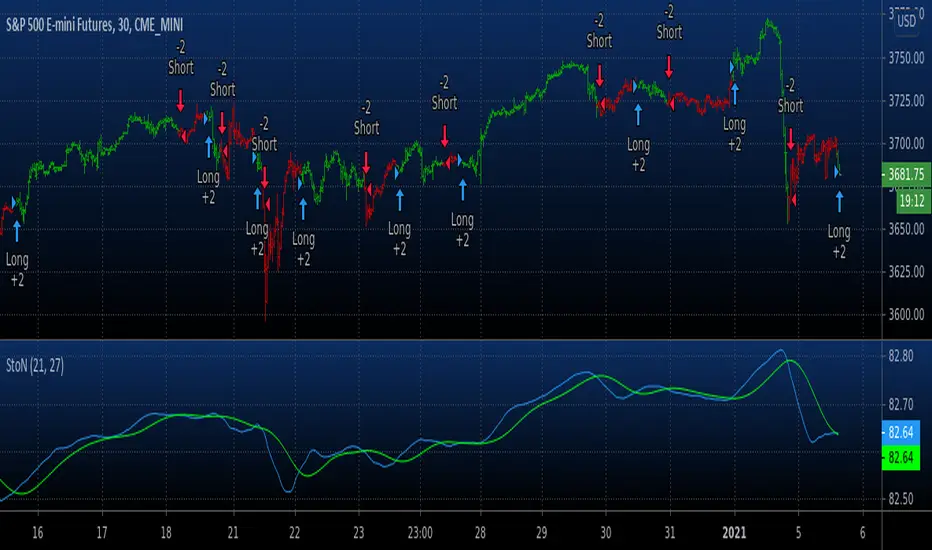
Backtest Signal To Noise This source code is subject to the terms of the Mozilla Public License 2.0 at mozilla.org
© HPotter 05/01/2021
The signal-to-noise (S/N) ratio.
And Simple Moving Average.
Thank you for idea BlockchainYahoo
WARNING:
- For purpose educate only
- This script to change bars colors.
SwingScalpin MA'sDefault
HMA's + Trend Signals
Default SMA's
ALMA
BarColoring
The idea behind this script was to incorporate a few different moving average types into 1 indicator so multiple trading strategies could be implemented depending on Price Action. This indicator includes 3 HMA's, 2 user defined EMA/SMA's, 1 ALMA (which also is used for the bar coloring), and Trend signals at the bottom of the chart (which are defined by the 1st MA). By default all of the Moving Averages are set to false because they aren't meant to be used together unless you so chose to. The only feauture initially being shown are the Trend signals at the bottom of the screen.
HMA's - The default lengths for the HMA's are 7, 14, and 21.
This is not Financial Advice nor am I saying this works all of the time but here are a few examples of how I've traded the HMA's... OF course thid depends on overall PA but the idea is to enter and exit when all
three HMA's turn Green or Red...
For quicker entries and exits, you could enter when the Fast HMA crosses the Medium HMA and exit when the it crosses back over/under the Medium HMA.
For more of a swing trade and when there's definitely an established trend, I would stay in the trade until Fast HMA crosses under the Slow HMA, otherwise it might just be a normal retrace prior to making another move up.
When PA is ranging but not really trending in either direction, I'll use the Slow HMA as somewhat of a Trailing SL.
The 2 user defined moving averages can either be an EMA or SMA. The 1st MA is set to the 200 SMA by default, which also triggers the Trend signals at the bottom of the chart. The 2nd MA is set to the 6 SMA by default.
The ALMA is set to 50 by default, which is also used for the bar coloring. Lastly, all of the MA's change color depending on the trend.
Custom Moving Average (EMA & SMA)This script is a custom visualization tool to plot 4 Moving Averages (MA).
Each MA is customizable; you can:
enable (disable) the plot of MA;
select whether the MA is an EMA or an SMA;
the length;
the source (open, close, ...);
the offset value (default is 0).
Note:
The 1st MA is an EMA with length 50.
The others MAs are SMA with length 9, 30 and 100 respectively.

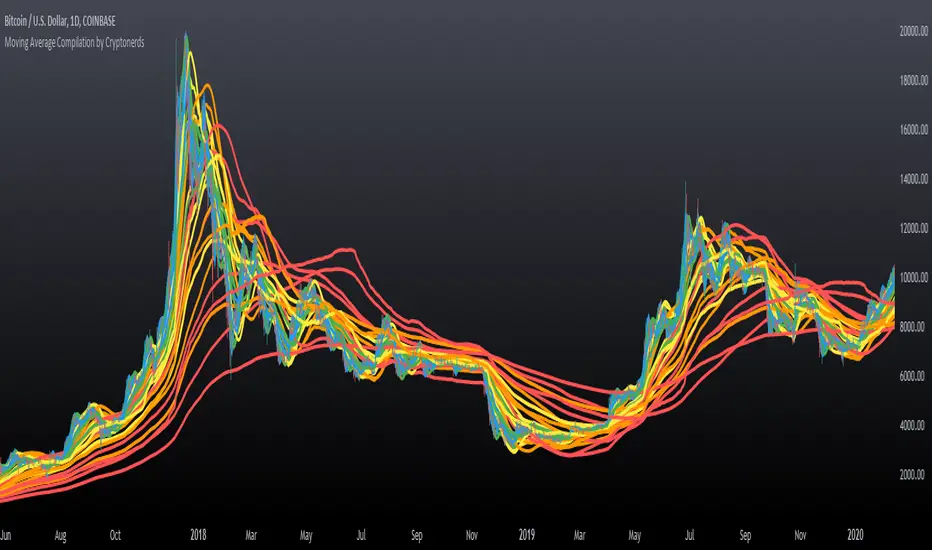
Moving Average Compilation by CryptonerdsThis script contains all commonly used types of moving averages in a single script. To our surprise, it turned out that there was no script available yet that contains multiple types of moving averages.
The following types of moving averages are included:
Simple Moving Averages (SMA)
Exponential Moving Averages (EMA)
Double Exponential Moving Averages (DEMA)
Display Triple Exponential Moving Averages (TEMA)
Display Weighted Moving Averages (WMA)
Display Hull Moving Averages (HMA)
Wilder's exponential moving averages (RMA)
Volume-Weighted Moving Averages (VWMA)
The user can configure what type of moving averages are displayed, including the length and up to five multiple moving averages per type. If you have any other request related to adding moving averages, please leave a comment in the section below.
If you've learned something new and found value, leave us a message to show your support!
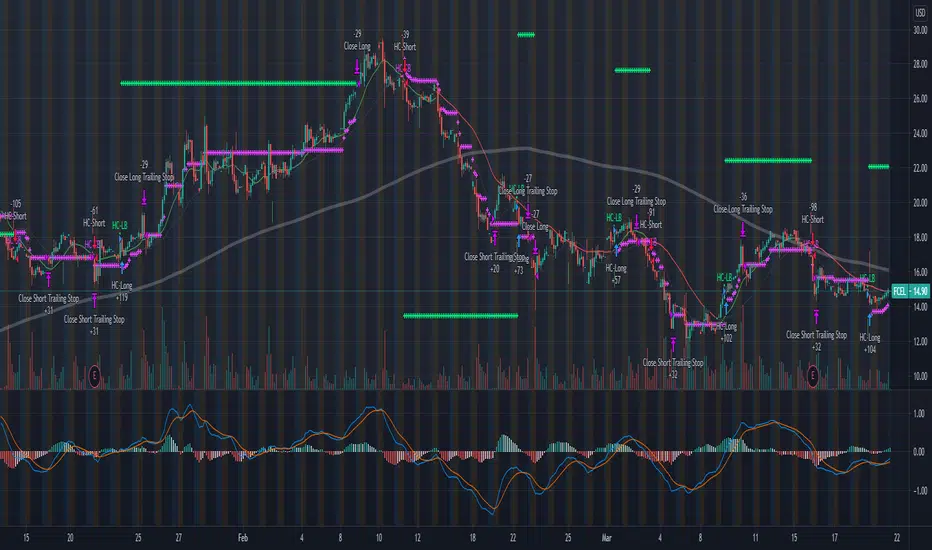
KISS Strategy: SMA + EMA//Hello my fellow investors
//I am creating a simple non-cluttered strategy that uses 3(+1) simple means to determine: viability, entry, and exit
//1) Has a consistent trend been maintained for several days/weeks
//2) SH SMA crossover LG SMA = Bullish entry/LG SMA crossover SH SMA = Bearish entry
//3) Use the Slope factor & Weeks in Trend (WiT) to dertermine how strong of an entry signal you are comfortable with
//4) Exit position based on next SMA cross and trend reversal or stop loss%
//3+1) For added confidence in trend detection: Apply MACD check - buy--> MACD line above signal line and corssover below histogram \\ sell --> MACD line below signal line and crossover above histogram.
//*)This code also allows you to determine your desired backtesting date compliments of alanaster
The chart shown has:
Starting Capital: $10,000
Investment percent per trade: 1.5%
Stop Loss: 20%
Take Profit: 100%
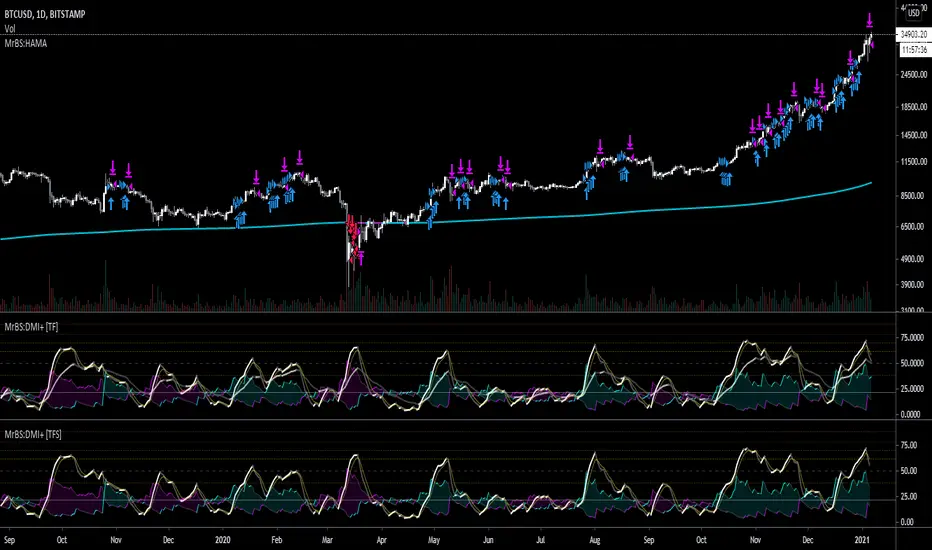
MrBS:EMA/SMA/HMA (Heikin Ashi Calc)This indicator allows you to base the MA calculation from Heikin Ashi values on normal charts and/or the real OHLC values while looking at Heikin Ashi.
There are 3 MA types you can select - EMA / SMA / HMA
The colour is based on the slope.
I made this to help me visualize my DMI+ strategy, when I was looking at taking signals from Heikin Ashi but looking at candlesticks. Turns out, I was going down the wrong road. Now I'm looking into using the real OHLC values for generating signals but watching the Heikin Ashi chart as I find it easier to see trends on it.
Hopefully its useful to some people, and if you have any suggestions for improvements I'd love to know.
[MACLEN] HODL ZONE RENKO
PLEASE READ!
Trade at your own risk. Please read about renko charts before using this indicator. This indicator is for educational purposes only.
This Indicator is only valid in renko charts with 1 second timeframe. For BTCUSDT . With the traditional method and the size box of 80.
With this indicator we can detect zones of buy and sell. Even that is not recommended to use leverage, I use it to find an entry and use only small leverages. It could be also used to accumulate and HODL bitcoin .
Please, comment anything.
POR FAVOR LEER!
Tradea bajo tu propio riesgo. Por favor lee sobre las graficas renko antes de usar este indicador. Este indicador es solamente con fines educativos.
Este indicador es válido solamente en graficas renko con un timeframe de 1 segundo. Para BTCUSDT . Con cajas del método tradicional de un tamaño de 80.
Con este indicador podemos detectar zonas de compra y venta. A pesar de que no es recomendable usar apalancamiento, yo lo uso para encontrar entradas y solo uso apalancamientos pequeños. También podría usarse para acumular y holdear bitcoin .
Por favor, escríbeme cualquier duda o comentario.
