Dual SMA/EMA Strategy with Alerts200 SMA 9/21 EMA with EMA Golden Crossover warning. Helps with detecting when a GoldenCross has been triggered.
Sma

FlexMAFlexMA – Time-based moving average
FlexMA plots a moving average based on real-world time (like “5 days”) instead of fixed bar lengths.
Choose the MA type (SMA, EMA, etc.), enter a timespan and unit, and the script automatically adjusts across any chart timeframe.
This was created out of a demand for moving average indicator that was easy to configure across any time frame but the results end up consistent. For example, a 5 Day SMA where it looks the same at every interval.
Powered by:
Electrified/Time – Converts spans to lengths
Electrified/MovingAverages – Provides modular MA logic
Example: Want a 3-day EMA? Just set:
Plot: EMA
Timespan: 3
Unit: Days
Clean, adaptive, and great for multi-timeframe setups.

Normalized Volume & True RangeThis indicator solves a fundamental challenge that traders face when trying to analyze volume and volatility together on their charts. Traditionally, volume and price volatility exist on completely different scales, making direct comparison nearly impossible. Volume might range from thousands to millions of shares, while volatility percentages typically stay within single digits. This indicator brings both measurements onto a unified scale from 0 to 100 percent, allowing you to see their relationship clearly for the first time.
The core innovation lies in the normalization process, which automatically calculates appropriate scaling factors for both volume and volatility based on their historical statistical properties. Rather than using arbitrary fixed scales that might work for one stock but fail for another, this system adapts to each instrument's unique characteristics. The indicator establishes baseline averages for both measurements and then uses statistical analysis to determine reasonable maximum values, ensuring that extreme outliers don't distort the overall picture.
You can choose from three different volatility calculation methods depending on your analytical preferences. The "Body" option measures the distance between opening and closing prices, focusing on the actual trading range that matters most for price action. The "High/Low" method captures the full daily range including wicks and shadows, giving you a complete picture of intraday volatility. The "Close/Close" approach compares consecutive closing prices, which can be particularly useful for identifying gaps and overnight price movements.
The indicator displays volume as colored columns that match your candlestick colors, making it intuitive to see whether high volume occurred during up moves or down moves. Volatility appears as a gray histogram, providing a clean background reference that doesn't interfere with volume interpretation. Both measurements are clipped at 100 percent, which represents their calculated maximum normal values, so any readings near this level indicate unusually high activity in either volume or volatility.
The baseline reference line shows you what "normal" volume looks like for the current instrument, helping you quickly identify when trading activity is above or below average. Optional moving averages for both volume and volatility are available if you prefer smoothed trend analysis over raw daily values. The entire system updates in real-time as new data arrives, continuously refining its statistical calculations to maintain accuracy as market conditions evolve.
This two-in-one indicator provides a straightforward way to examine how price movements relate to trading volume by presenting both measurements on the same normalized scale, making it easier to spot patterns and relationships that might otherwise remain hidden when analyzing these metrics separately.

MA Cross MTF Alert (Miu)This script extends the classic moving average crossover strategy with support for up to 8 user-defined symbols across 4 custom timeframes, combined with a visual and alert system designed for traders who monitor multiple assets simultaneously.
Unlike traditional MA crossover tools, this script enables traders to receive real-time alerts for crossovers across multiple assets and timeframes, even when the script is not actively displayed on the chart — ideal for passive monitoring in multi-asset strategies.
What it does:
This script calculates two customizable moving averages (SMA or EMA) for each selected symbol and timeframe.
It then tracks crossover events:
- Bullish crossover when the fast MA crosses above the slow MA
- Bearish crossunder when the fast MA crosses below the slow MA
On the chart, it also displays the crossover signals for the current symbol and timeframe using color-coded cross icons.
Key features:
- Select SMA or EMA type for both moving averages
- Customize MA lengths and colors
- Works with any asset and timeframe
- Alerts include symbol and timeframe info for easy identification
How to use:
1) Add the indicator to your chart.
2) Choose the moving average type and lengths.
3) Enable/disable any of the 8 symbols and 4 timeframes.
4) Set up TradingView alerts by clicking “Create Alert” and selecting one of the alert() calls.
5) You will receive a message like:
BTC (1h) | MA Crossover ▲ or ETH (15m) | MA Crossunder ▼
Technical note:
This script uses request.security() to retrieve moving average values from up to 8 different symbols and 4 different timeframes in real time.
Feel free to leave your feedback or suggestions in the comments section below.
Enjoy!

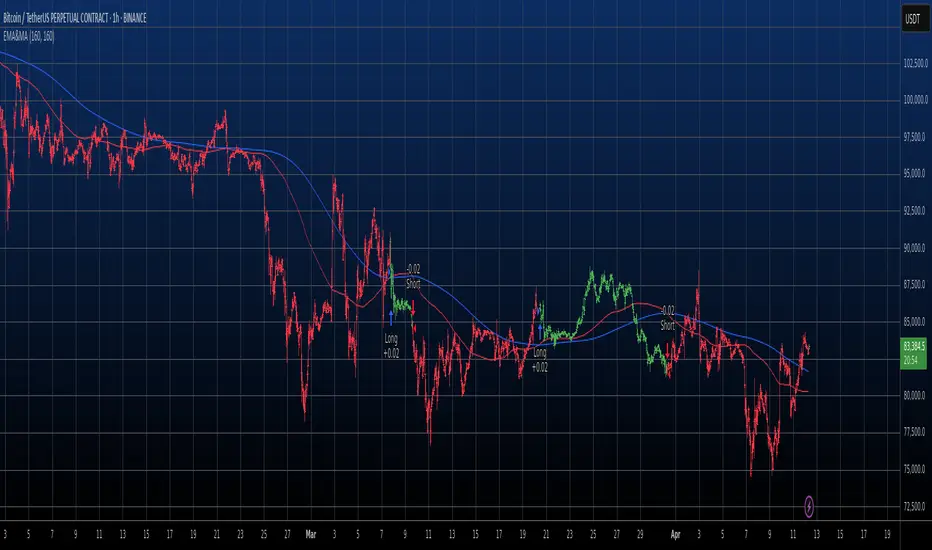
Pucci Trend EMA-SMA Crossover with TolerancePucci Trend EMA-SMA Crossover with Tolerance
This indicator helps identify market trends and generates trading signals based on the crossover between an Exponential Moving Average (EMA) and a Simple Moving Average (SMA) with an adjustable tolerance threshold. The signals work as follows:
Buy Signal (B) -> Triggers when the EMA crosses above the SMA, exceeding a user-defined tolerance (in basis points). Optionally, a price filter can require the high or low to be below the EMA for confirmation.
Sell Signal (S) -> Triggers when the SMA crosses above the EMA, exceeding the tolerance. The optional price filter may require the high or low to be above the EMA.
The tolerance helps reduce false signals by requiring a minimum distance between the moving averages before confirming a crossover. The price filter adds an extra confirmation layer by checking if price action respects the EMA level.
Important Notes:
1º No profitability guarantee: This tool is for analysis only and may generate losses.
2º "As Is" disclaimer: Provided without warranties or responsibility for trading outcomes.
3º Use Stop Loss: Users must determine their own risk management.
4º Parameter adjustment needed: Optimal MA periods and tolerance vary by timeframe.
5º Filter impact varies: Enabling/disabling the price filter may improve or worsen performance.

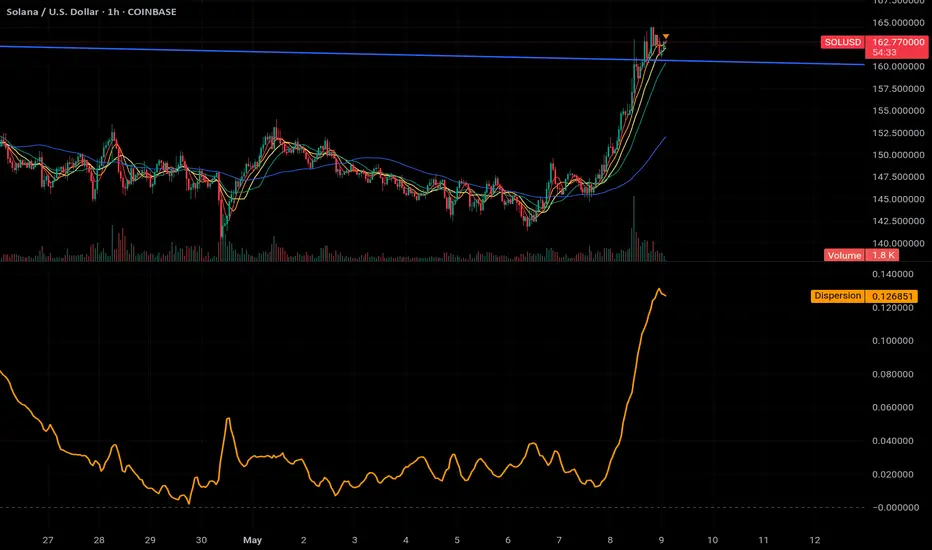
MA Dispersion+MA Dispersion+ — read the “breathing space” between your moving-averages
Get instant feedback on trend strength, volatility expansion and mean-reversion — across any timeframe.
MA Dispersion+ turns the humble moving-average stack into a single, easy-to-read oscillator that tells you at a glance whether price is coiling or fanning out.
🧩 What it does
Plugs into your favourite MA setup
• Pick the classic 5 / 20 / 50 / 200 lengths or disable any combination with one click.
• Choose the MA engine you trust — SMA, EMA, RMA, VWMA or WMA.
• Works on any timeframe thanks to TradingView’s security() engine.
Measures “spread”
For every bar it calculates the absolute distance of each selected MA from their average.
The tighter the stack, the lower the value; the wider the fan, the higher the value.
Adds professional-grade controls
• Weighting — let short-term MAs dominate (Inverse Length), keep everything equal, or dial in your own custom weights.
• Normalisation — convert the raw distance into a percentage of price, ATR multiples, or scale by the MAs’ own mean so you can compare symbols of any price or volatility.
🔍 How traders use it
Trend confirmation – rising dispersion while price breaks out = momentum is genuine.
Volatility squeeze – dispersion parking near zero warns that a big move is loading.
Multi-TF outlook – drop one pane per timeframe (e.g. 5 m, 1 h, 1 D) and see which layer of the market is driving.
Mean-reversion plays – spikes that fade quickly often coincide with exhaustion and snap-backs.
⚙️ Quick-start
Add MA Dispersion+ to your chart.
Set the pane’s timeframe in the first input.
Tick the MA lengths you actually use.
(Optional) Pick a weighting scheme and a normaliser.
Repeat the indicator for as many timeframes as you like — each instance keeps its own settings.
✨ Why you’ll love it
Zero clutter – one orange line tells you what four separate MAs whisper.
Configurable yet bullet-proof – all lengths are hard-coded constants, so Pine never complains.
Context aware – normalisation lets you compare BTC’s $60 000 chaos with EURUSD’s four--decimals calm.
Lightweight – no labels, no drawings, no background processing — perfect for mobile and multi-pane layouts.
Give MA Dispersion+ a try and let your charts breathe — you’ll never look at moving-average ribbons the same way again.
Happy trading!
RSI-EMA-Crossing with Donchian-Stop-LossThe Donchian RSI Indicator is a visual tool that combines momentum and trend analysis to identify high-quality long opportunities based on RSI crossovers, price action, and Donchian channel dynamics.
How It Works
Momentum Signal: A bullish RSI crossover is detected when the RSI crosses above its moving average.
Trend Filter: A signal is only valid if the crossover occurs while the price is above its moving average – filtering out entries against the prevailing trend.
Signal Candle: The high of the crossover candle is stored.
Entry Trigger: A valid signal occurs when a later candle closes above that signal high.
Stop-Loss (Visual Only)
The lower band of the Donchian Channel acts as a visual reference for a dynamic stop-loss level.
Features
Customizable RSI, Donchian Channel, and moving average lengths
Selectable MA types: SMA, EMA, WMA, VWMA, HMA
Signal candle highlighted (yellow background)
Entry points labeled on the chart
Price MA and Donchian Channel plotted
Trend filter improves signal quality by confirming upward bias
Use Case
Designed for swing and position traders
Optimized for use on daily or 4H charts

HL2 Moving Average with BandsThis indicator is designed to assist traders in identifying potential trade entries and exits for S&P 500 (ES) and Nasdaq-100 (NQ) futures. It calculates a Simple Moving Average (SMA) based on the HL2 value (average of high and low prices) of the current candle over a user-defined lookback period (default: 200 periods). The indicator plots this SMA as a blue line, providing a smoothed reference for price trends.
Additionally, it includes upper and lower bands calculated as a percentage (default: 0.5%) above and below the SMA, plotted as green and red lines, respectively. These bands act as dynamic thresholds to identify overbought or oversold conditions. The indicator generates trade signals based on price action relative to these bands:
Long Entry: A green upward triangle is plotted below the candle when the close crosses above the upper band, signaling a potential buy.
Close Long: A red square is plotted above the candle when the close crosses back below the upper band, indicating an exit for the long position.
Short Entry: A red downward triangle is plotted above the candle when the close crosses below the lower band, signaling a potential sell.
Close Short: A green square is plotted below the candle when the close crosses back above the lower band, indicating an exit for the short position.
The script is customizable, allowing users to adjust the SMA length and band percentage to suit their trading style or market conditions. It is plotted as an overlay on the price chart for easy integration with other technical analysis tools.
Recommended Time Frame and Settings for Trading S&P 500 and Nasdaq-100 Futures
Based on research and market dynamics for S&P 500 (ES) and Nasdaq-100 (NQ) futures, the 5-minute chart is recommended as the optimal time frame for day trading with this indicator. This time frame strikes a balance between capturing intraday trends and filtering out excessive noise, which is critical for futures trading due to their high volatility and leverage. The 5-minute chart aligns well with periods of high liquidity and volatility, such as the U.S. market open (9:30 AM–11:00 AM EST) and the afternoon session (2:00 PM–4:00 PM EST), when institutional traders are most active.
Why 5-minute? It allows traders to react to short-term price movements while avoiding the rapid fluctuations of 1-minute charts, which can be prone to false signals in choppy markets. It also provides enough data points to make the SMA and bands meaningful without the lag associated with longer time frames like 15-minute or hourly charts.
Recommended Settings
SMA Length: Set to 200 periods. This longer lookback period smooths the HL2 data, reducing noise and providing a reliable trend reference for the 5-minute chart. A 200-period SMA helps identify significant trend shifts without being overly sensitive to minor price fluctuations.
Band Percentage: 0.5% is more suitable for the volatility of ES and NQ futures on a 5-minute chart, as it generates fewer but higher-probability signals. Wider bands (e.g., 1%) may miss short-term opportunities, while narrower bands (e.g., 0.1%) may produce excessive false signals.
Trading Session Recommendations
Futures markets for ES and NQ are open nearly 24 hours (Sunday 6:00 PM EST to Friday 5:00 PM EST, with a daily break from 4:00 PM–5:00 PM EST), but not all hours are equally optimal due to varying liquidity and volatility. The best times to trade with this indicator are:
U.S. Market Open (9:30 AM–11:00 AM EST): This period is characterized by high volume and volatility, driven by the opening of U.S. equity markets and economic data releases (e.g., 8:30 AM EST reports like CPI or GDP). The indicator’s signals are more reliable during this window due to strong order flow and price momentum.
Afternoon Session (2:00 PM–4:00 PM EST): After the lunchtime lull, volume picks up as institutional traders return, and news or FOMC announcements often drive price action. The indicator can capture breakout moves as prices test the upper or lower bands.
Pre-Market (7:30 AM–9:30 AM EST): For traders comfortable with lower liquidity, this period can offer opportunities, especially around 8:30 AM EST economic releases. However, use tighter risk management due to wider spreads and potential volatility spikes.
Additional Tips
Avoid Low-Volume Periods: Steer clear of trading during low-liquidity hours, such as the overnight session (11:00 PM–3:00 AM EST), when spreads widen and price movements can be erratic, leading to false signals from the indicator.
Combine with Other Tools: Enhance the indicator’s effectiveness by pairing it with support/resistance levels, Fibonacci retracements, or volume analysis to confirm signals. For example, a long entry signal above the upper band is stronger if it coincides with a breakout above a key resistance level.
Risk Management: Given the leverage in futures (e.g., Micro E-mini contracts require ~$1,200 margin for ES), use tight stop-losses (e.g., below the lower band for longs or above the upper band for shorts) to manage risk. Aim for a risk-reward ratio of at least 1:2.
Test Settings: Backtest the indicator on a demo account to optimize the SMA length and band percentage for your specific trading style and risk tolerance. Micro E-mini contracts (MES for S&P 500, MNQ for Nasdaq-100) are ideal for testing due to their lower capital requirements.
Why These Settings and Time Frame?
The 5-minute chart with a 200-period SMA and 0.5% bands is tailored for the volatility and liquidity of ES and NQ futures during peak trading hours. The longer SMA period ensures the indicator captures meaningful trends, while the 0.5% bands are tight enough to signal actionable breakouts but wide enough to avoid excessive whipsaws. Trading during high-volume sessions maximizes the likelihood of valid signals, as institutional participation drives clearer price action.
By focusing on these settings and time frames, traders can leverage the indicator to capitalize on the dynamic price movements of S&P 500 and Nasdaq-100 futures while managing the inherent risks of these markets.

RSI - 5UP Overview
The "RSI - 5UP" indicator is a versatile tool that enhances the traditional Relative Strength Index (RSI) by adding smoothing options, Bollinger Bands, and divergence detection. It provides a clear visual representation of RSI levels with customizable bands and optional moving averages, helping traders identify overbought/oversold conditions and potential trend reversals through divergence signals.
Features
Customizable RSI: Adjust the RSI length and source to fit your trading style.
Overbought/Oversold Bands: Visualizes RSI levels with intuitive color-coded bands (red for overbought at 70, white for neutral at 50, green for oversold at 30).
Smoothing Options: Apply various types of moving averages (SMA, EMA, SMMA, WMA, VWMA) to the RSI, with optional Bollinger Bands for volatility analysis.
Divergence Detection: Identifies regular bullish and bearish divergences, with visual labels ("Bull" for bullish, "Bear" for bearish) and alerts.
G radient Fills: Highlights overbought and oversold zones with gradient fills (green for overbought, red for oversold).
How to Use
1. Add to Chart: Apply the "RSI - 5UP" indicator to any chart. It works well on timeframes from 5 minutes to daily.
2. Configure Settings:
RSI Settings:
RSI Length: Adjust the period for RSI calculation (default: 14).
Source: Choose the price source for RSI (default: close).
Calculate Divergence: Enable to detect bullish/bearish divergences (default: disabled).
Smoothing:
Type: Select the type of moving average to smooth the RSI ("None", "SMA", "SMA + Bollinger Bands", "EMA", "SMMA (RMA)", "WMA", "VWMA"; default: "SMA").
Length: Set the period for the moving average (default: 14).
BB StdDev: If "SMA + Bollinger Bands" is selected, adjust the standard deviation multiplier for the bands (default: 2.0).
3.Interpret the Indicator:
RSI Levels: The RSI line (purple) oscillates between 0 and 100. Levels above 70 (red band) indicate overbought conditions, while levels below 30 (green band) indicate oversold conditions. The 50 level (white band) is neutral.
Gradient Fills: The background gradients (green above 70, red below 30) highlight overbought and oversold zones for quick reference.
Moving Average (MA): If enabled, a yellow MA line smooths the RSI. If "SMA + Bollinger Bands" is selected, green bands appear around the MA to show volatility.
Divergences: If "Calculate Divergence" is enabled, look for "Bull" (green label) and "Bear" (red label) signals:
Bullish Divergence: Indicates a potential upward reversal when the price makes a lower low, but the RSI makes a higher low.
Bearish Divergence: Indicates a potential downward reversal when the price makes a higher high, but the RSI makes a lower high.
4. Set Alerts:
Use the "Regular Bullish Divergence" and "Regular Bearish Divergence" alert conditions to be notified when a divergence is detected.
Notes
The indicator does not provide direct buy/sell signals. Use the RSI levels, moving averages, and divergence signals as part of a broader trading strategy.
Divergence detection requires the "Calculate Divergence" option to be enabled and may not work on all timeframes or assets due to market noise.
The Bollinger Bands are only visible when "SMA + Bollinger Bands" is selected as the smoothing type.
Credits
Developed by Marrulk. Enjoy trading with RSI - 5UP! 🚀

EMA & MA Crossover StrategyGuys, you asked, we did. Strategy for crossing moving averages .
The Moving Average Crossover trading strategy is possibly the most popular
trading strategy in the world of trading. First of them were written in the
middle of XX century, when commodities trading strategies became popular.
This strategy is a good example of so-called traditional strategies.
Traditional strategies are always long or short. That means they are never
out of the market. The concept of having a strategy that is always long or
short may be scary, particularly in today’s market where you don’t know what
is going to happen as far as risk on any one market. But a lot of traders
believe that the concept is still valid, especially for those of traders who
do their own research or their own discretionary trading.
This version uses crossover of moving average and its exponential moving average.
Strategy parameters:
Take Profit % - when it receives the opposite signal
Stop Loss % - when it receives the opposite signal
Current Backtest:
Account: 1000$
Trading size: 0.01
Commission: 0.05%
WARNING:
- For purpose educate only
- This script to change bars colors.
Uptrick: Acceleration ShiftsIntroduction
Uptrick: Acceleration Shifts is designed to measure and visualize price momentum shifts by focusing on acceleration —the rate of change in velocity over time. It uses various moving average techniques as a trend filter, providing traders with a clearer perspective on market direction and potential trade entries or exits.
Purpose
The main goal of this indicator is to spot strong momentum changes (accelerations) and confirm them with a chosen trend filter. It attempts to distinguish genuine market moves from noise, helping traders make more informed decisions. The script can also trigger multiple entries (smart pyramiding) within the same trend, if desired.
Overview
By measuring how quickly price velocity changes (acceleration) and comparing it against a smoothed average of itself, this script generates buy or sell signals once the acceleration surpasses a given threshold. A trend filter is added for further validation. Users can choose from multiple smoothing methods and color schemes, and they can optionally enable a small table that displays real-time acceleration values.
Originality and Uniqueness
This script offers an acceleration-based approach, backed by several different moving average choices. The blend of acceleration thresholds, a trend filter, and an optional extra-entry (pyramiding) feature provides a flexible toolkit for various trading styles. The inclusion of multiple color themes and a slope-based coloring of the trend line adds clarity and user customization.
Inputs & Features
1. Acceleration Length (length)
This input determines the number of bars used when calculating velocity. Specifically, the script computes velocity by taking the difference in closing prices over length bars, and then calculates acceleration based on how that velocity changes over an additional length. The default is 14.
2. Trend Filter Length (smoothing)
This sets the lookback period for the chosen trend filter method. The default of 50 results in a moderately smooth trend line. A higher smoothing value will create a slower-moving trend filter.
3. Acceleration Threshold (threshold)
This multiplier determines when acceleration is considered strong enough to trigger a main buy or sell signal. A default value of 2.5 means the current acceleration must exceed 2.5 times the average acceleration before signaling.
4. Smart Pyramiding Strength (pyramidingThreshold)
This lower threshold is used for additional (pyramiding) entries once the main trend has already been identified. For instance, if set to 0.5, the script looks for acceleration crossing ±0.5 times its average acceleration to add extra positions.
5. Max Pyramiding Entries (maxPyramidingEntries)
This sets a limit on how many extra positions can be opened (beyond the first main signal) in a single directional trend. The default of 3 ensures traders do not become overexposed.
6. Show Acceleration Table (showTable)
When enabled, a small table displaying the current acceleration and its average is added to the top-right corner of the chart. This table helps monitor real-time momentum changes.
7. Smart Pyramiding (enablePyramiding)
This toggle decides whether additional entries (buy or sell) will be generated once a main signal is active. If enabled, these extra signals act as filtered entries, only firing when acceleration re-crosses a smaller threshold (pyramidingThreshold). These signals have a '+' next to their signal on the label.
8. Select Color Scheme (selectedColorScheme)
Allows choosing between various pre-coded color themes, such as Default, Emerald, Sapphire, Golden Blaze, Mystic, Monochrome, Pastel, Vibrant, Earth, or Neon. Each theme applies a distinct pair of colors for bullish and bearish conditions.
9. Trend Filter (TrendFilter)
Lets the user pick one of several moving average approaches to determine the prevailing trend. The options include:
Short Term (TEMA)
EWMA
Medium Term (HMA)
Classic (SMA)
Quick Reaction (DEMA)
Each method behaves differently, balancing reactivity and smoothness.
10. Slope Lookback (slopeOffset)
Used to measure the slope of the trend filter over a set number of bars (default is 10). This slope then influences the coloring of the trend filter line, indicating bullish or bearish tilt.
Note: The script refers to this as the "Massive Slope Index," but it effectively serves as a Trend Slope Calculation, measuring how the chosen trend filter changes over a specified period.
11. Alerts for Buy/Sell and Pyramiding Signals
The script includes built-in alert conditions that can be enabled or configured. These alerts trigger whenever the script detects a main Buy or Sell signal, as well as extra (pyramiding) signals if Smart Pyramiding is active. This feature allows traders to receive immediate notifications or automate a trading response.
Calculation Methodology
1. Velocity and Acceleration
Velocity is derived by subtracting the closing price from its value length bars ago. Acceleration is the difference in velocity over an additional length period. This highlights how quickly momentum is shifting.
2. Average Acceleration
The script smooths raw acceleration with a simple moving average (SMA) using the smoothing input. Comparing current acceleration against this average provides a threshold-based signal mechanism.
3. Trend Filter
Users can pick one of five moving average types to form a trend baseline. These range from quick-reacting methods (DEMA, TEMA) to smoother options (SMA, HMA, EWMA). The script checks whether the price is above or below this filter to confirm trend direction.
4. Buy/Sell Logic
A buy occurs when acceleration surpasses avgAcceleration * threshold and price closes above the trend filter. A sell occurs under the opposite conditions. An additional overbought/oversold check (based on a longer SMA) refines these signals further.
When price is considered oversold (i.e., close is below a longer-term SMA), a bullish acceleration signal has a higher likelihood of success because it indicates that the market is attempting to reverse from a lower price region. Conversely, when price is considered overbought (close is above this longer-term SMA), a bearish acceleration signal is more likely to be valid. This helps reduce false signals by waiting until the market is extended enough that a reversal or continuation has a stronger chance of following through.
5. Smart Pyramiding
Once a main buy or sell signal is triggered, additional (filtered) entries can be taken if acceleration crosses a smaller multiplier (pyramidingThreshold). This helps traders scale into strong moves. The script enforces a cap (maxPyramidingEntries) to limit risk.
6. Visual Elements
Candles can be recolored based on the active signal. Labels appear on the chart whenever a main or pyramiding entry signal is triggered. An optional table can show real-time acceleration values.
Color Schemes
The script includes a variety of predefined color themes. For bullish conditions, it might use turquoise or green, and for bearish conditions, magenta or red—depending on which color scheme the user selects. Each scheme aims to provide clear visual differentiation between bullish and bearish market states.
Why Each Indicator Was Part of This Component
Acceleration is employed to detect swift changes in momentum, capturing shifts that may not yet appear in more traditional measures. To further adapt to different trading styles and market conditions, several moving average methods are incorporated:
• TEMA (Triple Exponential Moving Average) is chosen for its ability to reduce lag more effectively than a standard EMA while still reacting swiftly to price changes. Its construction layers exponential smoothing in a way that can highlight sudden momentum shifts without sacrificing too much smoothness.
• DEMA (Double Exponential Moving Average) provides a faster response than a single EMA by using two layers of exponential smoothing. It is slightly less smoothed than TEMA but can alert traders to momentum changes earlier, though with a higher risk of noise in choppier markets.
• HMA (Hull Moving Average) is known for its balance of smoothness and reduced lag. Its weighted calculations help track trend direction clearly, making it useful for traders who want a smoother line that still reacts fairly quickly.
• SMA (Simple Moving Average) is the classic baseline for smoothing price data. It offers a clear, stable perspective on long-term trends, though it reacts more slowly than other methods. Its simplicity can be beneficial in lower-volatility or more stable market environments.
• EWMA (Exponentially Weighted Moving Average) provides a middle ground by emphasizing recent price data while still retaining some degree of smoothing. It typically responds faster than an SMA but is less aggressive than DEMA or TEMA.
Alongside these moving average techniques, the script employs a slope calculation (referred to as the “Massive Slope Index”) to visually indicate whether the chosen filter is sloping upward or downward. This adds an extra layer of clarity to directional analysis. The indicator also uses overbought/oversold checks, based on a longer-term SMA, to help filter out signals in overstretched markets—reducing the likelihood of false entries in conditions where the price is already extensively extended.
Additional Features
Alerts can be set up for both main signals and additional pyramiding signals, which is helpful for automated or semi-automated trading. The optional acceleration table offers quick reference values, making momentum monitoring more intuitive. Including explicit alert conditions for Buy/Sell and Pyramiding ensures traders can respond promptly to market movements or integrate these triggers into automated strategies.
Summary
This script serves as a comprehensive momentum-based trading framework, leveraging acceleration metrics and multiple moving average filters to identify potential shifts in market direction. By combining overbought/oversold checks with threshold-based triggers, it aims to reduce the noise that commonly plagues purely reactive indicators. The flexibility of Smart Pyramiding, customizable color schemes, and built-in alerts allows users to tailor their experience and respond swiftly to valid signals, potentially enhancing trading decisions across various market conditions.
Disclaimer
All trading involves significant risk, and users should apply their own judgment, risk management, and broader analysis before making investment decisions.

Best MA Pair Finder (Crossover Strategy)This indicator automatically identifies the optimal pair of moving averages (MAs) for a crossover strategy using all available historical data. It offers several MA options—including SMA, EMA, and TEMA—allowing users to select the desired type in the settings. The indicator supports two strategy modes: “Long Only” and “Buy & Sell”, which can be chosen via the options.
For each MA pair combination, the indicator performs a backtest and calculates the profit factor, considering only those pairs where the total number of trades meets or exceeds the user-defined "Minimum Trades" threshold. This parameter ensures that the selected optimal pair is based on a statistically meaningful sample rather than on a limited number of trades.
The results provided by this indicator are based on historical data and backtests, which may not guarantee future performance. Users should conduct their own analysis and use proper risk management before making trading decisions.

ROC + SMI Auto Adjust
This indicator combines the Rate of Change (ROC) and the Stochastic Momentum Index (SMI) with automatically adjusted parameters for different time frames (short, medium, long). It normalizes the ROC to match the SMI levels, displays the ROC as a histogram and the SMI as lines, highlights overbought/oversold zones and includes a settings table. Ideal for analyzing momentum on different time frames.
Key Features:
Automatic Parameter Adjustment:
The script detects the current chart time frame (e.g. 1-minute, 1-hour, daily) and adjusts the parameters for the ROC and SMI accordingly.
Parameters such as ROC length, SMI length and smoothing periods are optimized for short, medium and long term time frames.
Rate of Change (ROC):
ROC measures the percentage change in price over a specified period.
The script normalizes the ROC values to match the SMI range, making it easier to compare the two indicators on the same scale.
The ROC is displayed as a histogram, where positive values are colored green and negative values are colored red.
Stochastic Momentum Index (SMI):
SMI is a momentum oscillator that identifies overbought and oversold conditions.
The script calculates the SMI and its signal line, plotting them on the chart.
Overbought and oversold levels are displayed as dotted lines for convenience.
SMI and SMI Signal Crossover:
When the main SMI crosses the signal line from below upwards, it may be a buy signal (bullish signal).
When the SMI crosses the signal line from above downwards, it may be a sell signal (bearish signal).
Configurable Inputs:
Users can use the automatically adjusted settings or manually override the parameters (e.g. ROC length, SMI length, smoothing periods).
Overbought and oversold levels for SMI are also configurable.
Parameter Table:
A table is displayed on the chart showing the current parameters (e.g. timeframe, ROC length, SMI length) for transparency and debugging.
The position of the table is configurable (e.g. top left, bottom right).
How it works:
The script first detects the chart timeframe and classifies it as short-term (e.g. 1M, 5M), medium-term (e.g. 1H, 4H) or long-term (e.g. D1, W1).
Based on the timeframe, it sets default values for the ROC and SMI parameters.
ROC and SMI are calculated and normalized so that they can be compared on the same scale.
ROC is displayed as a histogram, while SMI and its signal line are displayed as lines.
Overbought and oversold levels are displayed as horizontal lines.
Use cases:
Trend identification: ROC helps to identify the strength of the trend, while SMI indicates overbought/oversold conditions.
Momentum analysis: The combination of ROC and SMI provides insight into both price momentum and potential reversals.
Time frame flexibility: The auto-adjustment feature makes the script suitable for scalping (short-term), swing trading (medium-term) and long-term investing.

Volume Flow Indicator Signals | iSolani
Volume Flow Indicator Signals | iSolani: Decoding Trend Momentum with Volume Precision
In markets where trends are fueled by institutional participation, discerning genuine momentum from false moves is critical. The Volume Flow Indicator Signals | iSolani cuts through this noise by synthesizing price action with volume dynamics, generating high-confidence signals when capital flows align with directional bias. This tool reimagines traditional volume analysis by incorporating volatility-adjusted thresholds and dual-layer smoothing, offering traders a laser-focused approach to trend identification.
Core Methodology
The indicator employs a multi-stage calculation to quantify volume-driven momentum:
Volatility-Adjusted Filter: Measures price changes via log returns, scaling significance using a 30-bar standard deviation multiplied by user-defined sensitivity (default: 2x).
Volume Normalization: Caps extreme volume spikes at 3x the 50-bar moving average, preventing distortion from anomalous trades.
Directional Volume Flow: Assigns positive/negative values to volume based on whether price movement exceeds volatility-derived thresholds.
Dual Smoothing: Applies consecutive SMA (3-bar) and EMA (14-bar) to create the Volume Flow Indicator (VFI) and its signal line, filtering out transient fluctuations.
Breaking New Ground
This implementation introduces three key innovations:
Adaptive Noise Gates: Unlike static volume oscillators, the sensitivity coefficient dynamically adjusts to market volatility, reducing false signals during choppy conditions.
Institutional Volume Capping: The vcoef parameter limits the influence of outlier volume spikes, focusing on sustained institutional activity rather than one-off trades.
Non-Repainting Signals: Generates single-per-trend labels (buy below bars, sell above) to avoid chart clutter while maintaining visual clarity.
Engine Under the Hood
The script executes through five systematic stages:
Data Preparation: Computes HLC3 typical price and its logarithmic rate of change.
Threshold Calculation: Derives dynamic cutoff levels using 30-period volatility scaled by user sensitivity.
Volume Processing: Filters raw volume through a 50-bar SMA, capping extremes at 3x average.
VFI Construction: Sums directional volume flow over 50 bars, smoothed with a 3-bar SMA.
Signal Generation: Triggers alerts when VFI crosses zero, confirmed by a 14-bar EMA crossover.
Standard Configuration
Optimized defaults balance responsiveness and reliability:
Volume MA: 50-bar smoothing window
Sensitivity: 2.0 (doubles volatility threshold)
Signal Smoothing: 14-bar EMA
Volume Cap: 3x average (hidden parameter)
VFI Smoothing: Enabled (3-bar SMA)
By fusing adaptive volume filtering with price confirmation logic, the Volume Flow Indicator Signals | iSolani transforms raw market data into institutional-grade trend signals. Its ability to mute choppy price action while amplifying high-conviction volume moves makes it particularly effective for spotting early trend reversals in equities, forex, and futures markets.

RSI Signal Pro[UgurTash]Introducing RSI Signal Pro for TradingView
RSI Signal Pro is a refined version of the standard Relative Strength Index (RSI) , designed to improve signal accuracy by generating alerts in real-time instead of waiting for multiple candle confirmations. This enhancement allows traders to react faster to market movements while maintaining the familiar RSI structure.
What Makes RSI Signal Pro Unique?
✅ Real-Time RSI Signals: Unlike the traditional RSI, which waits for candle confirmations, this version provides immediate buy and sell signals upon key level crossovers.
✅ Dual Trading Modes: Choose between Simple Mode (standard RSI crossovers) and Advanced Mode (momentum-adjusted signals with price validation).
✅ Customizable RSI-Based Moving Average (MA): Optionally apply SMA, EMA, WMA, or VWMA to smooth RSI fluctuations and identify longer-term trends.
✅ Adaptive Signal Filtering: The Advanced Mode reduces false signals by filtering RSI movements with a momentum threshold and historical RSI validation.
✅ User-Friendly Interface: Simple ON/OFF toggles allow easy customization of the indicator's behavior.
How This Indicator Works
🔹 Simple Mode: Identical to traditional RSI, triggering signals when RSI crosses 30 (bullish) or 70 (bearish).
🔹 Advanced Mode: Uses historical RSI pivots, momentum verification, and price confirmation to refine signal accuracy—ideal for traders looking for more precise entries.
🔹 RSI-Based MA: Optionally overlay moving averages onto the RSI, providing additional trend confirmation.
How to Use RSI Signal Pro
1️⃣ Select a mode: Use Simple Mode for frequent alerts or Advanced Mode for refined signals.
2️⃣ Enable RSI-Based MA: Apply SMA, EMA, WMA, or VWMA to smooth RSI fluctuations.
3️⃣ Set alerts: TradingView notifications allow you to react to real-time RSI movements instantly.
4️⃣ Apply to multiple markets: Effective for crypto, forex, stocks, and commodities.
Why Use RSI Signal Pro Instead of Standard RSI?
While RSI Signal Pro maintains the core functionality of the standard RSI, its real-time signal generation allows traders to make faster decisions without the typical delay caused by waiting for candle confirmations. Additionally, the optional momentum filtering and moving average smoothing ensure fewer false signals and better trade accuracy.

Sma Indicator with Ratio (pr)SMA Indicator with Ratio (PR) is a technical analysis tool designed to provide insights into the relationship between multiple Simple Moving Averages (SMAs) across different time frames. This indicator combines three key SMAs: the 111-period SMA, 730-period SMA, and 1400-period SMA. Additionally, it introduces a ratio-based approach, where the 730-period SMA is multiplied by factors of 2, 3, 4, and 5, allowing users to analyze potential market trends and price movements in relation to different SMA levels.
What Does This Indicator Do?
The primary function of this indicator is to track the movement of prices in relation to several SMAs with varying periods. By visualizing these SMAs, users can quickly identify:
Short-term trends (111-period SMA)
Medium-term trends (730-period SMA)
Long-term trends (1400-period SMA)
Additionally, the multiplied versions of the 730-period SMA provide deeper insights into potential price reactions at different levels of market volatility.
How Does It Work?
The 111-period SMA tracks the shorter-term price trend and can be used for identifying quick market movements.
The 730-period SMA represents a longer-term trend, helping users gauge overall market sentiment and direction.
The 1400-period SMA acts as a very long-term trend line, giving users a broad perspective on the market’s movement.
The ratio-based SMAs (2x, 3x, 4x, 5x of the 730-period SMA) allow for an enhanced understanding of how the price reacts to higher or lower volatility levels. These ratios are useful for identifying key support and resistance zones in a dynamic market environment.
Why Use This Indicator?
This indicator is useful for traders and analysts who want to track the interaction of price with different moving averages, enabling them to make more informed decisions about potential trend reversals or continuations. The added ratio-based values enhance the ability to predict how the market might react at different levels.
How to Use It?
Trend Confirmation: Traders can use the indicator to confirm the direction of the market. If the price is above the 111, 730, or 1400-period SMA, it may indicate an uptrend, and if below, a downtrend.
Support/Resistance Levels: The multiplied versions of the 730-period SMA (2x, 3x, 4x, 5x) can be used as dynamic support or resistance levels. When the price approaches or crosses these levels, it might indicate a change in the trend.
Volatility Insights: By observing how the price behaves relative to these SMAs, traders can gauge market volatility. Higher multiples of the 730-period SMA can signal more volatile periods where price movements are more pronounced.

Smooth Moving Average (SMA) MTF Trend PanelDescription:
The SMA MTF Trend Panel is a multi-timeframe (MTF) trend visualization tool designed to help traders quickly assess market conditions across multiple timeframes based on the Simple Moving Average (SMA). This script calculates the trend direction (Bullish, Bearish, or Neutral) and the trend strength percentage for each selected timeframe. It displays the information in an intuitive panel that is dynamically updated in real-time.
How It Works:
1. SMA Calculation:
• For each timeframe, the script calculates the SMA based on a user-defined length (default: 50).
2. Trend Identification:
• Compares the current price to the SMA and assigns a label: “Bull,” “Bear,” or “Neutral.”
3. Panel Display:
• Displays trends, strengths, and shifts for each timeframe in an interactive table.
4. Real-Time Updates:
• Continuously monitors price movements and updates the panel to reflect the latest data.
Customizable Inputs:
1. Panel Settings:
• Orientation: Choose vertical or horizontal layout.
• Position: Select panel location on the chart.
• Border Width/Color: Adjust panel borders for better visualization.
2. Trend Colors:
• Define custom colors for bullish, bearish, neutral, and shift conditions.
3. SMA Length:
• Adjust the SMA period to suit your trading style (e.g., short-term scalping or long-term trend following).
4. Timeframes:
• Set specific timeframes to analyze based on your trading strategy.

BK Multiple MA, RMA, SMA, HMA, VWAP, Rolling VWAP **Indicator Description**
I’m incredibly proud to introduce my third indicator to the TradingView community: **BK Multiple MA with HMA, VWAP, and Rolling VWAP**! This tool has been a game-changer in my trading strategy, and I’m excited to share it with others who are navigating the markets.
This indicator holds a special place in my heart because it represents the first technical analysis concept introduced to me by my mentor when I began apprenticing under him. His wisdom, guidance, and passion for trading—and for life—left an indelible mark on my journey. I dedicate this work, and every indicator I introduce, to the foundation he helped me build, while giving glory first and foremost to God.
**Moving Averages (MAs)** are one of the most widely used tools in technical analysis, and this indicator takes them to the next level. It allows you to plot **six fully customizable moving averages simultaneously**, with options including:
- **Exponential Moving Average (EMA)**
- **Simple Moving Average (SMA)**
- **Relative Moving Average (RMA)**
- **Hull Moving Average (HMA)**
- **Volume Weighted Average Price (VWAP)**
- **Rolling VWAP**
This flexibility makes the indicator highly versatile, whether you’re a day trader, swing trader, or long-term investor. By customizing periods, colors, and line widths for each MA, you can tailor the indicator to perfectly suit your trading style.
**Key Features**
1. **Six Fully Customizable MAs**:
- Adjust periods, line colors, and widths to match your preferences.
- Select from EMA, SMA, RMA, HMA, VWAP, or Rolling VWAP for each line.
2. **Unique Rolling VWAP Option**:
- Rolling VWAP calculates the volume-weighted average price over a user-defined period, such as 200 candles.
- This feature is ideal for traders seeking volume-weighted levels that don’t reset with each session, making it invaluable for trend-following and swing trading.
3. **HMA for Smoother Trends**:
- The Hull Moving Average (HMA) is designed to reduce lag and provide a responsive, noise-free view of price trends.
- It’s a powerful tool for spotting reversals and confirming directional momentum.
4. **Session VWAP**:
- Traditional VWAP resets with each trading session, making it a reliable benchmark for intraday support and resistance levels.
**How It Works**
- **VWAP**: Reflects the average price weighted by volume for the current trading session, commonly used by institutional traders to identify key price levels.
- **Rolling VWAP**: Extends VWAP functionality by calculating over a user-defined period, allowing for flexible multi-timeframe analysis.
- **HMA**: A fast, smooth moving average that reacts quickly to price changes while filtering out noise.
The combination of these options provides traders with a comprehensive view of market dynamics, enabling better decision-making.
**Final Thoughts**
This indicator is deeply meaningful to me because it represents the first concept my mentor introduced when I began apprenticing under him. His wisdom, guidance, and passion for trading—and for life—left an indelible mark on my journey. I dedicate this work, and every indicator I introduce, to the foundation he helped me build, while giving glory first and foremost to God.
If this indicator helps you succeed, I humbly ask that you honor the blessings in your life by giving back—whether through acts of kindness, philanthropy, or helping others in need.
May the Almighty guide us all toward wisdom and success in our endeavors. All glory belongs to God!

EMA/SMA + Multi-Timeframe Dashboard (Vertical)20/50 ema and 200 sma
The EMA SMA Trading Indicator combines the power of Exponential Moving Averages (EMA) and Simple Moving Averages (SMA) to help traders identify trends, reversals, and key entry/exit points.
Features:
Dual Moving Averages: Tracks both EMA and SMA to provide a balanced view of short-term and long-term market trends.
Customizable Periods: Allows users to set unique periods for EMA and SMA to suit their trading style and timeframe (e.g., day trading, swing trading, or investing).
Cross Alerts: Highlights EMA and SMA crossover points, which often indicate potential buy or sell signals.
Color-Coded Lines: Visual differentiation between EMA (dynamic and responsive) and SMA (smooth and lagging) for better readability.
Multi-Timeframe Compatibility: Suitable for scalping, intraday trading, and long-term analysis.
Usage:
Trend Confirmation: When the EMA is above the SMA, it signals a bullish trend; when it is below the SMA, it signals a bearish trend.
Crossover Strategy: Use crossovers as potential buy (EMA crosses above SMA) or sell (EMA crosses below SMA) signals.
Dynamic Support/Resistance: EMA can act as short-term support/resistance, while SMA represents long-term levels.
This indicator is perfect for traders who want to combine EMA's speed with SMA's stability for improved decision-making in volatile markets. Customizable alerts and visual cues make it user-friendly for beginners and experienced traders.
Make informed decisions and take your trading to the next level with the EMA SMA Trading Indicator!

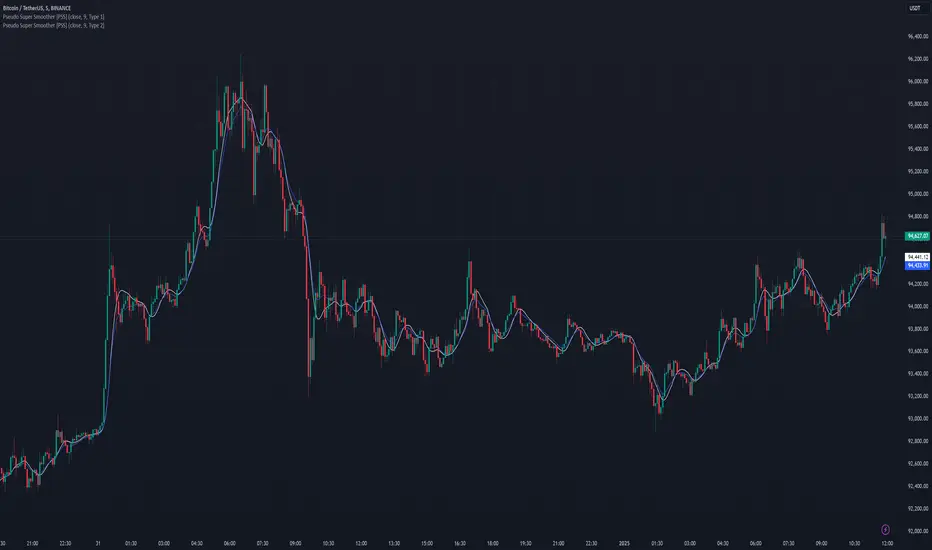
Pseudo Super Smoother [PSS]The Pseudo Super Smoother (PSS) is a a Finite Impulse Response (FIR) filter. It provides a smoothed representation of the underlying data. This indicator can be considered a variation of a moving average, offering a unique approach to filtering price or other data series.
The PSS is inspired by the Super Smoother filter, known for its ability to reduce noise while maintaining a relatively low delay. However, the Super Smoother is an Infinite Impulse Response (IIR) filter. The PSS attempts to approximate some characteristics of the Super Smoother using an FIR design, which offers inherent stability.
The indicator offers two distinct filter types, selectable via the "Filter Style" input: Type 1 and Type 2 . Type 1 provides a smoother output with a more gradual response to changes in the input data. It is characterized by a greater attenuation of high-frequency components. Type 2 exhibits increased reactivity compared to Type 1 , allowing for a faster response to shifts in the underlying data trend, albeit with a potential overshoot. The choice between these two types will depend on the specific application and the preference for responsiveness versus smoothness.
The PSS calculates the FIR filter coefficients based on a decaying exponential function, adjusted according to the selected filter type and the user-defined period. The filter then applies these coefficients to a window of past data, effectively creating a weighted average that emphasizes more recent data points to varying degrees. The PSS uses a specific initialization technique that uses the first non-null data point to pre-fill the input window, which helps it start right away.
The PSS is an approximation of the Super Smoother filter using an FIR design. While it try's to emulate some of the Super Smoother's smoothing characteristics, users should be aware that the frequency response and overall behavior will differ due to it being a rough approximation. The PSS should be considered an experimental indicator and used in conjunction with other analysis techniques. This is, effectively, just another moving average, but its novelty lies in its attempt to bridge the gap between FIR and IIR filter designs for a specific smoothing goal.
MFS-3 Bars Pattern Strategy3 Bar Pattern Strategy
Detects an Ignite Candle followed by a Pullback Candle followed by a Confirmation Candle.
A Box will be drawn around the setup and three arrows will identify I, P, C (Ignite, Pullback, Confirmation) the setup.
The strategy will calculate a Stop Loss below the Low Price of the Ignite candle and a Take Profit at 2 times the Stop Loss giving a Risk to Reward Ratio of 1:2.
Extra conditions are included to reduce false triggers:
- A down trend must be detected using 3 SMA (Long, Medium, Short) that should be aligned from Long to Short one above the other.
- The Ignite Candle's body must be BELOW the Short SMA
An input form is available to adjust some strategy parameters.
Performance Note
----------------------
Trading conditions are very strict, so most of the time, no signals will be detected in the Strategy window.
This strategy should only be one of many strategies used for trade setups.
Hope you enjoy it.

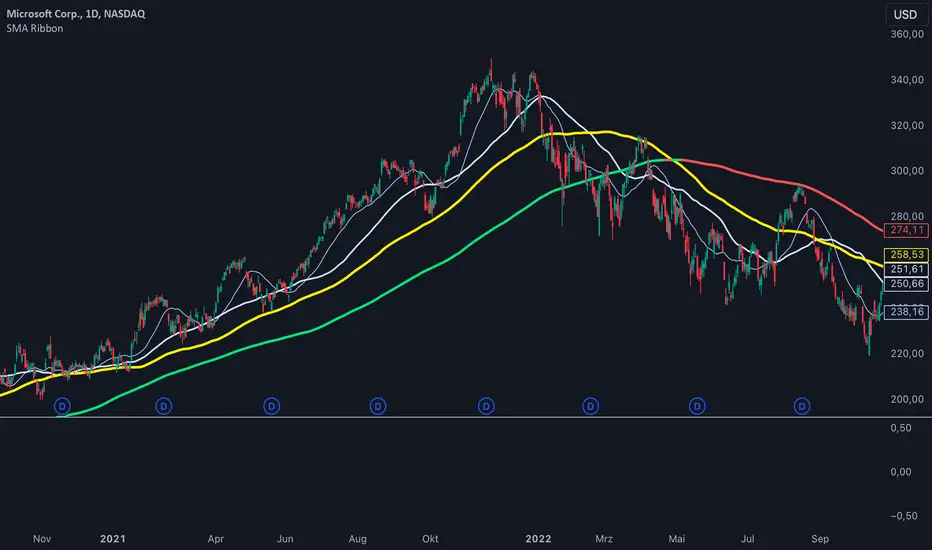
SMA Ribbon [A]SMA Ribbon with Adjustable MA200
20, 50, 100, and 200 -period Simple Moving Averages (SMAs) for trend analysis.
The SMA200 dynamically changes color based on its direction—green when rising and red when falling. Additionally, you can lock the SMA200 to the daily timeframe , allowing it to display the 200-day moving average on lower timeframes, such as 4-hour or 1-hour charts.
Features:
Dynamic SMA200 Color: Automatically adjusts to show upward (green) or downward (red) trends.
Daily SMA200 Option: Enables the SMA200 to represent the 200-day moving average on intraday charts for long-term trend insights.
Smart Adaptation: The daily SMA200 setting is automatically disabled on daily or higher timeframes, ensuring accurate period calculations.
How to Use:
Use this script to identify key support/resistance levels and overall market trends.
Adjust the "Daily MA for MA200" option in the settings to toggle between timeframe-specific and daily-locked SMA200.
This script is ideal for traders seeking a clean and customizable tool for long-term and short-term trend analysis.
2-Year MA Multiplier [UAlgo]The 2-Year MA Multiplier is a technical analysis tool designed to assist traders and investors in identifying potential overbought and oversold conditions in the market. By plotting the 2-year moving average (MA) of an asset's closing price alongside an upper band set at five times this moving average, the indicator provides visual cues to assess long-term price trends and significant market movements.
🔶 Key Features
2-Year Moving Average (MA): Calculates the simple moving average of the asset's closing price over a 730-day period, representing approximately two years.
Visual Indicators: Plots the 2-year MA in forest green and the upper band in firebrick red for clear differentiation.
Fills the area between the 2-year MA and the upper band to highlight the normal trading range.
Uses color-coded fills to indicate overbought (tomato red) and oversold (cornflower blue) conditions based on the asset's closing price relative to the bands.
🔶 Idea
The concept behind the 2-Year MA Multiplier is rooted in the cyclical nature of markets, particularly in assets like Bitcoin. By analyzing long-term price movements, the indicator aims to identify periods of significant deviation from the norm, which may signal potential buying or selling opportunities.
2-year MA smooths out short-term volatility, providing a clearer view of the asset's long-term trend. This timeframe is substantial enough to capture major market cycles, making it a reliable baseline for analysis.
Multiplying the 2-year MA by five establishes an upper boundary that has historically correlated with market tops. When the asset's price exceeds this upper band, it may indicate overbought conditions, suggesting a potential for price correction. Conversely, when the price falls below the 2-year MA, it may signal oversold conditions, presenting potential buying opportunities.
🔶 Disclaimer
Use with Caution: This indicator is provided for educational and informational purposes only and should not be considered as financial advice. Users should exercise caution and perform their own analysis before making trading decisions based on the indicator's signals.
Not Financial Advice: The information provided by this indicator does not constitute financial advice, and the creator (UAlgo) shall not be held responsible for any trading losses incurred as a result of using this indicator.
Backtesting Recommended: Traders are encouraged to backtest the indicator thoroughly on historical data before using it in live trading to assess its performance and suitability for their trading strategies.
Risk Management: Trading involves inherent risks, and users should implement proper risk management strategies, including but not limited to stop-loss orders and position sizing, to mitigate potential losses.
No Guarantees: The accuracy and reliability of the indicator's signals cannot be guaranteed, as they are based on historical price data and past performance may not be indicative of future results.
