Bitcoin Premium [SAKANE]Overview
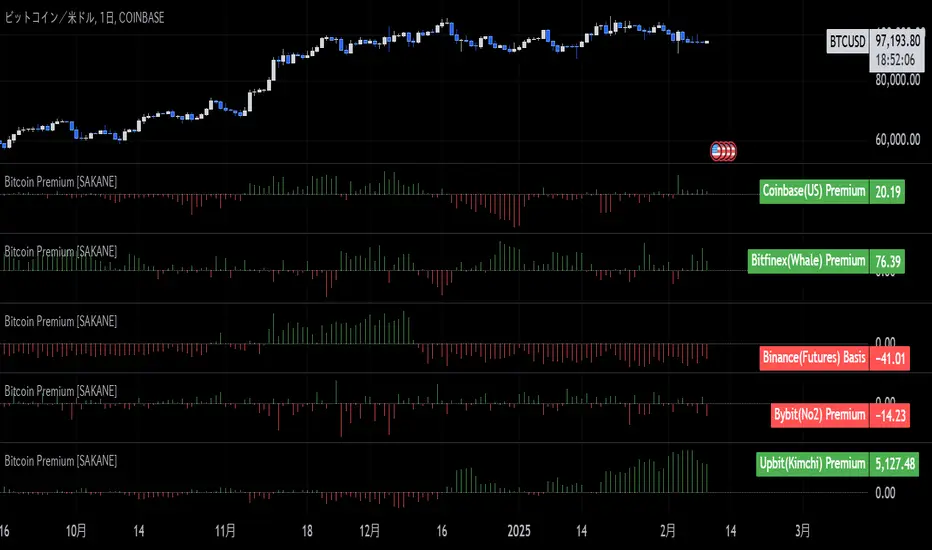
"Bitcoin Premium " is an indicator designed to analyze the price differences (premiums) of Bitcoin between major exchanges. By using this tool, you can visualize these differences and trends across exchanges, helping you make more informed trading decisions.
Features
1. Premium Calculation and Display
- Calculates and visualizes the price differences between major exchanges like Coinbase, Bitfinex, Upbit, and Binance.
- Premiums are displayed in a histogram format for intuitive analysis.
2. Forex Rate Adjustment
- Prices quoted in KRW (e.g., from Upbit) are converted to USD using real-time KRW/USD forex rates.
3. Moving Average Option
- Displays moving averages (SMA or EMA) of premiums for a clearer view of long-term trends.
4. Customizable Settings
- Toggle the premium display for each exchange on or off.
- Includes label displays to support visual analysis.
What Can It Do for You?
1. Identify Arbitrage Opportunities
By observing price differences (premiums) between exchanges, you can identify arbitrage opportunities.
Example: If Bitcoin is cheaper on Binance and more expensive on Coinbase, you could buy on Binance and sell on Coinbase to capture the price difference.
2. Understand Regional Supply and Demand Trends
Each exchange's premium reflects the supply and demand dynamics of its respective region.
Example: A high premium on Upbit may indicate excess demand or regulatory impacts in the South Korean market.
3. Analyze Liquidity
Price differences often highlight liquidity disparities between exchanges. Markets with lower trading volumes tend to have larger premiums due to price distortions.
4. Evaluate Macroeconomic Impacts
Premium movements may reflect changes in macroeconomic factors, such as exchange rates, regulations, or financial conditions specific to each region.
5. Analyze Trends and Market Sentiment
By tracking premium trends, you can gauge market sentiment and understand regional or exchange-specific behaviors to inform your investment decisions.
6. Support Strategic Trading
This tool is useful for short-term arbitrage strategies as well as long-term evaluations of market health.
Exchange Characteristics and Premium Implications
The meaning of premiums varies by exchange.
- Coinbase (US Market)
Primarily used by investors buying directly with fiat currency (USD). A higher premium often signals bullish sentiment among institutional and retail investors.
- Bitfinex (Global Market)
A trader-focused exchange with active large-scale and leveraged trading. Premiums may reflect liquidity and risk appetite.
- Upbit (South Korean Market)
Priced in KRW, making it subject to forex rates and local market dynamics. High premiums may indicate strong demand or regulatory influences in South Korea.
- Binance (Global Market)
The largest exchange by trading volume. Premiums here are often a reflection of the overall market balance.
Notes
- This indicator is for reference only and does not guarantee trading decisions.
- Please consider the characteristics and conditions of each exchange when using this tool.
Sentiment
ATR Oscillator with Dots and Dynamic Zero LineWhat It Is
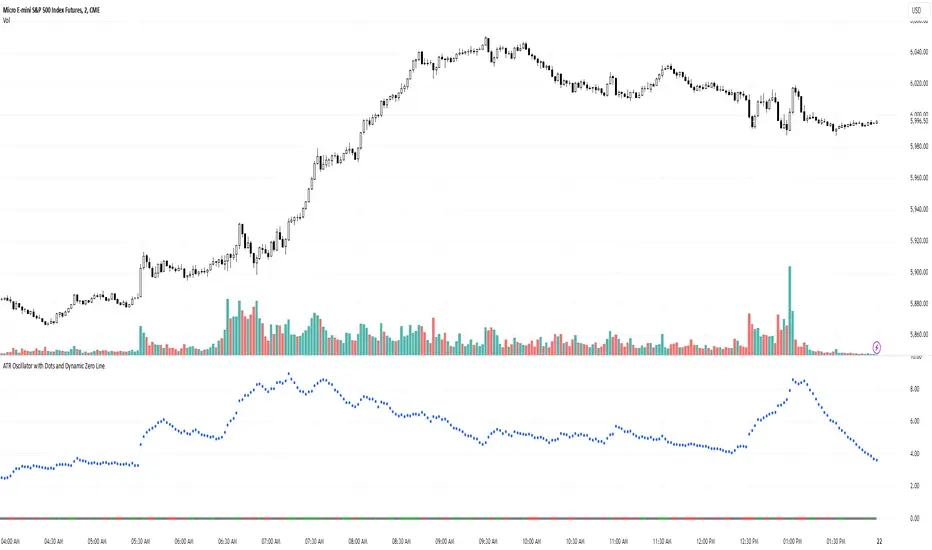
The ATR Oscillator with Dots and Dynamic Zero Line is a custom indicator based on the Average True Range (ATR), designed to provide traders with enhanced insights into market volatility and directional bias. Unlike traditional ATR oscillators that plot continuous lines, this version uses distinct dots to display ATR values and includes a dynamic zero line that changes color based on market direction (uptrend, downtrend, or consolidation).
How It Works
ATR Calculation:
The indicator calculates the Average True Range over a user-defined period (default: 14 bars). ATR measures market volatility by considering the range between the high, low, and close of each bar.
Dots for ATR Values:
Instead of plotting ATR values as a continuous line, the indicator represents each value as an individual blue dot. This format highlights changes in volatility without visually connecting them, helping to avoid false trends and clutter.
Dynamic Zero Line:
A horizontal zero line provides additional directional context. The line changes color dynamically:
Green: Indicates an uptrend (price is consistently closing higher over consecutive bars).
Red: Indicates a downtrend (price is consistently closing lower over consecutive bars).
Gray: Indicates market consolidation or sideways movement (no clear trend in price).
The thickness and step-like style of the zero line make it visually prominent, enabling quick interpretation of market direction.
What It Does
Visualizes Market Volatility:
By plotting ATR values as dots, the oscillator emphasizes periods of heightened or reduced market activity, helping traders anticipate breakout opportunities or avoid low-volatility zones.
Provides Trend Context:
The dynamic zero line gives traders a clear signal of the prevailing market trend (uptrend, downtrend, or consolidation), which can be used to align trading strategies with the broader market context.
Avoids Misleading Trends:
Unlike traditional ATR oscillators that use continuous lines, this version eliminates visual artifacts caused by noise, such as false trends during consolidation periods.
Simplifies Interpretation:
The combination of ATR dots and a color-coded zero line creates a straightforward and intuitive tool for assessing both volatility and market direction.
Why It’s More Useful Than a Traditional ATR Oscillator
Enhanced Visibility:
The use of dots instead of a continuous line makes it easier to spot discrete changes in ATR values, avoiding visual clutter and false impressions of smooth trends.
Dynamic Market Context:
Traditional ATR oscillators only measure volatility, offering no indication of market direction. The dynamic zero line in this oscillator adds valuable directional context, helping traders align their strategies with the trend.
Better for Range-Bound Markets:
The zero line’s color-changing feature highlights consolidation periods, enabling traders to identify and avoid trading during sideways, low-volatility conditions where false signals are common.
Quick Decision-Making:
With clear visual cues (dots and color-coded lines), traders can quickly assess market conditions without needing to analyze multiple charts or indicators.
Improved Confluence:
The oscillator’s signals can easily be combined with other tools like VWAP, Volume Profile, or Order Flow indicators for more confident trade decisions.
When to Use It
Trending Markets:
Use the dynamic zero line to confirm the market’s direction and align trades accordingly.
Breakout Opportunities:
Look for periods of increasing ATR (dots moving higher) to anticipate high-volatility breakout scenarios.
Avoiding Noise:
During consolidation (gray zero line), this oscillator warns traders to wait for clearer signals before entering trades.
Support and Resistance Non-Repainting [AlgoAlpha]Elevate your technical analysis with the Non-Repainting Support and Resistance indicator from AlgoAlpha. Designed for traders who value precision, this tool highlights key support and resistance zones without repainting, ensuring reliable signals for better market decisions.
Key Features
🔍 Concise Zones: Identifies critical levels in real-time without repainting.
🖍 Customizable Appearance: Choose your preferred colors for bullish and bearish zones.
📏 Pivot Sensitivity Settings: Adjust the lookback period to fit different market conditions.
🔔 Visual Alerts: Highlights zones on your chart with clear, dynamic boxes and lines.
How to Use
Add the Indicator : Add it to your favorites chart by clicking the star icon. Adjust the lookback period, max zone duration, and colors to match your strategy.
Analyze the Chart : Look for zones where prices frequently react, indicating strong support or resistance.
Set Alerts : Enable notifications for new zone formations and zone invalidations, ensuring you never miss critical market moves.
How It Works
The indicator detects pivot highs and lows using a specified lookback period. When a pivot is confirmed, it draws corresponding support or resistance zones using TradingView’s built-in drawing tools. These zones extend until price breaks through them or they expire based on a maximum allowed duration. The indicator continuously checks if price interacts with any active zones and adjusts accordingly, ensuring accurate and real-time visualization.

VIX OscillatorOVERVIEW
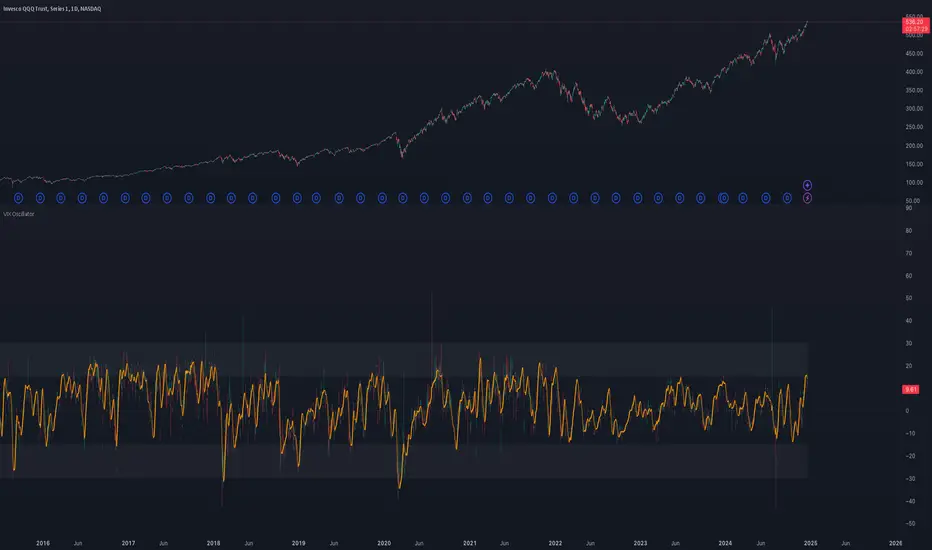
Plots an oscillating value as a percentage, derived from the VIX and VIX3M . This can help identify broader market trends and pivots on higher time frames (ie. 1D), useful when making swing trades.
DATA & MATH
The VIX is a real-time index of expected S&P 500 volatility over the next 30 days, derived from option prices with near-term expirations. Similarly, the VIX3M measures expected volatility over the next 90 days.
Dividing one by the other yields an oscillating value, normalizing the relative strength of the expected volatility. Most commonly the VIX is divided by the VIX3M. However, because the VIX is inversely correlated to market sentiment (typically), this indicator divides the VIX3M by the VIX to visually correlate the plot direction with the anticipated market direction. Further, it subtracts 1.1 from the quotient to visually center the plot, and multiplies that difference by 100 to amplify the value as a percentage:
( VIX3M / VIX - 1.1 ) * 100
This variation makes identifying sentiment extremes easier within a buy-low-sell-high paradigm, where values below zero are bearish and values above zero are bullish.
PLOTS
Two plots are used, maximizing data fidelity and convenience. Candles are used to accurately reflect the quantized math and a Linear Regression is used to simplify contextualization. If you're not familiar with what a Linear Regression is, you can think of it like a better moving average. High / Low zones are also plotted to help identify sentiment extremes.
This combination allows you to quickly identify the expected sentiment (bullish / bearish) and its relative value (normal / extreme), which you can then use to anticipate if a trend continuation or pivot is more likely.
INPUTS
Candle colors (rise and fall)
Linear regression colors and length
Zone thresholds and zero line
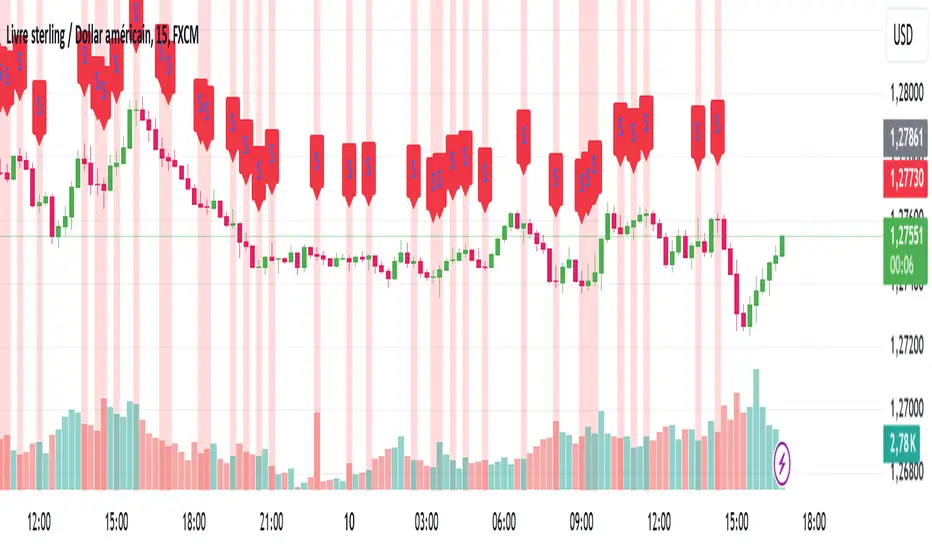
Sell Signal - William O'Neil's Rule VisualizationThis indicator might be helpful for traders looking to visualize William O’Neil’s sell condition, a well-known concept in his trading strategies. A sell signal is triggered when:
1. Volume increases compared to the previous day.
2. The price drops by a user-defined percentage (default: 0.2% or more).
The indicator highlights the background for bars meeting these conditions and adds a subtle circle above them. You can adjust the drop rate in the settings to match your preferences.
It could serve as a useful tool for identifying potential distribution days or profit-taking signals, helping traders manage risk during market pullbacks.
このインジケーターは、ウィリアム・オニールの売り抜け条件を可視化したもので、トレーダーの皆さんに役立つかもしれません。シグナルは次の条件を満たすと発生します:
1. 出来高が前日より増加している。
2. 価格がユーザー指定の割合(デフォルトは0.2%以上)で下落している。
条件を満たしたバーには背景色が付き、控えめな丸印が表示されます。設定で下落率を自由に調整することもできます。
このツールは、分配日や利益確定のシグナルを特定するのに役立つかもしれません。市場の調整局面でのリスク管理にご活用ください。

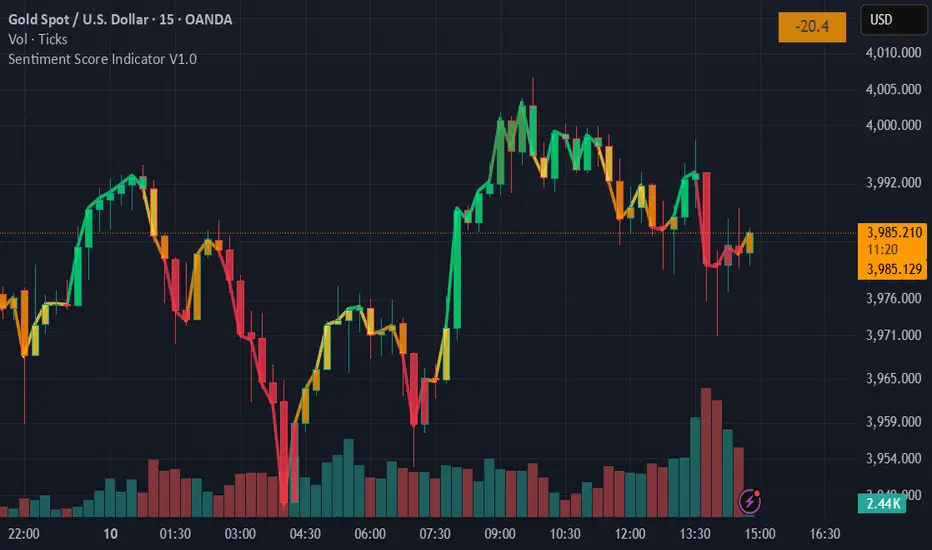
Sentiment Score Indicator V1.1Sentiment Score Indicator
The Sentiment Score Indicator attempts to gauge market sentiment by analyzing price action relative to Bollinger Bands and multiple Simple Moving Averages (SMAs). The indicator dynamically calculates a sentiment score ranging from -100 (Strong Bearish) to +100 (Strong Bullish) to provide insight into potential market direction and strength.
How the Sentiment Score is Calculated
The sentiment score is derived through a multi-step process that evaluates market conditions:
Bollinger Bands Analysis:
The script assesses the price’s position relative to the upper and lower Bollinger Bands.
When the price approaches or exceeds the upper band, it indicates potential overbought conditions and contributes to a bullish sentiment score.
Conversely, when the price nears or falls below the lower band, it signals potentially oversold conditions, contributing to a bearish sentiment score.
The magnitude of deviation from these bands influences the score, making it sensitive to volatility.
Moving Averages Evaluation:
The script incorporates multiple hardcoded SMAs to identify trends.
If the price is above these SMAs, the score is adjusted upward to reflect more bullish momentum.
If the price is below these SMAs, the score decreases to reflect more bearish momentum.
Each SMA provides a different perspective on short-term and long-term trends and are used in conjunction with determining the overall score at any given time.
Adaptive Scaling:
A scaling factor adjusts the sensitivity of the sentiment score based on market conditions.
This ensures the indicator remains responsive in both high-volatility and low-volatility environments.
Key Features
Dynamic Sentiment Score : Real-time sentiment ranging from Strong Bullish to Strong Bearish.
Combines Bollinger Bands and SMAs to assess overbought/oversold conditions and trend strength.
Color-Coded Labels: Intuitive color coding for quick interpretation of sentiment.
Works effectively on multiple time frames, including monthly, weekly, daily, intraday, and even down to 1-second chart data.
Toggle Option: Users can choose to display the sentiment score only on the last candle to reduce chart clutter.
Sentiment Score Ranges
Score Range Sentiment Color
+75 to +100 Strong Bullish Dark Green 🟩
+50 to +75 Bullish Green 🟩
+25 to +50 Medium Bullish Light Green 🟩
+10 to +25 Slightly Bullish Yellow-Green 🟨
-10 to +10 Neutral Yellow 🟨
-25 to -11 Slightly Bearish Orange-Yellow 🟧
-50 to -26 Medium Bearish Orange 🟧
-75 to -51 Bearish Dark Orange 🟥
-100 to -76 Strong Bearish Dark Red 🟥
How to Use
Add the Indicator to your preferred candlestick chart.
Interpret the Sentiment Labels displayed above or below each candlestick (you can toggle to only show the label on the last candle or all candles), this will be a numerical value accompanied by the range description (as per the above Sentiment Score Ranges).
Use the Color-Coded Scores to quickly gauge sentiment strength and direction.
Combine with Other Tools: For better analysis, use this indicator alongside other forms of technical analysis.
Disclaimer
This tool is for educational purposes only and does not constitute financial advice. Always conduct your own research and practice proper risk management.
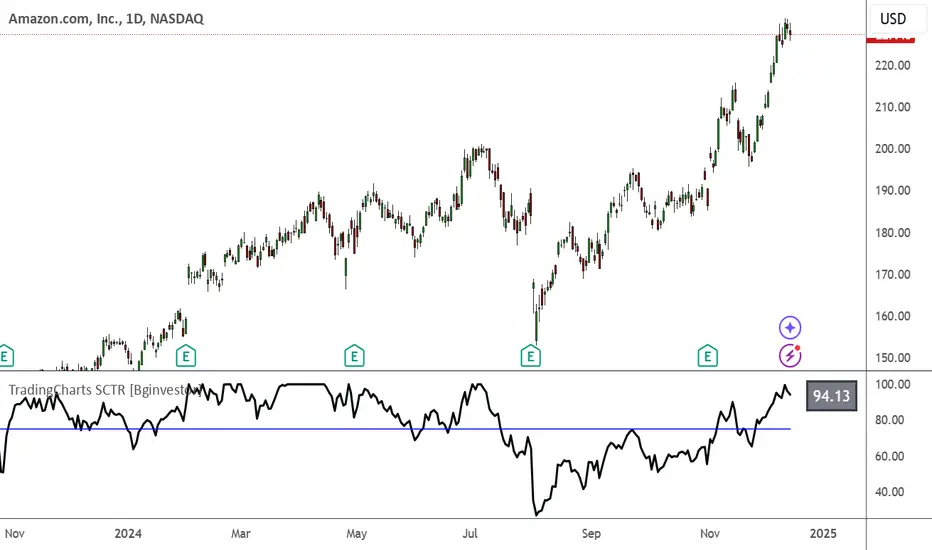
TradingCharts SCTR [Bginvestor]This indicator is replicating Tradingcharts, SCTR plot. If you know, you know.
Brief description: The StockCharts Technical Rank (SCTR), conceived by technical analyst John Murphy, emerges as a pivotal tool in evaluating a stock’s technical prowess. This numerical system, colloquially known as “scooter,” gauges a stock’s strength within various groups, employing six key technical indicators across different time frames.
How to use it:
Long-term indicators (30% weight each)
-Percent above/below the 200-day exponential moving average (EMA)
-125-day rate-of-change (ROC)
Medium-term indicators (15% weight each)
-percent above/below 50-day EMA
-20-day rate-of-change
Short-term indicators (5% weight each)
-Three-day slope of percentage price oscillator histogram divided by three
-Relative strength index
How to use SCTR:
Investors select a specific group for analysis, and the SCTR assigns rankings within that group. A score of 99.99 denotes robust technical performance, while zero signals pronounced underperformance. Traders leverage this data for strategic decision-making, identifying stocks with increasing SCTR for potential buying or spotting weak stocks for potential shorting.
Credit: I've made some modifications, but credit goes to GodziBear for back engineering the averaging / scaling of the equations.
Note: Not a perfect match to TradingCharts, but very, very close.
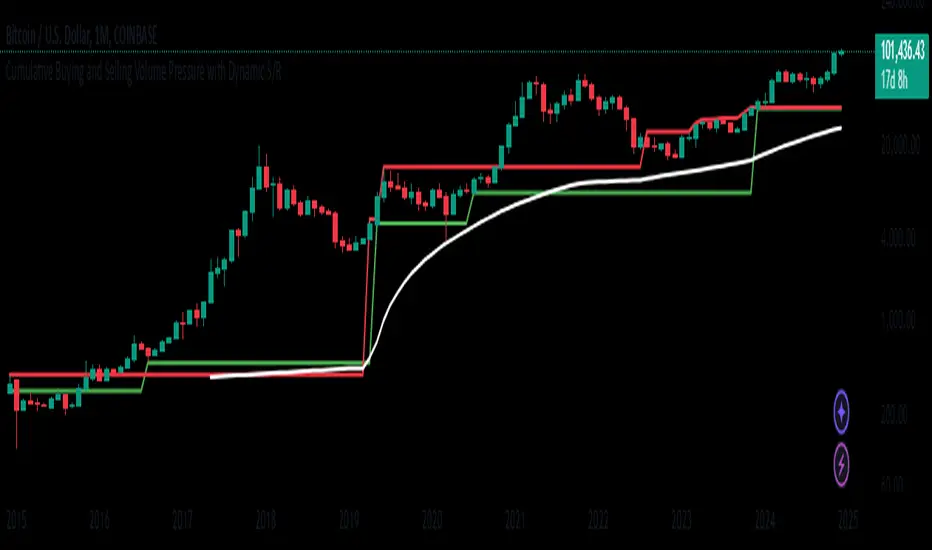
Buying and Selling Volume Pressure S/RThis custom indicator aims to visualize underlying market pressure by cumulatively analyzing where trade volume occurs relative to each candle's price range. By separating total volume into "buying" (when price closes near the high of the bar) and "selling" (when price closes near the low of the bar), the indicator identifies shifts in dominance between buyers and sellers over a defined lookback period.
When cumulative buying volume surpasses cumulative selling volume (a "bullish cross"), it suggests that buyers are gaining control. Conversely, when cumulative selling volume exceeds cumulative buying volume (a "bearish cross"), it indicates that sellers are taking the upper hand.
Based on these crossovers, the indicator derives dynamic Support and Resistance lines. After a bullish cross, it continuously tracks and updates the lowest low that occurs while the trend is bullish, forming a support zone. Similarly, after a bearish cross, it updates the highest high that appears during the bearish trend, forming a resistance zone.
A Mid Line is then calculated as the average of the current dynamic support and resistance levels, providing a central reference point. Around this Mid Line, the script constructs an upper and lower channel based on standard deviation, offering a sense of volatility or "divergence" from the mean level.
Finally, the indicator provides simple buy and sell signals: a buy signal is triggered when the price closes back above the Mid Line, suggesting a potential shift toward bullish conditions, while a sell signal appears when the price closes below the Mid Line, hinting at a possible bearish move.
In summary, this indicator blends volume-based market pressure analysis with adaptive support and resistance detection and overlays them onto the chart. It helps traders quickly gauge who controls the market (buyers or sellers), identify dynamic levels of support and resistance, and receive alerts on potential trend changes—simplifying decision-making in rapidly evolving market conditions.
Important Notice:
Trading financial markets involves significant risk and may not be suitable for all investors. The use of technical indicators like this one does not guarantee profitable results. This indicator should not be used as a standalone analysis tool. It is essential to combine it with other forms of analysis, such as fundamental analysis, risk management strategies, and awareness of current market conditions. Always conduct thorough research or consult with a qualified financial advisor before making trading decisions. Past performance is not indicative of future results.
Disclaimer:
Trading financial instruments involves substantial risk and may not be suitable for all investors. Past performance is not indicative of future results. This indicator is provided for informational and educational purposes only and should not be considered investment advice. Always conduct your own research and consult with a licensed financial professional before making any trading decisions.
Note: The effectiveness of any technical indicator can vary based on market conditions and individual trading styles. It's crucial to test indicators thoroughly using historical data and possibly paper trading before applying them in live trading scenarios.
Sector Relative Strength [Afnan]This indicator calculates and displays the relative strength (RS) of multiple sectors against a chosen benchmark. It allows you to quickly compare the performance of various sectors within any global stock market. While the default settings are configured for the Indian stock market , this tool is not limited to it; you can use it for any market by selecting the appropriate benchmark and sector indices.
📊 Key Features ⚙️
Customizable Benchmark: Select any symbol as your benchmark for relative strength calculation. The default benchmark is set to `NSE:CNX100`. This allows for global market analysis by selecting the appropriate benchmark index of any country.
Multiple Sectors: Analyze up to 23 different sector indices. The default settings include major NSE sector indices. This can be customized to any market by using the relevant sector indices of that country.
Individual Sector Control: Toggle the visibility of each sector's RS on the chart.
Color-Coded Plots: Each sector's RS is plotted with a distinct color for easy identification.
Adjustable Lookback Period: Customize the lookback period for RS calculation.
Interactive Table: A sortable table displays the current RS values for all visible sectors, allowing for quick ranking.
Table Customization: Adjust the table's position, text size, and visibility.
Zero Line: A horizontal line at zero provides a reference point for RS values.
🧭 How to Use 🗺️
Add the indicator to your TradingView chart.
Select your desired benchmark symbol. The default is `NSE:CNX100`. For example, use SPY for the US market, or DAX for the German market.
Adjust the lookback period as needed.
Enable/disable the sector indices you want to analyze. The default includes major NSE sector indices like `NSE:CNXIT`, `NSE:CNXAUTO`, etc.
Customize the table's appearance as needed.
Observe the RS plots and the table to identify sectors with relative strength or weakness.
📝 Note 💡
This indicator is designed for sectorial analysis. You can use it with any market by selecting the appropriate benchmark and sector indices.
The default settings are configured for the Indian stock market with `NSE:CNX100` as the benchmark and major NSE sector indices pre-selected.
The relative strength calculation is based on the price change of the sector index compared to the benchmark over the lookback period.
Positive RS values indicate relative outperformance, while negative values indicate relative underperformance.
👨💻 Developer 🛠️
Afnan Tajuddin

VWAP SlopeThis script calculates and displays the slope of the Volume Weighted Average Price (VWAP) . It compares the current VWAP with its value from a user-defined lookback period to determine the slope. The slope is color-coded: green for an upward trend (positive slope) and red for a downward trend (negative slope) .
Key Points:
VWAP Calculation: The script calculates the VWAP based on a user-defined timeframe (default: daily), which represents the average price weighted by volume.
Slope Determination: The slope is calculated by comparing the current VWAP to its value from a previous period, providing insight into market trends.
Color-Coding: The slope line is color-coded to visually indicate the market direction: green for uptrend and red for downtrend.
This script helps traders identify the direction of the market based on VWAP , offering a clear view of trends and potential turning points.
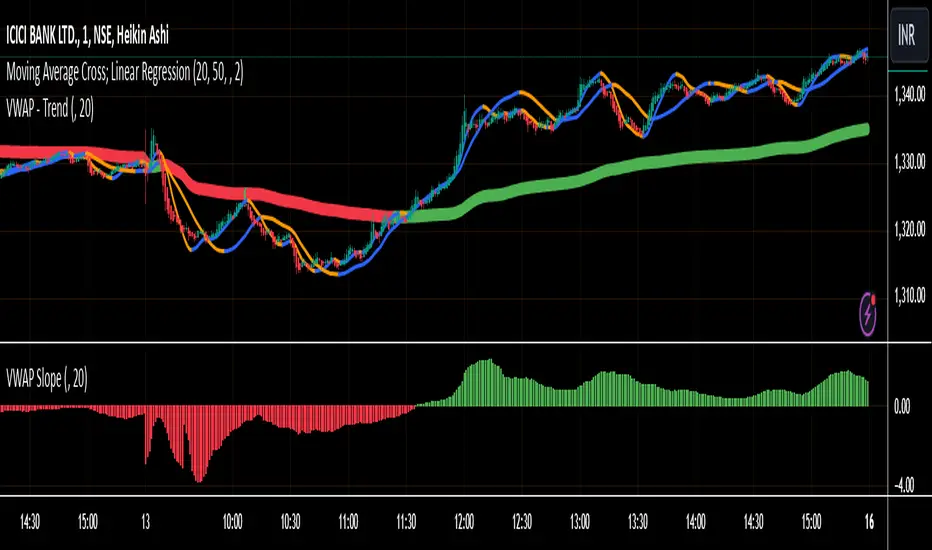
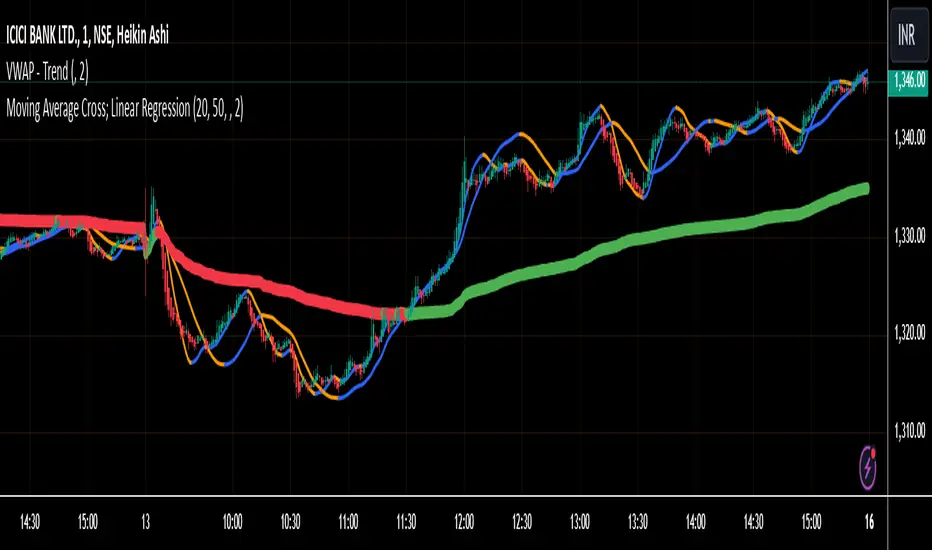
VWAP - TrendThis Pine Script calculates the Volume Weighted Average Price (VWAP) for a specified timeframe and plots its Linear Regression over a user-defined lookback period . The regression line is color-coded: green indicates an uptrend and red indicates a downtrend. The line is broken at the end of each day to prevent it from extending into the next day, ensuring clarity on a daily basis.
Key Features:
VWAP Calculation: The VWAP is calculated based on a selected timeframe, providing a smoothed average price considering volume.
Linear Regression: The script calculates a linear regression of the VWAP over a custom lookback period to capture the underlying trend.
Color-Coding: The regression line is color-coded to easily identify trends—green for an uptrend and red for a downtrend.
Day-End Break: The regression line breaks at the end of each day to prevent continuous plotting across days, which helps keep the analysis focused within daily intervals.
User Inputs: The user can adjust the VWAP timeframe and the linear regression lookback period to tailor the indicator to their preferences.
This script provides a visual representation of the VWAP trend, helping traders identify potential market directions and turning points based on the linear regression of the VWAP.
Salience Theory Crypto Returns (AiBitcoinTrend)The Salience Theory Crypto Returns Indicator is a sophisticated tool rooted in behavioral finance, designed to identify trading opportunities in the cryptocurrency market. Based on research by Bordalo et al. (2012) and extended by Cai and Zhao (2022), it leverages salience theory—the tendency of investors, particularly retail traders, to overemphasize standout returns.
In the crypto market, dominated by sentiment-driven retail investors, salience effects are amplified. Attention disproportionately focused on certain cryptocurrencies often leads to temporary price surges, followed by reversals as the market stabilizes. This indicator quantifies these effects using a relative return salience measure, enabling traders to capitalize on price reversals and trends, offering a clear edge in navigating the volatile crypto landscape.
👽 How the Indicator Works
Salience Measure Calculation :
👾 The indicator calculates how much each cryptocurrency's return deviates from the average return of all cryptos over the selected ranking period (e.g., 21 days).
👾 This deviation is the salience measure.
👾 The more a return stands out (salient outcome), the higher the salience measure.
Ranking:
👾 Cryptos are ranked in ascending order based on their salience measures.
👾 Rank 1 (lowest salience) means the crypto is closer to the average return and is more predictable.
👾 Higher ranks indicate greater deviation and unpredictability.
Color Interpretation:
👾 Green: Low salience (closer to average) – Trending or Predictable.
👾 Red/Orange: High salience (far from average) – Overpriced/Unpredictable.
👾 Text Gradient (Teal to Light Blue): Helps visualize potential opportunities for mean reversion trades (i.e., cryptos that may return to equilibrium).
👽 Core Features
Salience Measure Calculation
The indicator calculates the salience measure for each cryptocurrency by evaluating how much its return deviates from the average market return over a user-defined ranking period. This measure helps identify which assets are trending predictably and which are likely to experience a reversal.
Dynamic Ranking System
Cryptocurrencies are dynamically ranked based on their salience measures. The ranking helps differentiate between:
Low Salience Cryptos (Green): These are trending or predictable assets.
High Salience Cryptos (Red): These are overpriced or deviating significantly from the average, signaling potential reversals.
👽 Deep Dive into the Core Mathematics
Salience Theory in Action
Salience theory explains how investors, particularly in the crypto market, tend to prefer assets with standout returns (salient outcomes). This behavior often leads to overpricing of assets with high positive returns and underpricing of those with standout negative returns. The indicator captures these deviations to anticipate mean reversions or trend continuations.
Salience Measure Calculation
// Calculate the average return
avgReturn = array.avg(returns)
// Calculate salience measure for each symbol
salienceMeasures = array.new_float()
for i = 0 to array.size(returns) - 1
ret = array.get(returns, i)
salienceMeasure = math.abs(ret - avgReturn) / (math.abs(ret) + math.abs(avgReturn) + 0.1)
array.push(salienceMeasures, salienceMeasure)
Dynamic Ranking
Cryptos are ranked in ascending order based on their salience measures:
Low Ranks: Cryptos with low salience (predictable, trending).
High Ranks: Cryptos with high salience (unpredictable, likely to revert).
👽 Applications
👾 Trend Identification
Identify cryptocurrencies that are currently trending with low salience measures (green). These assets are likely to continue their current direction, making them good candidates for trend-following strategies.
👾 Mean Reversion Trading
Cryptos with high salience measures (red to light blue) may be poised for a mean reversion. These assets are likely to correct back towards the market average.
👾 Reversal Signals
Anticipate potential reversals by focusing on high-ranked cryptos (red). These assets exhibit significant deviation and are prone to price corrections.
👽 Why It Works in Crypto
The cryptocurrency market is dominated by retail investors prone to sentiment-driven behavior. This leads to exaggerated price movements, making the salience effect a powerful predictor of reversals.
👽 Indicator Settings
👾 Ranking Period : Number of bars used to calculate the average return and salience measure.
Higher Values: Smooth out short-term volatility.
Lower Values: Make the ranking more sensitive to recent price movements.
👾 Number of Quantiles : Divide ranked assets into quantile groups (e.g., quintiles).
Higher Values: More detailed segmentation (deciles, percentiles).
Lower Values: Broader grouping (quintiles, quartiles).
👾 Portfolio Percentage : Percentage of the portfolio allocated to each selected asset.
Enter a percentage (e.g., 20 for 20%), automatically converted to a decimal (e.g., 0.20).
Disclaimer: This information is for entertainment purposes only and does not constitute financial advice. Please consult with a qualified financial advisor before making any investment decisions.

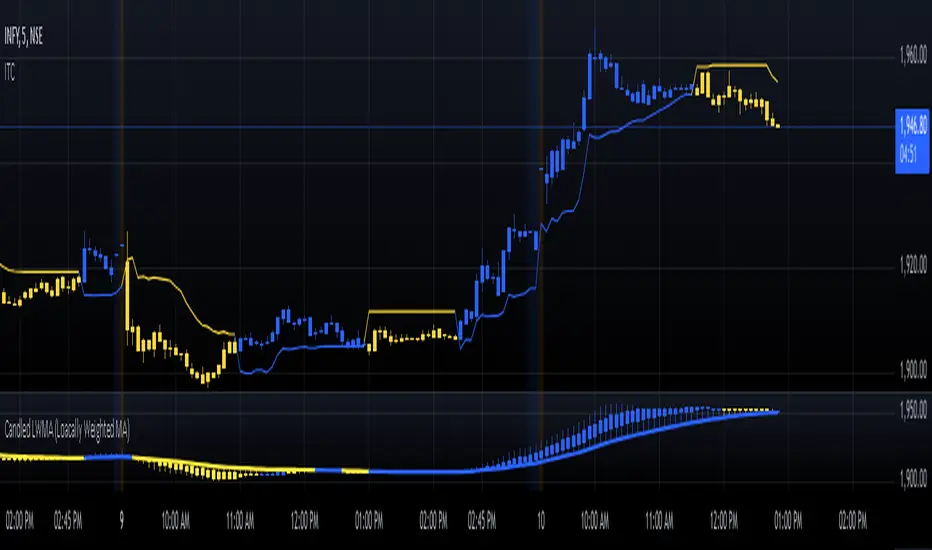
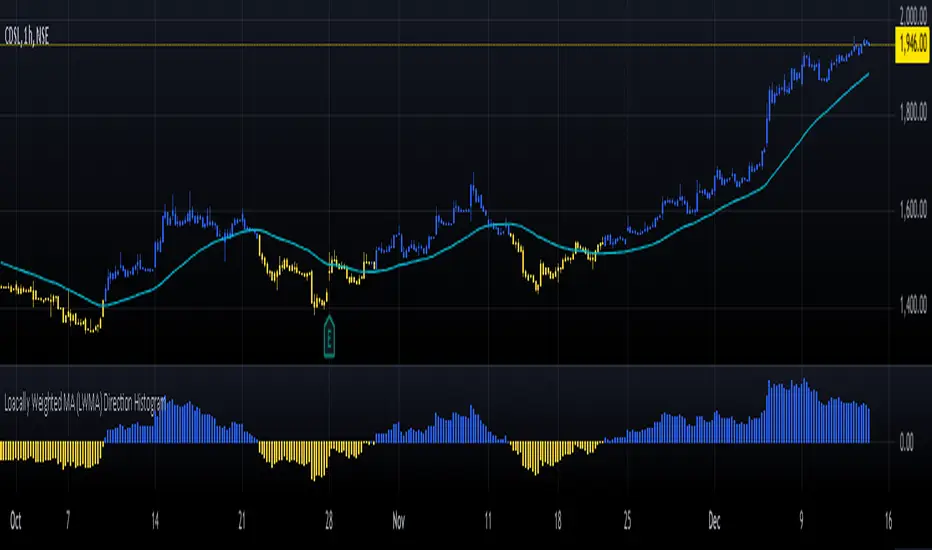
Loacally Weighted MA (LWMA) Direction HistogramThe Locally Weighted Moving Average (LWMA) Direction Histogram indicator is designed to provide traders with a visual representation of the price momentum and trend direction. This Pine Script, written in version 6, calculates an LWMA by assigning higher weights to recent data points, emphasizing the most current market movements. The script incorporates user-defined input parameters, such as the LWMA length and a direction lookback period, making it flexible to adapt to various trading strategies and preferences.
The histogram visually represents the difference between the current LWMA and a previous LWMA value (based on the lookback period). Positive values are colored blue, indicating upward momentum, while negative values are yellow, signaling downward movement. Additionally, the script colors candlesticks according to the histogram's value, enhancing clarity for users analyzing market trends. The LWMA line itself is plotted on the chart but hidden by default, enabling traders to toggle its visibility as needed. This blend of histogram and candlestick visualization offers a comprehensive tool for identifying shifts in momentum and potential trading opportunities.
Zero-Lag MA CandlesThe Zero-Lag MA Candles indicator combines the efficiency of a Zero-Lag Moving Average (ZLMA) with dynamic candlestick coloring to provide a clear visual representation of market trends. By leveraging a dual EMA-based calculation, the ZLMA achieves reduced lag, enhancing its responsiveness to price changes. The indicator plots candles on the chart with colors determined by the trend direction of the ZLMA over a user-defined lookback period. Blue candles signify an uptrend, while yellow candles indicate a downtrend, offering traders an intuitive way to identify market sentiment.
This indicator is particularly useful for trend-following strategies, as the crossover and crossunder between the ZLMA and the standard EMA highlight potential reversal points or trend continuation zones. With customizable inputs for ZLMA length, trend lookback period, and color schemes, it caters to diverse trading preferences. Its ability to plot directly on the chart ensures seamless integration with other analysis tools, making it a valuable addition to a trader's toolkit.
Happy trading...

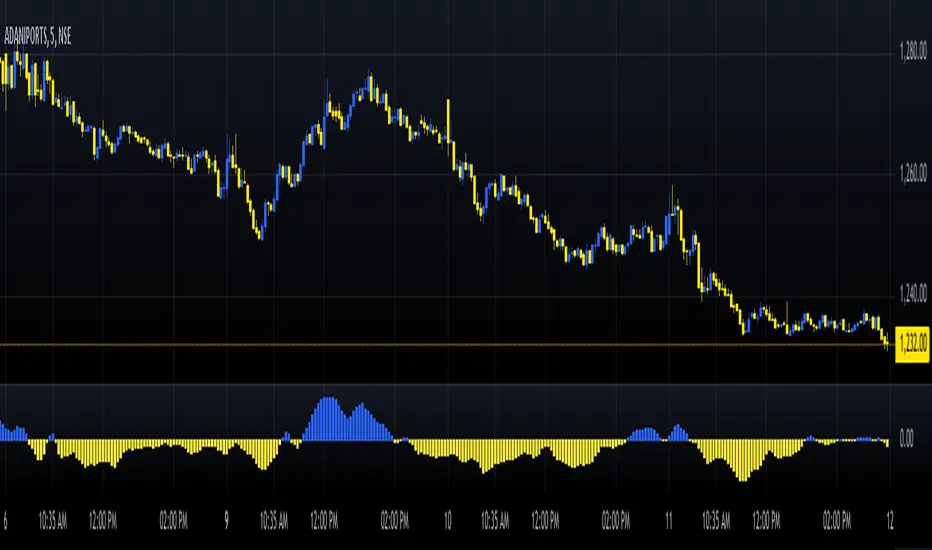
MA Direction Histogram
The MA Direction Histogram is a simple yet powerful tool for visualizing the momentum of a moving average (MA). It highlights whether the MA is trending up or down, making it ideal for identifying market direction quickly.
Key Features:
1. Custom MA Options: Choose from SMA, EMA, WMA, VWMA, or HMA for flexible analysis.
2. Momentum Visualization: Bars show the difference between the MA and its value from a lookback period.
- Blue Bars: Upward momentum.
- Yellow Bars: Downward momentum.
3. Easy Customization: Adjust the MA length, lookback period, and data source.
How to Use:
- Confirm Trends: Positive bars indicate uptrends; negative bars suggest downtrends.
- *Spot Reversals: Look for bar color changes as potential reversal signals.
Compact, intuitive, and versatile, the "MA Direction Histogram" helps traders stay aligned with market momentum. Perfect for trend-based strategies!
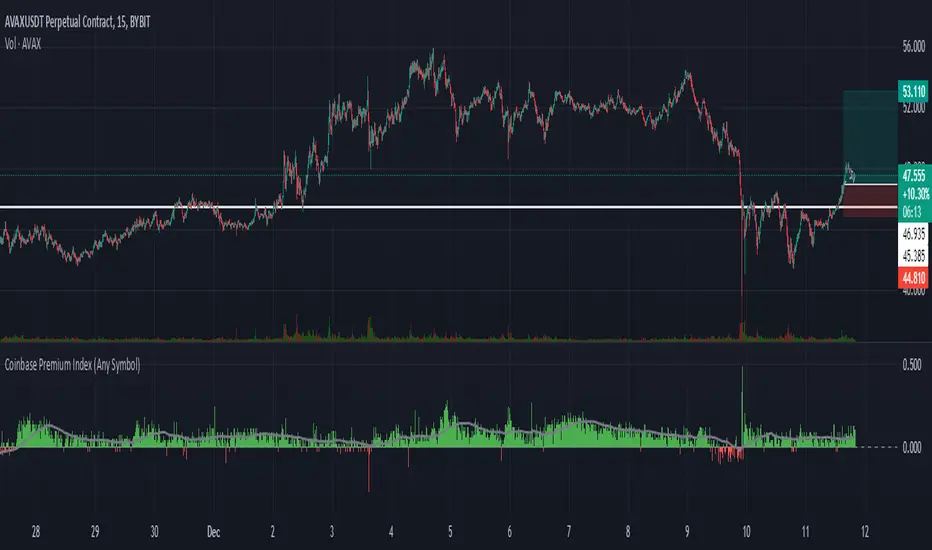
Coinbase Premium Index (Any Symbol)The Coinbase Premium Index provides a valuable insight into market dynamics by calculating the price premium between Coinbase (USD pairs) and Binance (USDT pairs). A positive premium typically indicates heavy buying pressure on Coinbase, often coinciding with upward price trends on lower timeframes. Conversely, a negative premium suggests selling pressure or weaker demand on Coinbase compared to Binance.
** Key Features: **
**Dynamic Symbol Detection**: Automatically detects the current chart symbol and adapts the premium calculation accordingly.
**Customizable Moving Averages**:
Select between SMA (Simple Moving Average) or EMA (Exponential Moving Average).
Adjust the moving average period to suit your trading strategy (default: SMA with 50 periods).
**Error Handling for Missing Data**:
Displays "Symbol not on Coinbase" when the cryptocurrency is unavailable on Coinbase.
Plots zero-value columns in light grey for unsupported symbols.
**Visual Representation**:
Premium values are displayed as columns: green for positive premiums, red for negative premiums.
A moving average line in light grey helps highlight trends.
Zero Line: A horizontal dashed line is included as a reference point.
** Why Use This Script?**
The Coinbase Premium Index helps traders identify moments of increased buying pressure among U.S. investors, often indicative of bullish momentum on lower timeframes. Use this tool to monitor premium dynamics and gain a clearer understanding of market sentiment across major exchanges.
** How to Use: **
Add this script to your TradingView chart.
Adjust the moving average type and period through the input menu.
Use the premium columns and moving averages to identify potential price trends and validate exchange-specific trading opportunities.
Enhanced Gap Up/Down AnalysisThis Pine Script indicator, titled "Enhanced Gap Up/Down Analysis", is designed to visually analyze the percentage gaps between the current day's opening price and the previous day's closing price. It provides valuable insights into market behavior by categorizing gaps and coloring them based on specific conditions.
Key Features:
Bar Coloring Based on Conditions:
Gap-Up Days:
Green if the day closes higher than it opens.
Red if the day closes lower than it opens.
Gap-Down Days:
Red if the day closes lower than it opens.
Green if the day closes higher than it opens.
The bar's position reflects the gap percentage (positive values for gap-ups above the X-axis, negative values for gap-downs below the X-axis).
Gap Size Thresholds:
Users can define small and moderate gap thresholds to categorize gaps:
Small Gaps: Transparent color.
Moderate Gaps: Opaque color.
Large Gaps: Fully visible color.
Ensures small gaps are less than moderate gaps with validation logic.
Filter Gaps by Percentage:
Includes filters to show gaps only within a user-defined range (minFilterGap to maxFilterGap).
Histogram Visualization:
Plots the gap percentages as a histogram for easy visual analysis:
Positive bars for gap-ups.
Negative bars for gap-downs.
Alerts for Large Gaps:
Alerts notify when a gap exceeds the moderate threshold in either direction.
Use Cases:
Identify Market Sentiment:
Quickly assess whether gap-ups or gap-downs dominate.
Analyze whether gaps tend to follow through or reverse by observing bar colors.
Filter Relevant Gaps:
Focus on significant gaps (e.g., only gaps greater than 2%).
Visual Aid for Trading:
Helps traders detect patterns in market gaps and price movement relationships (e.g., gaps and reversals).
Customizable Inputs:
Small and Moderate Gap Thresholds: Define gap categories.
Gap Filter Range: Control which gaps to display.
Alerts: Get notified of significant gaps.
This tool is particularly useful for traders analyzing price gaps and their implications for market trends or reversals.

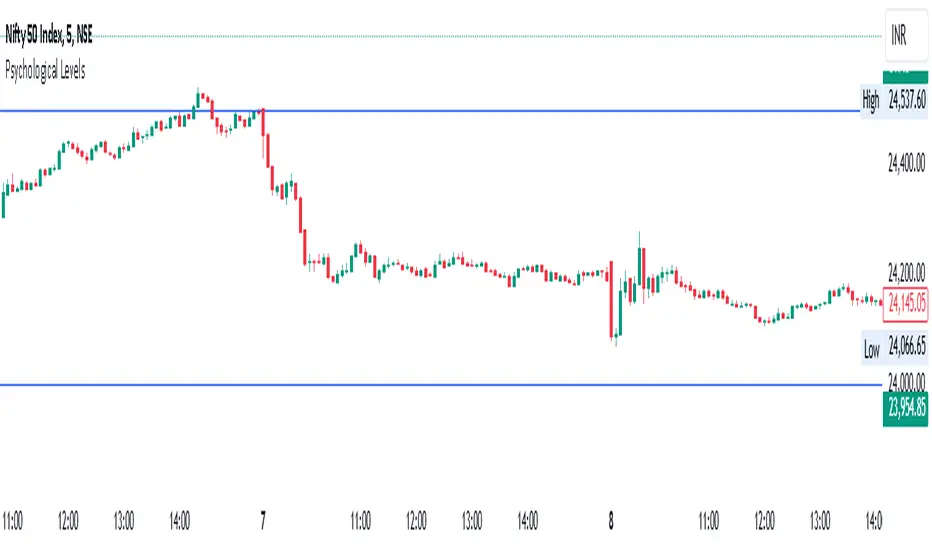
Psychological Levels- Rounding Numbers Psychological Levels Indicator
Overview:
The Psychological Levels Indicator automatically identifies and plots significant price levels based on psychological thresholds, which are key areas where market participants often focus their attention. These levels act as potential support or resistance zones due to human behavioral tendencies to round off numbers. This indicator dynamically adjusts the levels based on the stock's price range and ensures seamless visibility across the chart.
Key Features:
Dynamic Step Sizes:
The indicator adjusts the levels dynamically based on the stock price:
For prices below 500: Levels are spaced at 10.
For prices between 500 and 3000: Levels are spaced at 50, 100, and 1000.
For prices between 3000 and 10,000: Levels are spaced at 100 and 1000.
For prices above 10,000: Levels are spaced at 500 and 1000.
Extended Visibility:
The plotted levels are extended across the entire chart for improved visualization, ensuring traders can easily monitor these critical zones over time.
Customization Options:
Line Color: Choose the color for the levels to suit your charting style.
Line Style: Select from solid, dashed, or dotted lines.
Line Width: Adjust the thickness of the lines for better clarity.
Clean and Efficient Design:
The indicator only plots levels relevant to the visible chart range, avoiding unnecessary clutter and ensuring a clean workspace.
How It Works:
It calculates the relevant step sizes based on the price:
Smaller step sizes for lower-priced stocks.
Larger step sizes for higher-priced stocks.
Primary, secondary, and (if applicable) tertiary levels are plotted dynamically:
Primary Levels: The most granular levels based on the stock price.
Secondary Levels: Higher-order levels for broader significance.
Tertiary Levels: Additional levels for lower-priced stocks to enhance detail.
These levels are plotted across the chart, allowing traders to visualize key psychological areas effortlessly.
Use Cases:
Day Trading: Identify potential intraday support and resistance levels.
Swing Trading: Recognize key price zones where trends may pause or reverse.
Long-Term Investing: Gain insights into significant price zones for entry or exit strategies.
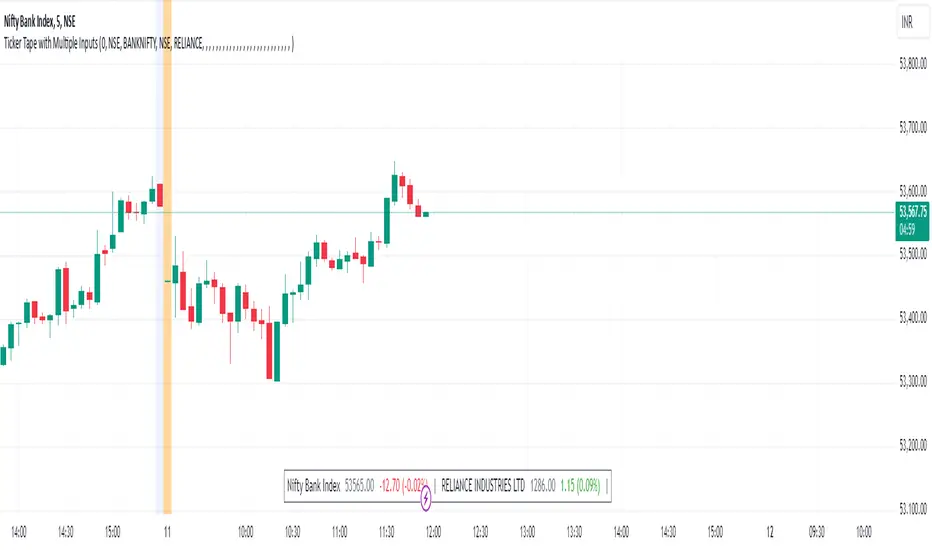
Ticker Tape with Multiple Inputs# Ticker Tape
A customizable multi-symbol price tracker that displays real-time price information in a scrolling ticker format, similar to financial news tickers.
This indicator is inspired from Tradingciew's default tickertape indicator with changes in the way inputs are given.
### Overview
This indicator allows you to monitor up to 15 different symbols simultaneously across any supported exchanges on TradingView. It displays essential price information including current price, price change, and percentage change in an easy-to-read format at the bottom of your chart.
### Features
• Monitor up to 15 different symbols simultaneously
• Support for any exchange available on TradingView
• Real-time price updates
• Color-coded price changes (green for increase, red for decrease)
• Smooth scrolling animation (can be disabled)
• Customizable scroll speed and position offset
### Input Parameters
#### Ticker Tape Controls
• Running: Enable/disable the scrolling animation
• Offset: Adjust the starting position of the ticker tape
#### Symbol Settings
• Exchange (1-15): Enter the exchange name (e.g., NSE, BINANCE, NYSE)
• Symbol (1-15): Enter the symbol name (e.g., BANKNIFTY, RELIANCE, BTCUSDT)
### Display Format
For each symbol, the ticker shows:
1. Symbol Name
2. Current Price
3. Price Change (Absolute and Percentage)
### Example Usage
Input Settings:
Exchange 1: NSE
Symbol 1: BANKNIFTY
Exchange 2: NSE
Symbol 2: RELIANCE
The ticker tape will display:
`NIFTY BANK 46750.00 +350.45 (0.75%) | RELIANCE 2456.85 -12.40 (-0.50%) |`
### Use Cases
1. Multi-Market Monitoring: Track different markets simultaneously without switching between charts
2. Portfolio Tracking: Monitor all your positions in real-time
### Tips for Best Use
1. Group related symbols together for easier monitoring
2. Use the offset parameter to position important symbols in your preferred viewing area
3. Disable scrolling if you prefer a static display
4. Leave exchange field empty for default exchange symbols
### Notes
• Price updates occur in real-time during market hours
• Color coding helps quickly identify price direction
• The indicator adapts to any chart timeframe
• Empty input pairs are automatically skipped
### Performance Considerations
The indicator is optimized for efficiency, but monitoring too many high-frequency symbols might impact chart performance. It's recommended to use only the symbols you actively need to monitor.
Version: 2.0 Stock_Cloud
Last Updated: December 2024
[blackcat] L1 Banker Move█ OVERVIEW
The Pine Script is an indicator designed to analyze market signals for institutional and short-term investors. It calculates and plots three main signals: Institutional Signal, Institutional Build, and Short-Term Investor Signal. The script uses a combination of price, volume, and moving average data to generate these signals, which can help traders identify potential buying or selling opportunities.
█ LOGICAL FRAMEWORK
The script is structured into several main sections:
1 — Input Parameters
The script does not explicitly define any input parameters, relying on default values for calculations.
2 — Custom Functions
• reference_value(values, length) : Retrieves the first non-NA value from a specified number of past values.
• calculate_institutional_and_short_term_signals(low, close, open, volume) : Calculates the institutional and short-term investor signals based on price, volume, and moving average data.
3 — Calculations
• Price and Volume Metrics: The script calculates various smoothed price changes, lowest and highest values over different periods, and volume-weighted prices.
• Moving Averages: It computes simple moving averages (SMA) and exponential moving averages (EMA) for different periods.
• RSI Calculation: The script calculates a custom RSI for different periods.
• Signal Generation: It generates the institutional and short-term investor signals based on the calculated metrics.
4 — Plotting
The script plots the three main signals on the chart using the plot function.
The flow of data and logic is as follows:
• The reference_value function is used to find reference values for calculations.
• The calculate_institutional_and_short_term_signals function performs the core calculations and returns the institutional and short-term investor signals.
• The main script calls this function and plots the results.
█ CUSTOM FUNCTIONS
1 — reference_value(values, length)
• Purpose : Retrieves the first non-NA value from a specified number of past values.
• Parameters :
• values: An array of values.
• length: The number of past values to consider.
• Return Value : The first non-NA value found or na if no valid value is found.
• Functionality : Iterates through the specified number of past values and returns the first non-NA value.
2 — calculate_institutional_and_short_term_signals(low, close, open, volume)
• Purpose : Calculates the institutional and short-term investor signals based on price, volume, and moving average data.
• Parameters :
• low: Low price series.
• close: Close price series.
• open: Open price series.
• volume: Volume series.
• Return Values :
• institutional_signal: The institutional signal.
• institutional_build: The institutional build signal.
• short_term_investor_signal: The short-term investor signal.
• Functionality :
• Computes various price and volume metrics.
• Calculates moving averages and volume-weighted prices.
• Generates the institutional and short-term investor signals based on these metrics.
█ KEY POINTS AND TECHNIQUES
1 — Advanced Pine Script Features
• Custom Functions: The script defines and uses custom functions to encapsulate complex logic.
• Conditional Statements: Extensive use of iff and if statements to control the flow of calculations.
• Looping Constructs: The for loop in reference_value function to iterate through past values.
• Exponential Moving Averages (EMA): Used to smooth out price and signal changes.
• Volume-Weighted Price (VWP): Calculated to factor in volume in price analysis.
• Custom RSI Calculation: A custom RSI formula is used, which differs from the standard RSI calculation.
2 — Optimization Techniques
• Efficient Data Handling: The reference_value function efficiently finds the first non-NA value without unnecessary computations.
• Smoothed Signals: Using EMAs to smooth out noisy signals for better trend identification.
3 — Unique Approaches
• Combination of Metrics: The script combines multiple metrics (price, volume, moving averages, and custom RSI) to generate comprehensive signals.
• Institutional Build Signal: A unique approach to detect institutional activity by comparing current price levels with historical lows and smoothed price changes.
█ EXTENDED KNOWLEDGE AND APPLICATIONS
1 — Potential Modifications
• Input Parameters: Add input parameters to allow users to customize the lengths and thresholds used in the calculations.
• Strategy Version: Convert the indicator into a strategy by adding buy/sell signals based on the generated signals.
• Additional Indicators: Integrate other technical indicators (e.g., MACD, Bollinger Bands) to enhance the signal generation process.
2 — Similar Trading Scenarios
• Institutional Activity Analysis: Use similar techniques to analyze institutional activity in other markets or assets.
• Volume Analysis: Apply the volume-weighted price and volume analysis to identify significant price movements.
• Multi-Timeframe Analysis: Extend the script to analyze signals across multiple timeframes for a more robust trading strategy.
3 — Related Pine Script Concepts
• Pine Script Functions: Understanding how to define and use custom functions effectively.
• Conditional Logic: Mastering the use of iff and if statements for complex logic.
• Looping Constructs: Familiarity with for loops for iterating through data.
• Moving Averages: Knowledge of different types of moving averages and their applications.
• Volume Analysis: Techniques for incorporating volume data into price analysis.

squeeze candles with volume Function :
This indicator was designed to detect specific candles called “squeeze”. These candles are characterized by a relatively small body (the difference between the opening and closing price) and long shadows (the distance between the high and low prices), accompanied by significant volume. They often indicate a period of increased volatility or a potential trend reversal.
Use :
Visual detection:
Candles identified as "squeeze" are highlighted in red on the chart.
An “S” icon appears above each detected squeeze candle.
Alerts:
The indicator emits an audible and visual alert when a squeeze candle with high volume is detected (if alerts are enabled).
Market analysis:
This indicator is particularly useful for identifying trading opportunities during periods when the market is showing signs of compression or impending volatility.
Customizable settings:
Minimum volume: Defines the threshold at which the volume is considered high.
Maximum body/shadow ratio: Allows you to adjust the sensitivity to detect squeeze candles (the lower the ratio, the smaller the detected candles will have in relation to their shadows).
Benefits :
Provides accurate alerts on key market candles.
Helps anticipate large movements through analysis of volume and candle characteristics.
Adaptable to different strategies thanks to adjustable parameters.
Ideal for:
Traders who want to identify areas of potential volatility or reversal signals in the market, regardless of the asset or time frame used.
US Recessions OverlayThe US Recessions Overlay indicator highlights the periods of US economic recessions directly on your TradingView chart. Using historical data from the Great Depression to the present, it provides a visual representation of recessions as transparent red backgrounds. This can help traders and analysts correlate market movements with historical economic downturns.
Features:
- Displays US recessions since the Great Depression (1929) as shaded areas.
- Automatically adjusts the background shading to match the date ranges of historical recessions.
- A simple and effective way to observe market behavior during recessionary periods.
- Fully customizable to include new recession periods or modify transparency levels.
How to Use:
Apply the indicator to any chart. Recession periods will appear as red-shaded backgrounds, providing a clear visual cue for market behavior during those times.
Use Case:
Ideal for traders, economists, and market historians who wish to study the impact of recessions on financial markets.

Candled LWMA (Loacally Weighted MA)The Locally Weighted Moving Average (LWMA) is a type of moving average that emphasizes recent data points by assigning them higher weights compared to older values. Unlike the Simple Moving Average (SMA), which treats all data points equally, or the Exponential Moving Average (EMA), which uses a fixed weighting factor, the LWMA applies a linear weighting scheme. This means that the most recent prices contribute more significantly to the average, making the LWMA more responsive to price changes while retaining a smooth curve.
In trading, the LWMA is particularly useful for identifying trends and detecting price reversals with reduced lag. By giving more importance to the latest prices, it provides a clearer picture of the current market dynamics. Traders often use the LWMA in combination with other indicators to confirm trends or spot potential entry and exit points. The adjustable length parameter allows for fine-tuning the indicator to match different market conditions and trading styles. Its ability to adapt to recent price behavior makes it a valuable tool for both short-term and long-term traders.