Volume-Weighted RSI [wbburgin]The Volume-Weighted RSI takes a new approach to the traditional calculation of the RSI in using a price::volume calculation. As some traders consider volume to be a leading indicator for price, the volume-weighted RSI can come in handy if you want to visualize volume easier.
Usage
This indicator builds the RSI from the square of the volume change and the price. If the volume decreases rapidly with the price, the volume-weighted RSI will fall; if the volume increases rapidly with the price, the volume-weighted RSI will rise.
You may notice crosses and circles appearing above and below the indicator. These indicate abnormal volume or price:
A green cross indicates abnormal upward price
A red cross indicates abnormal downward price
A green circle indicates abnormal positive volume
A red circle indicates abnormal negative volume
A green bar indicates both abnormal price and volume (positive), while a red bar indicates both abnormal price and volume (negative).
The thresholds of what are considered "normal" and "abnormal" are controlled by the "SD Multiple" in your settings (standard deviation). A higher multiple will make less of these signals occur, and you can turn them and the bars off at any time.
I have a built-in Light Style and Dark Style so that your preference of background won't affect seeing the indicator. You can also change the colors and the overbought/oversold lines in your settings.
"volume" için komut dosyalarını ara

Volume Support and Resistance*In a cutting system, from the lowest price of the red momentum to the highest price of the green momentum of the range of candles, cuts of different heights are created and the volume of transactions is calculated.
*Volumes in red and green candles each layer are calculated separately.
*The start of the candles can be from a candle other than zero.
*The maximum number of cuts for support or resistance will be separate and user-opinionated. This will help us see the most accurate support or resistance independently and quickly.
*The layer that has (1) the highest volume ratio of green to red, (2) the lowest number of red candles and (3) the highest number of green candles is considered as the best resistance and vice versa as the best support. Therefore, by changing the maximum number of cuts, we should look for the largest ratio of green to red volume for resistance and vice versa for support.
*If the current price is in the range of the momentum candle, the distance of the highest or lowest price of the momentum to hlc3 of the momentum candle will be checked.
*if you get an error message (> 500ms), reduce high_slice or loockback.
*Trading volume is formatted because it varies from very small to very large numbers in different markets and time periods.

Projected VolumeOverview
The indicator displays the expected volume up to the closing time of the session.
Calculations
The real volume is proportional to the projected volume, just as elapsed session time is proportional to entire trading session. Knowing the actual volume, the elapsed time of the session and the total time of the trading session, it is possible to find out the projected volume.
How It Works
On the last volume bar, the indicator shows the projected volume overlapped with the real volume.
How To Use
Assuming that any price movement is of little relevance if not confirmed with considerable volume, if a strong signal appears on the intraday chart but with low volume, we can overlook it as the projected volume on the daily chart is high and indicates that there is a high chance of directional movement for the day. In short, even if we have an entry signal with low volume on the intraday chart, it will still be viable to open a trade as long as on the daily chart the projected volume is high, i.e, above the moving average.
Inputs
Use 24 hours in Trading Hours input for nonstop markets, like crypto and forex, or set the specific trading hours for other market types like stocks. The projected volume will be displayed on all timeframes if the value is equal to 24. For other values it will be displayed on the 1-day chart only.

Volume-Weighted RSI with Adaptive SmoothingThis indicator is designed to provide traders with insights into the relative strength of a security by incorporating volume-weighted elements, effectively combining the concepts of Relative Strength Index (RSI) and volume-weighted averages to generate meaningful trading signals.
The indicator calculates the traditional RSI, which measures the speed and change of price movements, as well as the volume-weighted RSI, which considers the influence of trading volume on price action. It then applies adaptive smoothing to the volume-weighted RSI, allowing for customization of the smoothing process. The resulting smoothed volume-weighted RSI is plotted alongside the original RSI, providing traders with a comprehensive view of the price strength dynamics.
The line coloration in this indicator is designed to provide visual cues about the relationship between the RSI and the volume-weighted RSI. When the RSI line is above or equal to the volume-weighted RSI line, it suggests a potentially bullish condition with positive market momentum. In such cases, the line is colored lime. Conversely, when the RSI line (fuchsia) is below the volume-weighted RSI line, it indicates a potentially bearish condition with negative market momentum. The line color is set to fuchsia. By observing the line color, traders can quickly assess the relative strength between the RSI and the volume-weighted RSI, aiding their decision-making process.
The bar color and background color further enhance the visual interpretation of the indicator. The bar color reflects the RSI's relationship with the volume-weighted RSI and the predefined thresholds. If the RSI line is above both the volume-weighted RSI line and the overbought threshold (70), the bar color is set to lime, indicating a potentially overbought condition. Conversely, if the RSI line is below both the volume-weighted RSI line and the oversold threshold (30), the bar color is set to fuchsia, suggesting a potentially oversold condition. When the RSI line is between these two thresholds, the bar color is set to yellow, indicating a neutral or intermediate state. The background color, displayed with a semi-transparent shade, provides additional context by reflecting the prevailing market conditions. It turns lime if the volume-weighted RSI is above the overbought threshold, fuchsia if below the oversold threshold, and yellow if it falls between these two thresholds. This coloration scheme aids traders in quickly assessing market conditions and potential trading opportunities.
Calculations:
-- RSI Calculation : The traditional RSI is calculated based on the price movements of the asset. The up and down movements are determined, and exponential moving averages are used to smooth the values. The RSI value ranges from 0 to 100, with levels above 70 indicating overbought conditions and levels below 30 indicating oversold conditions.
-- Volume-Weighted RSI Calculation : The volume-weighted RSI incorporates the trading volume of the asset into the calculations. The closing price is multiplied by the corresponding volume, and the average is taken over a specific length. The up and down movements are smoothed using exponential moving averages to generate the volume-weighted RSI value.
-- Adaptive Smoothing : The indicator offers an adaptive smoothing option, allowing traders to customize the smoothing process of the volume-weighted RSI. By adjusting the smoothing length, traders can fine-tune the responsiveness of the indicator to changes in market conditions. Smoothing helps reduce noise and enhances the clarity of the signals.
Interpretation:
The indicator provides two main components for interpretation:
-- RSI : The traditional RSI reflects the price momentum and potential overbought or oversold conditions. Traders can look for RSI values above 70 as potential overbought signals, suggesting a possible price reversal or correction. Conversely, RSI values below 30 indicate potential oversold signals, indicating a potential price rebound or rally.
-- Volume-Weighted RSI : The volume-weighted RSI incorporates trading volume, which provides insights into the strength of price movements. When the volume-weighted RSI is above the traditional RSI, it suggests that the buying pressure supported by higher volume is stronger, potentially indicating a more reliable trend. Conversely, when the volume-weighted RSI is below the traditional RSI, it suggests that the selling pressure supported by higher volume is stronger, potentially indicating a more significant price reversal.
Potential Strategies:
-- Overbought and Oversold Signals : Traders can utilize the RSI component of the indicator to identify overbought and oversold conditions. A potential strategy is to consider taking short positions when the RSI is above 70 and long positions when the RSI is below 30. These levels can act as dynamic support and resistance areas, indicating possible price reversals.
-- Confirmation with Volume : Traders can use the volume-weighted RSI as a confirmation tool to validate price movements. When the volume-weighted RSI is above the traditional RSI, it may provide additional confirmation for long positions, suggesting stronger buying pressure. Conversely, when the volume-weighted RSI is below the traditional RSI, it may provide confirmation for short positions, indicating stronger selling pressure.
-- Trend Reversal Strategy : Watch for the volume-weighted RSI to reach extreme levels above 70 (overbought) or below 30 (oversold). Look for a reversal signal where the RSI line (green or fuchsia) crosses below or above the volume-weighted RSI line. Enter a trade when the reversal signal occurs, and the RSI line changes color. Exit the trade when the RSI line crosses back in the opposite direction or reaches the opposite extreme level.
-- Divergence Strategy : Compare the direction of the RSI line (green or fuchsia) with the volume-weighted RSI line. A bullish divergence occurs when the RSI line makes higher lows while the volume-weighted RSI line makes lower lows. A bearish divergence occurs when the RSI line makes lower highs while the volume-weighted RSI line makes higher highs. Once a divergence is identified, wait for the RSI line to cross above or below the volume-weighted RSI line as confirmation of a potential trend reversal. Consider using additional indicators or price action analysis to time the entry more accurately. Use stop-loss orders and profit targets to manage risk and secure profits.
-- Trend Continuation Strategy : Assess the overall trend direction by observing the RSI line's position relative to the volume-weighted RSI line. When the RSI line consistently stays above the volume-weighted RSI line, it indicates a bullish trend, while the opposite suggests a bearish trend. Look for temporary pullbacks within the ongoing trend where the RSI line (green or fuchsia) touches or crosses the volume-weighted RSI line. Enter trades in the direction of the dominant trend when the RSI line crosses back in the trend direction. Exit the trade when the RSI line starts to deviate significantly from the volume-weighted RSI line or when the trend shows signs of weakening through other technical or fundamental factors.
Limitations:
-- False Signals : Like any indicator, the "Volume-Weighted RSI with Adaptive Smoothing" may produce false signals, especially during periods of low liquidity or choppy market conditions. Traders should exercise caution and consider using additional confirmation indicators or tools to validate the signals generated by this indicator.
-- Lagging Nature : The indicator relies on historical price data and volume to calculate the RSI and volume-weighted RSI. As a result, the signals provided may have a certain degree of lag compared to real-time price action. Traders should be aware of this inherent lag and consider combining the indicator with other timely indicators to enhance the accuracy of their trading decisions.
-- Parameter Sensitivity : The indicator's effectiveness can be influenced by the choice of parameters, such as the length of the RSI, smoothing length, and adaptive smoothing option. Different market conditions may require adjustments to these parameters to optimize performance. Traders are encouraged to conduct thorough testing and analysis to determine the most suitable parameter values for their specific trading strategies and preferences.
-- Market Conditions : The indicator's performance may vary depending on the prevailing market conditions. It is essential to understand that no indicator can guarantee accurate predictions or consistently profitable trades. Traders should consider the broader market context, fundamental factors, and other technical indicators to complement the insights provided by the "Volume-Weighted RSI with Adaptive Smoothing" indicator.
-- Subjectivity : Interpretation of the indicator's signals involves subjective judgment. Traders may have varying interpretations of overbought and oversold levels, as well as the significance of the volume-weighted RSI in relation to the traditional RSI. It is crucial to combine the indicator with personal analysis and trading experience to make informed trading decisions.
Remember, no single indicator can provide foolproof trading signals. The "Volume-Weighted RSI with Adaptive Smoothing" indicator serves as a valuable tool for analyzing price strength and volume dynamics. It can assist traders in identifying potential entry and exit points, validating trends, and managing risk. However, it should be used as part of a comprehensive trading strategy that considers multiple factors and indicators to increase the likelihood of successful trades.

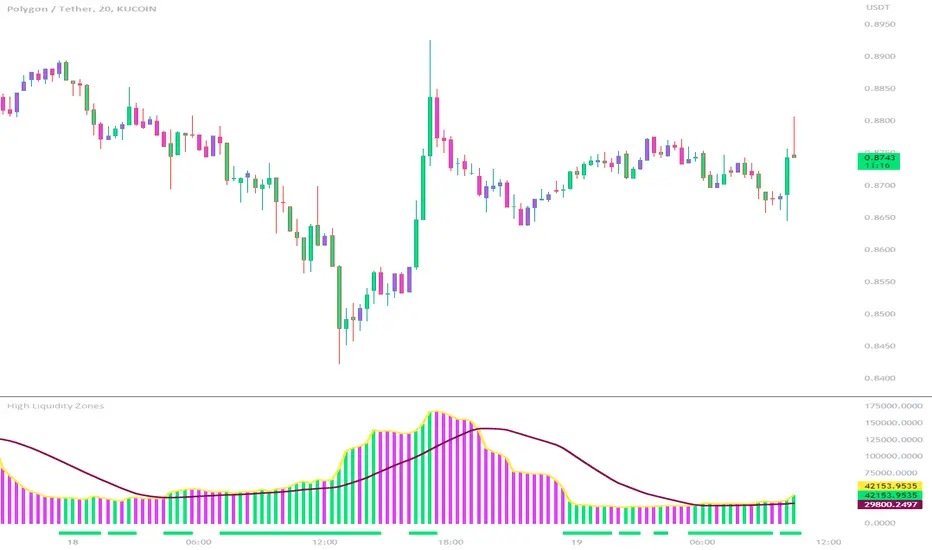
High Liquidity Zones and Threshold VolumeThe High Liquidity Zones indicator is designed to identify areas of significant liquidity in the market. It helps traders recognize regions where trading volume is notably higher, indicating potential areas of increased market activity and interest.
The indicator calculates the average volume over a specified lookback period, which can be customized according to individual preferences. This average volume acts as a reference point to determine the threshold volume level. The threshold percentage input allows users to set the sensitivity of the indicator, defining the minimum volume required for an area to be considered a high liquidity zone.
When the current volume surpasses the threshold volume level, the indicator highlights these areas as high liquidity zones. This visual representation allows traders to quickly identify and focus on periods of heightened trading activity. The high liquidity zones are marked with square shapes below the histogram, providing a clear visual indication on the chart.
The first plot line represents the threshold volume level as a histogram, showing the volume levels in relation to the threshold. This histogram helps traders assess the magnitude of the volume in the identified high liquidity zones.
The second plot line represents the threshold volume's simple moving average (SMA) over the lookback period. The SMA acts as a reference line, smoothing out fluctuations in the threshold volume and providing a more stable measure of high liquidity zones. Traders can use this line to better understand the overall trend and dynamics of liquidity.
The High Liquidity Zones indicator offers flexibility, allowing traders to adapt it to their preferred trading style and timeframe. By adjusting the lookback period and threshold percentage, users can fine-tune the sensitivity of the indicator based on their trading strategies and market conditions.
Furthermore, traders can combine the High Liquidity Zones indicator with other technical analysis tools to confirm trading signals or identify areas of potential support and resistance. It can help them locate price levels where market participants have a substantial presence and where significant buying or selling pressure may occur.
Overall, the High Liquidity Zones indicator is a valuable tool for traders seeking to gain insights into market liquidity dynamics. By highlighting areas of intense trading activity, it assists in making informed trading decisions and identifying opportunities within the market.
Normalized Elastic Volume Oscillator (MTF)The Multi-Timeframe Normalized Elastic Volume Oscillator combines volume analysis with multiple timeframe analysis. It provides traders with valuable insights into volume dynamics across different timeframes, helping to identify trends, potential reversals, and overbought/oversold conditions.
When using the Multi-Timeframe Normalized Elastic Volume Oscillator, consider the following guidelines:
Understanding Input Parameters : The indicator offers customizable input parameters to suit your trading preferences. You can adjust the EMA length (emaLength), scaling factor (scalingFactor), volume weighting option (volumeWeighting), and select a higher timeframe for analysis (higherTF). Experiment with these parameters to optimize the indicator for your trading strategy.
Multiple Timeframe Analysis : The Multi-Timeframe Normalized Elastic Volume Oscillator allows you to analyze volume dynamics on both the current timeframe and a higher timeframe. By comparing volume behavior across different timeframes, you gain a broader perspective on market trends and the strength of volume deviations. The higher timeframe analysis provides additional confirmation and helps identify more significant market shifts.
Normalized Values : The indicator normalizes the volume deviations on both timeframes to a consistent scale between -0.25 and 0.75. This normalization makes it easier to compare and interpret the oscillator's readings across different assets and timeframes. Positive values indicate bullish volume behavior, while negative values suggest bearish volume behavior.
Interpreting the Indicator : Pay attention to the position of the Multi-Timeframe Normalized Elastic Volume Oscillator lines relative to the zero line on both timeframes. Positive values on either timeframe indicate a bullish bias, while negative values suggest a bearish bias. The distance of the oscillator from the zero line reflects the strength of the volume deviation. Extreme readings, both positive and negative, may indicate overbought or oversold conditions, potentially signaling a trend reversal or exhaustion.
Combining with Other Indicators : For more robust trading decisions, consider combining the Multi-Timeframe Normalized Elastic Volume Oscillator with other technical analysis tools. This could include trend indicators, support/resistance levels, or candlestick patterns. By incorporating multiple indicators, you gain additional confirmation and increase the reliability of your trading signals.
Remember that the Multi-Timeframe Normalized Elastic Volume Oscillator is a valuable tool, but it should not be used in isolation. Consider other factors such as price action, market context, and fundamental analysis to make well-informed trading decisions. Additionally, practice proper risk management and exercise caution when executing trades.
By utilizing the Multi-Timeframe Normalized Elastic Volume Oscillator, you gain a comprehensive view of volume dynamics across different timeframes. This knowledge can help you identify potential market trends, confirm trading signals, and improve the timing of your trades.
Take time to familiarize yourself with the indicator and conduct thorough testing on historical data. This will help you gain confidence in its effectiveness and align it with your trading strategy. With experience and continuous evaluation, you can harness the power of the Multi-Timeframe Normalized Elastic Volume Oscillator to make informed trading decisions.

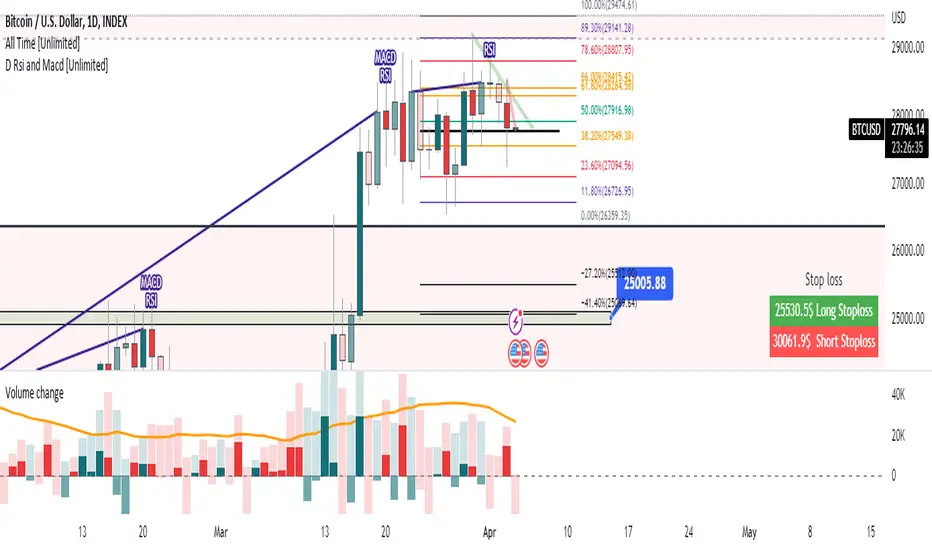
Volume change [ Unlimited ]This indicator displays volume and volume change information on a chart. It is designed to help traders analyze changes in trading volume over time and identify potential trading opportunities.
The indicator takes an input from the user to set the length of the exponential moving average (EMA) applied to the volume data. This EMA is used to smooth out short-term fluctuations in volume and highlight the overall trend in volume.
The indicator calculates whether the current bar is up or down and calculates the change in volume. It then sets the color of the volume and volume change columns based on whether the bar is up or down and whether the volume change is positive or negative.
By displaying this information on a chart, the indicator can help traders identify patterns or trends in volume and volume change that may indicate potential trading opportunities. For example, increasing volume along with rising prices could indicate strong buying pressure and a potential bullish trend, while decreasing volume along with falling prices could indicate weak selling pressure and a potential bearish trend.
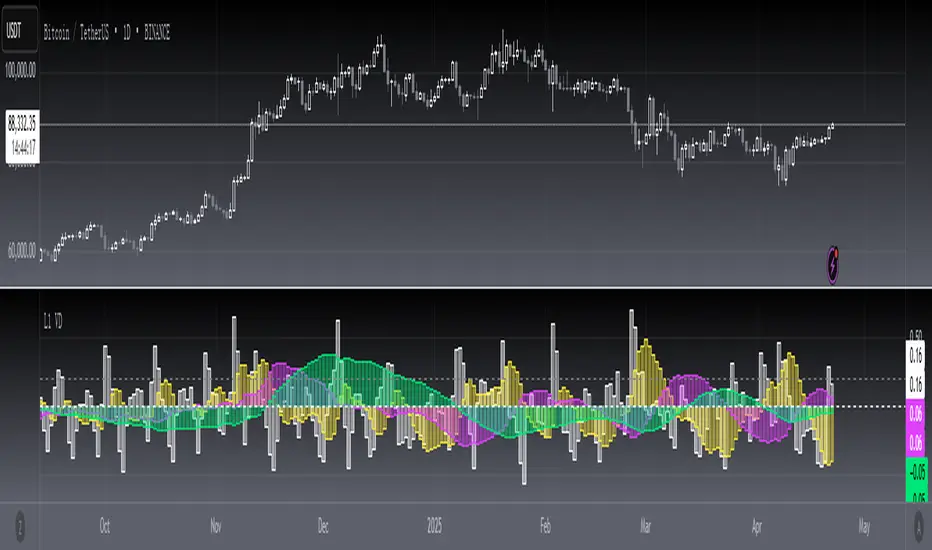
[blackcat] L1 Volume DynamicsLevel: 1
Background
Use the difference of Jurik MA and SMA equivalent (ALMA) to observe something new for volume.
Function
Trading volume is an important technical indicator that is not easy to see the law. I try to match the trading volume with the deduction theory, and the deduction double-average theory is matched with the measurement capacity. I will compare the two moving averages of ultra-short-term, short-term, medium-term and long-term. The faster moving average I choose is Jurik MA (JMA), because it is faster than EMA under the same parameters, and the smoothing effect is very good. In addition to the slow moving average, I use ALMA to benchmark SMA. Because the smoothing properties of ALMA are better. A law is used here, that is, the equivalent relationship between ALMA and SMA is approximately a Fibonacci sequence. I can dynamically apply this amount to the Bitcoin market and see some interesting phenomena.
What is double average volume? According to normal circumstances, JMA will follow the transaction volume faster than SMA. The transaction volume is normally rising above the double average volume, and the transaction volume is normally falling below the double average volume. When the SMA follows the trading volume faster than the JMA, it is abnormal (usually occurs in the divergence segment), that is, the JMA is above the SMA, but the trading volume is below the SMA (the bottom divergence volume pile), the top divergence volume pile is the opposite process. The trading volume is between the double average volume, which is the finishing volume energy. It can be used in the breakthrough of the box and the bottom of the pot. By comparing the strength of the current trading volume with the strength of the trading volume on the upper edge of the box or bottom structure, it can improve the success rate of predicting the breakthrough, especially for the observation effect of large funds latent.
Remarks
Feedbacks are appreciated.
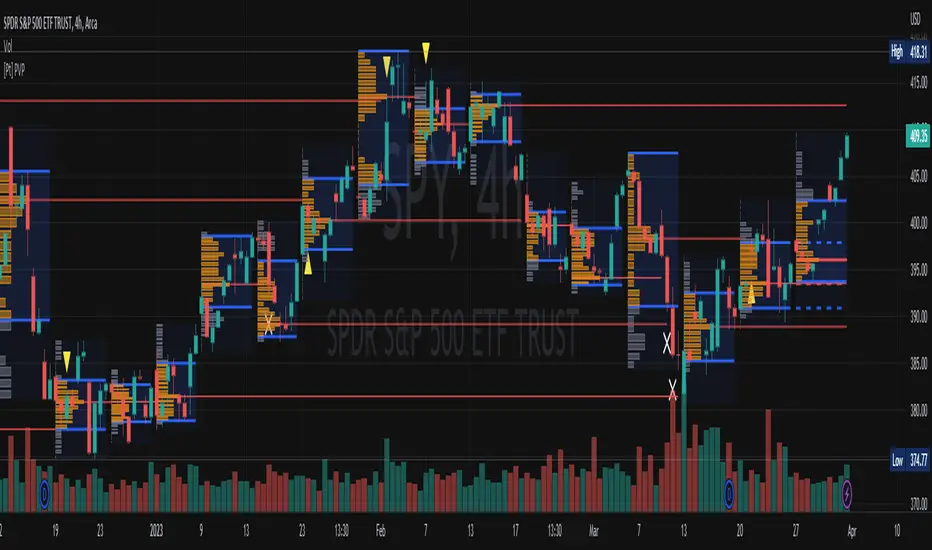
[Pt] Periodic Volume ProfileThis script is an attempt to recreate the Periodic Volume Profile that is built-in by TradingView, with slightly different features. Related blog: www.tradingview.com
This script is based on another script "Volume Profile, Pivot Anchored" by @dgtrd
*Note that only limited number Volume Profile can be displayed on the chart due to limitations on displaying boxes and lines.
Description
This Periodic Volume Profile (PVP) indicator allows trades to view volume profiles for periods longer than the current timeframe. The indicator builds one general volume profile for each new period, set by the user through the “Periodic Timeframe” input parameter.
This script also has the option to extend Point of Control (POC) lines with optional end conditions: Until Bar Touch, Until Last Bar, Until Bar Cross, or None, which extends to the right.
Signals are generated for Naked POC touches and crosses by a triangle symbol and a cross symbol, by default.
Alerts are available for POC touches and crosses.
What is Volume Profile?
Volume profile is a technical analysis tool that shows the volume of trades at different prices for a given security or market over a specific period of time.
Volume profile can be used to identify key levels of support and resistance, as well as to assess the overall supply and demand for a security. For example, if there is a high volume of trades at a particular price level, this may indicate that there is a significant level of support or resistance at that price. On the other hand, if there is relatively low volume at a particular price, this may indicate that there is not much interest in trading at that level.
Traders can use volume profile to identify trends, make trading decisions, and set stop-loss and take-profit orders. It can also be useful for identifying patterns such as "pockets of liquidity," which are areas where there is a high volume of trades but relatively little price movement.
It is important to note that volume profile should be used in conjunction with other technical analysis tools and should not be relied upon in isolation. It is also important to consider the overall context and market conditions when interpreting volume profile data.
Key Difference with TradingView's PVP indicator - TradingView's PVP intraday period does not align with standard intraday timeframes as it is determined by # of bars. This script provides volume profiles that aligns with higher timeframe periods.
Enjoy~!
Market sessions and Volume profile - By LeviathanThis script allows you to keep track of Forex market sessions (Tokyo, London and New York), as well as Daily, Weekly and Monthly sessions. All of them are accompanied by Volume Profile options where you can view VP Histogram, Point of Control, Value Area High and Value Area Low.
Colors, lines and other design preferences are fully customizable.
* Volume Profile of shorter sessions (eg. Tokyo, London, New York) works better when using lower timeframes such as 15min, 5min, etc.
** Use timeframe higher than 15min when viewing Monthly sessions
Indicator settings overview:
SESSION TYPE
- Tokyo session (1:00 - 9:00 UTC/ GMT )
- London session (7:00 - 16:00 UTC/ GMT )
- New York session (13:00 - 22:00 UTC/ GMT )
- Daily session
- Weekly session
- Monthly session
DISPLAY
- Show Volume Profile (Show or hide Volume Profile histogram)
- Show POC (Show or hide Point Of Control line)
- Show VAL (Show or hide Value Area Low line)
- Show VAH (Show or hide Value Area High line)
- Show Live Zone (Show or hide the ongoing session)
VOLUME PROFILE SETTINGS
- Resolution (The higher the value, the more refined of a profile, but less profiles are shown on the chart)
- Smooth Volume Data (Useful for assets that have very large spikes in volume over large bars, helps create better profiles)
APPEARANCE
- Up Volume color (Pick a custom color for up/ bullish volume profile nodes)
- Down Volume color (Pick a custom color for down/ bearish volume profile nodes)
- POC color and thickness (Pick a custom color and thickness for Point Of Control line)
- VAH color and thickness (Pick a custom color and thickness for Value Area High line)
- VAL color and thickness (Pick a custom color and thickness for Value Area Low line)
- Session box thickness (Pick a custom thickness for the session box. Color is provided automatically with optimal contrast)
** Some VP elements are inspired by @LonesomeTheBlue's volume profile script

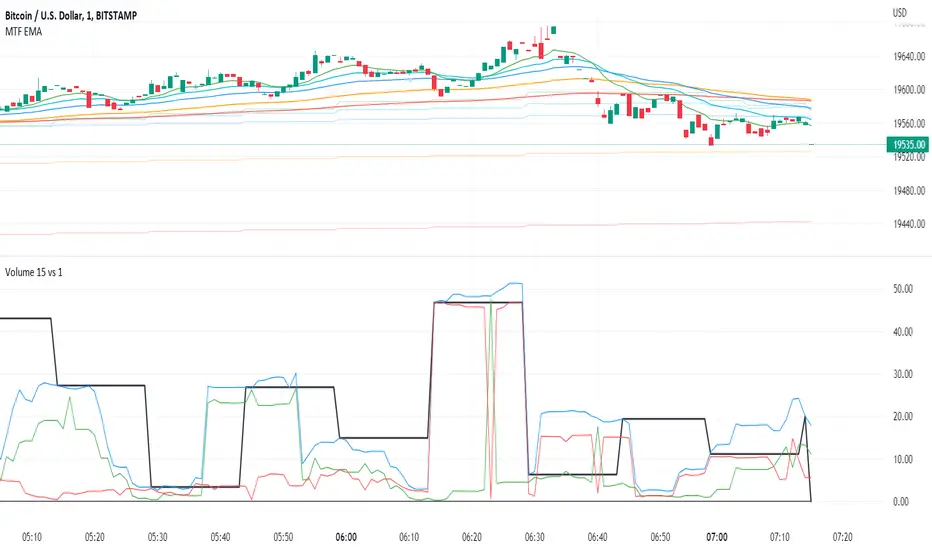
Volume 15m vs 1m*Up/Down Volume Indicator
This indicator plots the 15m volume (black line) on the 1m chart alongside the sum of 1m volume for 15m (blue line).
This indicator allows us to see the raw data that will generate the 15m volume before it occurs.
Next it seperates up period volume (green line) from down period volume (red line) so that we can see how much of each was responsible for the total volume.
The black line will dance for 15m at a time but if the blue line rises above the locked in section of the black line (to the left), then the next 15m volume will be higher than the last.
Also, if the green line is higher than the red, we know that up volume is driving of the increase.
*Volume Sum Indicator
This indicator allows us to track the volume trend even when volume is near zero.
This indicators sums the 15m volume for 13 periods to represent 200 minutes worth of volume.
Then it plots the sum of 1m up volume for 200 periods and the 1m down volume for 200 periods.
When green is over red, the volume is trending up.
Blue is the total 1m volume for 200 periods. It should act as a resistance line since it is unusual for 100% of volume to be up volume or down volume.
This indicator only works on the 1m chart. The higher timeframe must be set to 15m. If anyone knows how to make this indicator work on any timeframe that would be great!
Volume SpikesShows volume spikes over a certain threshold, using a symbol's volume moving average as the baseline. Offers a few different filters regarding candle shapes and types, in an attempt to catch quick moves on extremely low timeframes (sub-1m).
Ultimately I would like to integrate this logic into an indicator that contains automated stop raid/inducement detection.

High volume zone█ OVERVIEW
Show high volume zone in a lower timeframe.
█ CONCEPTS
1- Choose an amount of volume (1 000 by default)
2- Choose a timeframe (1 minute by default)
3- It highlight every zone where volume was > 1000 in less than one minute
█ OTHER SECTIONS
Limitation:
- Unfortunately, I didn't find a way to make it in a lower timeframe than 1 minute with Pinescript
- It is truncate by minute so a high volume between two lower tf candles may not be count
If you have a solution for these, glad to hear it.

Volume Profile PremiumHello, my friends, this is a new fine-grained volume profile indicator. As is known to all, the volume profile indicator is a charting tool that shows how much volume has occurred at each price throughout the trading session. The volume profile indicates the prices favored by the market or those ignored by the market, which can give traders clues as to where prices are likely to go shortly.
(1) Indicator description
This indicator is based on the function "request.security_lower_tf". See the related usage note for details if you need it.
Support for obtaining volume from a lower timeframe than the current chart and calculating a more fine-grained volume distribution
Due to the increased complexity of the calculation, you need to set a reasonable timeframe to avoid calculation timeout.
(2) Key parameters
- Support/Resistance Clustering
Max of Lookback Forward: The maximum number of historical K-lines
Min Resolution (Minute): lower timeframe, unit: minute
Display Volume Profile: ways to display volume profile
Rows of Volume Profile: rows of volume profile
Placement of Volume Profile: location of volume profile
Width of Volume Profile: width of volume profile
Horizontal Offset: horizontal offset of volume profile
Happy trading, and enjoy your life!
————————————————————————————————————————
各位朋友大家好,这是一个具有更高细粒度的成交量分布指标。众所周知,成交量分布是一种图表分析工具(或指标),它显示了在整个交易时段内每个价格上发生了多少成交量。 成交量分布指出了受到市场青睐的价格以及被市场忽略的价格,这可以为交易者提供有关近期价格可能走向何方的线索。
(1) 指标说明
该指标基于 request.security_lower_tf 函数,详情可以查看相关使用说明
支持从比当前图表分辨率更低的时间周期获取成交量,并计算更加细粒度的成交量分布
由于增加了计算复杂度,您需要设置合理的时间周期以避免计算超时
(2) 关键参数
- Volume Profile Parameters
Max of Lookback Forward: 用于统计成交量分布的最大回顾的K线数量
Min Resolution (Minute): 细粒度的时间周期
Display Volume Profile: 展示成交量分布的方式
Rows of Volume Profile: 成交量分布的行数
Placement of Volume Profile: 成交量分布的位置
Width of Volume Profile: 成交量分布的宽度
Horizontal Offset: 成交量分布的水平偏移
祝大家交易愉快

Volume OximeterOVERVIEW
The Volume Oximeter (VOXI) is a technical indicator that gauges the amount of volume currently present in the market, relative to the historical volume that was present before. The purpose of this indicator is to filter out with-trend signals during ranging/non-trending conditions.
CONCEPTS
This indicator assumes that trends are more likely to start during periods of high volume, compared to during periods of low volume. This is because high volume indicates that there are bigger players currently in the market, which is necessary to begin a sustained trending move.
So, to determine whether the current volume is "high", it is compared to an average volume for however number of candles back the user specifies.
If the current volume is greater than the average volume, it is reasonable to assume we are in a high volume period. Thus, this is the ideal time to enter a trending trade due to the assumption that trends are more likely to start during these high volume periods.
The default values in the indicator are designed for use on the daily chart but can be applied to any timeframe.
The default volume lookback period is 259 since there are usually 259 daily candles in a year on Forex daily charts. This means that the average volume will represent the average volume over the past year. This would be 365 on Crypto daily charts, since the Crypto is open 24/7 instead of 24/5). This is what the current volume will be compared to.
The default smoothing lookback period is 10, but this can be adjusted depending on the indicator that's giving you your with-trend signals. After my backtesting, 10 was the best value for my with-trend indicator, so you should do your own testing to see which value works best with your with-trend indicator.
HOW DO I READ THIS INDICATOR?
If the VOXI line is above or equal to zero (indicated by the blue color), the current volume is greater than the historical average volume.
This is a good time to take with-trend signals since high volume is necessary for sustained trending moves to begin.
If the VOXI line is below zero (indicated by the red color), the current volume is less than the historical average volume.
This is a good time to ignore with-trend signals since an absence of volume indicates that there aren't big market participants to participate in a new trending move.

Volume Filtered *All Candlestick Patterns* [KT] Hello!
This script uses TradingView's *All Candlestick Patterns* indicator and includes a volume filter.
The frequency of each candlestick pattern is recorded in addition to the subsequent session's outcome - higher or lower close.
The requisite volume for the pattern is configurable; formations will not be distinguished when volume is less than the defined lower threshold.
For example, setting the volume threshold to 10% forces the script to identify candlestick patterns in which volume for the session (candle) is 10% greater than the volume moving average. All candlestick patterns with volume less than (1.10 * volume MA) are discounted.
The script counts the frequency of each pattern - the number of times the pattern occurred - in addition to the next candle's outcome.
Pertinent statistics are displayed in the table, which can be hidden.
I plan on working on the script quite a bit more; please comment a suggestion if you have one! What else should be included?

Uniform Volume ProfileUniform Volume Profile
The volume of a single candlestick is uniformly distributed by its range (high - low) along all the colliding volume profile bars.
For example, if a 10% of a candlestick intersects some volume bar (horizontal line) only the 10% of that candlestick volume will contribute to that profile.

Volumetric colored candles with matching pivot point linesCandles are split into 10 categories based on their volume, and can be changed in the options. By default and in the images, white is very high volume, reds are high volume, yellows are medium volume, greens are low and dark-grey is very low.
Adjustments for scale are included in the options. The Magnitude option is a 10x multiplier, so 1=10, 2=100, 3=1000, etc., up to 9. There is also a Multiplier selection option where 1=1, 2=2, 3=3, 4=4, etc.
To attenuate for a given chart, these multipliers will need to be changed. In general, all white means you need to increase the Magnitude and all dark-grey means you need to decrease the magnitude. Somewhere between those two, the Multiplier can be used for further calibration. All this color coating is relational, like a spectrum. As you adjust you will see them maintaining their proportions as the candles switch color (ex. green become yellow while yellow becomes red).
I have also included pivot lines that follow the same logic for color coding. Two options exist for adjusting the pivot high and pivot low points respectively. They do not always correspond to the exact color of the candle producing them, but they should be a rough average (ie. red and green bars making yellow lines). They make for good indicators of how much liquidity may be at a certain support/resistance level. The lines can also be turned off altogether.
If your candles aren't looking right, go to settings of both regular candles and heikin-ashi, and uncheck both border and wick.
I still have some code to clean up and I plan on expanding upon this study. If you like my work consider tipping!

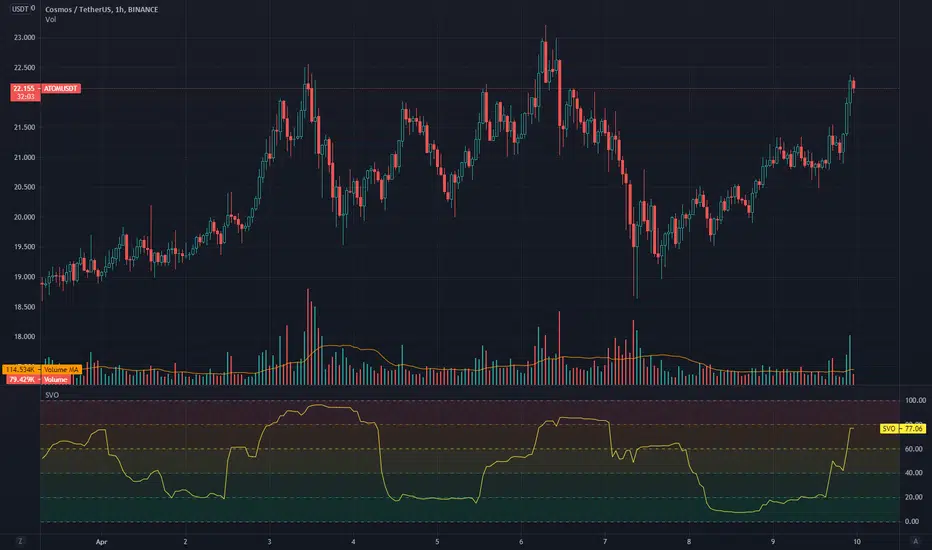
Simple Volume Oscillator (SVO), by @BlueJayBirdSimple Volume Oscillator, or SVO. I came up with this idea while studying Spread Volume Analysis (SVA). It uses the Trading View's built-in RSI function to simplify volume values for further interpretation.
// -------------------- ENGLISH, Inglés
How to Use:
- When there's little volume activity, expect the oscillator to be closer to the zero line.
- Wait for a probable sudden increment up to close 100 when volume enters into the market.
- It works pretty much as a volatility oscillator, but it eliminates the noise of the price, and the noise of the volume bars, always so vertical and linear, which sometimes are hard to understand at first glance.
- As any oscillator, it suffers from some lagging when compared to the price action, but for the most part is pretty accurate.
- Remember the cyclical nature of markets: If things are quite, something is coming.
- NOTE: The oscillator WILL NOT indicate market direction, that bias is up to the analyst to find out.
- Like. Follow. Comment.
// -------------------- SPANISH, Español
Cómo usar:
- Cuando hay poca actividad de volumen, el oscilador debería estar cercano a cero.
- Esperá por un posible incremento repentino hasta 100 cuando entre volumen en el mercado.
- Funciona de manera similar a un oscilador de volatilidad, pero elimina cualquier ruido del precio, y el ruido de las barras de volumen, siempre tan verticales y lineales, lo que las hace difícil de descifrar a simple vista.
- Como cualquier oscilador, sufre de un ligero retraso respecto de la acción del precio, pero por lo demás, es bastante preciso.
- Recordá la naturaleza cíclica de los mercados: Si las cosas están quietas, es porque algo está por suceder.
- NOTA: Este oscilador NO VA A decirte qué dirección va a seguir el precio; eso es algo que vas a tener que descubrir por tu cuenta.
- Like, seguí, comentá.
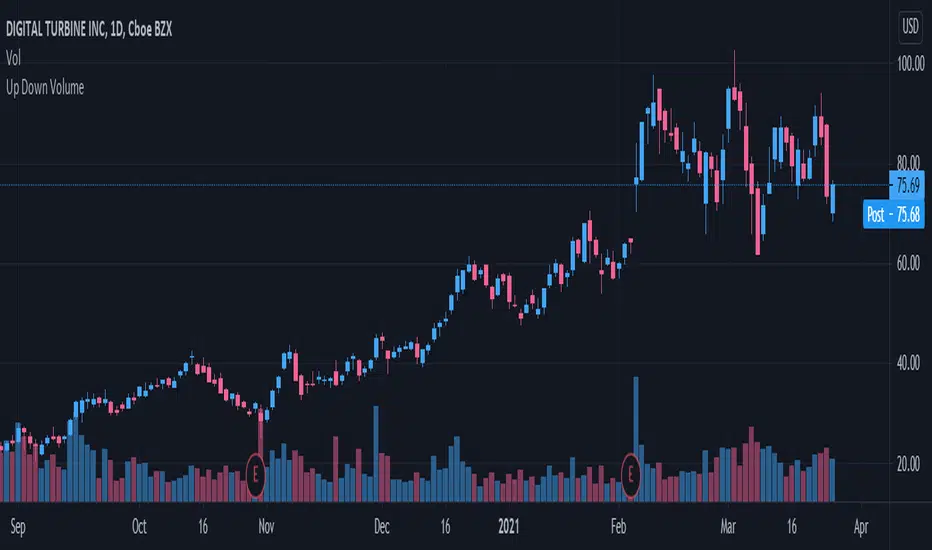
Up/Down Volume RatioUp/Down Volume Ratio is calculated by summing volume on days when it closes up and divide that total by the volume on days when the stock closed down.
High volume up days are typically a sign of accumulation(buying) by big players, while down days are signs of distribution(selling) by big market players. The Up Down volume ratio takes this assumption and turns it into a tangible number that's easier for the trader to understand. My formula is calculated using the past 50 periods, be warned it will not display a value for stocks with under 50 periods of trading history. This indicator is great for identify accumulation of growth stocks early on in their moves, most of the time you would like a growth stocks U/D value to be above 2, showing institutional sponsorship of a stock.
Up/Down Volume value interpretation:
U/D < 1 -> Bearish outlook, as sellers are in control
U/D = 1 -> Sellers and Buyers are equal
U/D > 1 -> Bullish outlook, as buyers are in control
U/D > 2 -> Bullish outlook, significant accumulation underway by market makers
U/D >= 3 -> MONSTER STOCK ALERT, market makers can not get enough of this stock and are ravenous to buy more
U/D values greater than 2 are rare and typically do not last very long, and U/D >= 3 are extremely rare one example I kind find of a stock's U/D peaking above 3 was Google back in 2005.
MAKE SURE TO HIT THE SETTINGS WHEEL AND CHECK THE BOX NEXT TO PLOT IN ORDER TO GET RID OF THE PLOTTED LINE.
Open-source Buy and Sell VolumeVersión open source de scripts anteriores / Open source version of previous scripts
Confío en que esta vez no esté violando ninguna de las reglas...
A pesar de que el volumen simplemente son operaciones que se realizan en un determinado espacio de tiempo, este indicador intenta separar dentro de una vela el volumen de compra y de venta.
Una vez separado el volumen de cada vela el indicador se calcula en base a la media simple (larga) menos la media exponencial (corta)
Los puntos azules indican posibles zonas de soporte o resistencia.
----------------------------------------------------------
Although the volume is simply operations carried out in a certain period of time, this indicator tries to separate the long and short volume into a candle.
Once the volume of each candle is separated, the indicator is calculated based on the simple average (long length) minus the exponential average (short length)
The blue dots indicate possible areas of support or resistance.

Day's Buy Sell Volume label
This indicator looks simple but it was bit tricky to code and to make it work on all time frames .
I have used array in this to showcase the use of array, array give you more flexibly.
It works on all time frame 1m 2m 3m 5m 10m 15m 30m 60m 120m.
When the time frame is greater than the or equal to "D" it will show the current bar volume only.
Total volume is made up of buying volume and selling volume. Buying volume is the number of shares, contracts, or lots that were associated with buying trades, and selling volume is the number that were associated with selling trades.
This indicator shows two labels green one is showing the buying volume of the current day and the red label is showing the selling volume of the current day.
I am making this code available to all.
This code is for Total volume is made up of buying volume and selling volume. Buying volume is the number of shares,
contracts, or lots that were associated with buying trades, and selling volume is the number that were associated with selling trades.
//thanks to @Doc6272 who asked to make this indicator Label

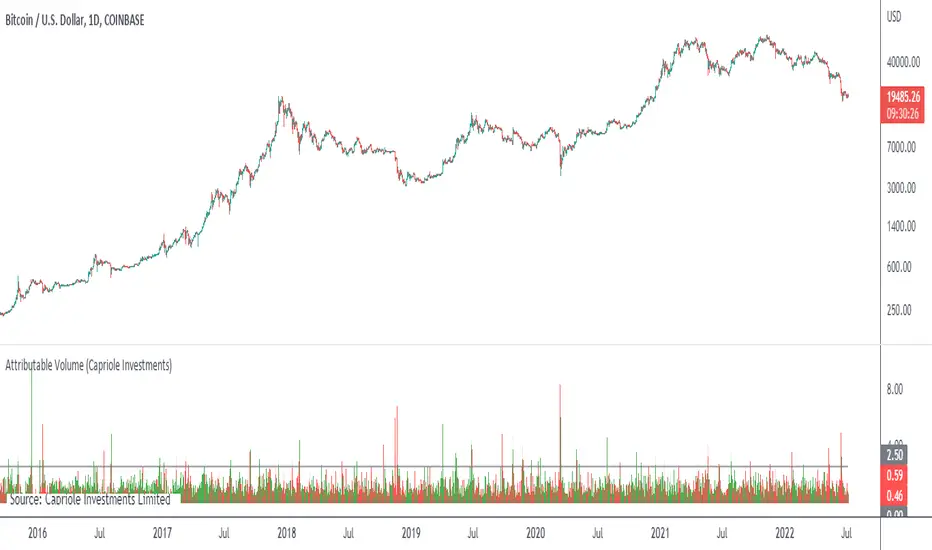
Attributable VolumeA volume indicator which calculates "Attributable Volume”, the portion of volume which contributed to the direction in which the candle moved.
Attributable Volume is calculated as: Total volume excluding the "counter wick" volume.
Where for a green (up) candle, the "counter wick" volume is the top wick volume.
In theory, Attributable Volume should better represent the effort of directional thrust of each candle.
By default, this indicator displays “Attributable RVOL”, but can be set to:
Attributable RVOL
RVOL
Attributable Volume
Volume
Note: RVOL = Relative Volume, the current volume divided by the Volume moving average. RVOL can be used to identify major moves, and potential starts/ends to trends.