Import Forex Volume from 5 biggest FX Brokers (single/combined) Some Brokers like Forex.com don't show Volume for FX. This indicator allows user to import Volume from a range of FX brokers that DO show volume
-Combine the reported volumes from all five brokers: FXCM, GLOBALPRIME, PEPPERSTONE, Currency.com, OANDA. Or pick a specific broker to import volume from.
-Image above shows combined Volume from the big 5 brokers, with added notes on the 2yr average of various broker's volumes; showing their size in descending order.
-Works across timeframes & FX pairs. Standard color formatting options Added.
//notes:
~default settings pull/combine volume from all 5 brokers. History goes back to Sept 2019 (due to GlobalPrime's later start date in publishing Volume data).
~~toggle ON 'only show FXCM, Pepperstone & Oanda' for a LONGER history, going back to June 2012.
~individual broker feeds: top checkbox toggled OFF, choose your preferred broker.
~~FXCM has both the longest history and the highest volume size of all the brokers.
~Table (toggle on/off) shows the broker feed (which broker(s) volume is on display) and the SMA 100 to give an idea of relative size.
//Cautionary note:
Volume is not as reliable in Forex as it is in Equities/commodities, due to unreported Inter-bank trades; the broker volumes do not give the full picture, but this is a best approximation of combined total volume based on brokers reported volume. The true volume will likely be much higher.
-Thank you @theEccentricTrader for the idea of pulling volume feed from other brokers.
"volume" için komut dosyalarını ara

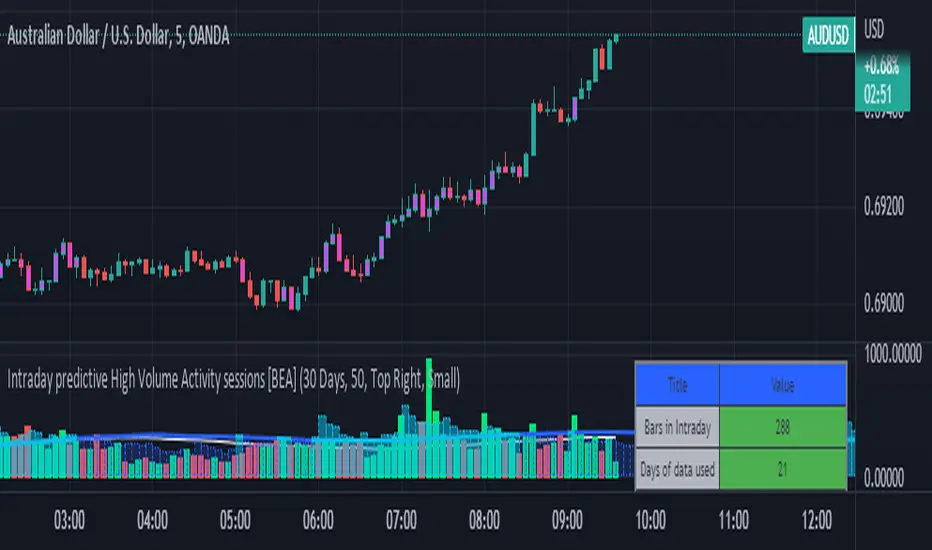
Intraday predictive High Volume Activity sessions [BEA]Idea:
This indicator is designed to know the high traded volume sessions in advance before the day starts.
The predictive volume bars will be plotted in advance once a new trading session starts.
Logic Used:
The basic idea is to store each bar volume / Volume MA data for the selected time. So, the first bar of each data is stored for all selected historical days.
Once the data is stored, I am taking average of each bar data for the selected Historical days.
How to Use:
This gives me an idea of the volume behavior throughout the days based on historical data. So I decide my time of trading for that specific times sessions where the traded volume activity is high.
The bars which are more than the Moving average ( Highlighted Volume bars plotted in future ) is the time session to focus.
Designed only for intraday timeframes.
Here in the image, you can see the session in advance for high traded volume activity.
Try it test it , let me know if it can be improved further.
Have a happy trading.
DISCLAIMER
Any and all liability for risks resulting from investment transactions or other asset dispositions carried out by the user based on information received or a market analysis is expressly excluded by me.
All the information made available here is generally provided to serve as an example only, without obligation and without specific recommendations for action. It does not constitute and cannot replace investment advice. We therefore recommend that you contact your personal financial advisor before carrying out specific transactions and investments.
Do your own research, this is not a financial advice.
Effective Volume (Willain)This is the Effective Volume using the Average Separation Method
Excerpt:
The most obvious way to separate Large from Small Effective Volume is to calculate the per-minute average Effective Volume exchanged for all the
minutes of the day where a price inflection was found. The volume above that average is called Large Effective Volume (pg. 67)
Looks at the Close(n) to Close(n-1)/h-c*vol and registers it if its above 30% of total volume.

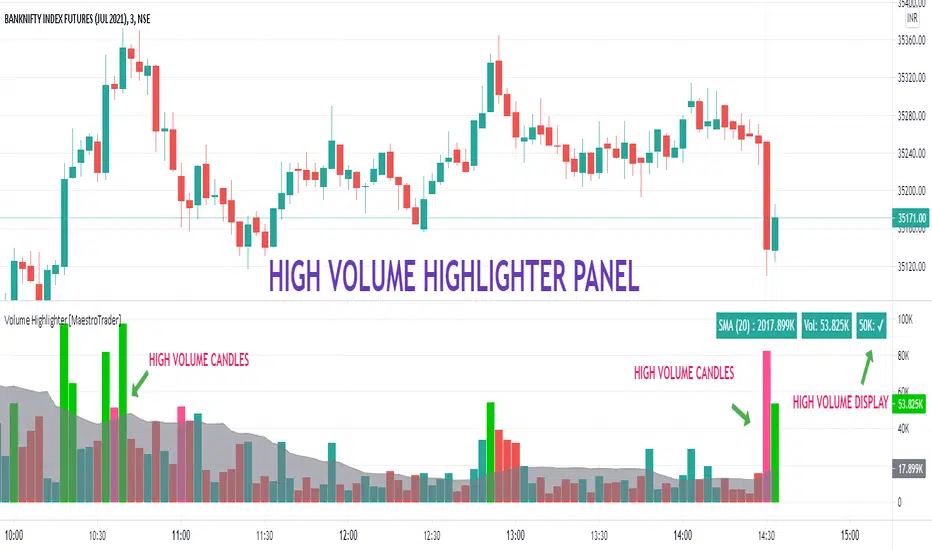
VOLUME HIGHLIGHTER PANEL (CUSTOM) [MaestroTrader]█ OVERVIEW
Volume highlighter panel provides volume insights to identify gradual increase or drop in volume or sudden volume urge that exceeds daily threshold.
It helps to determine the price behavior of the underlying Index/stock to make informed decisions while trading.
█ FEATURES
a) Displays Live SMA (20) Volume with color code. SMA Cells turns green if consecutive bar volume increases.
b) Live Volume Cell in table turns green if the volume is above average and turns red vice versa.
c) Threshold volume label appears when volume crosses the daily threshold limit.
Differences with the built-in version
This variation displays volume panel with additional volume insights for quick entry/exits.
█ SETTINGS
• Highlight Panel a) Configure Daily Volume Threshold b) configure Market session time c) Toggle highlighter on/Off d) Toggle Time on/Off (off) displays for whole period
• Volume Panel a) Configure SMA b) configure volume bar criteria c) configure Panel Display Location d) Toggle Volume Panel on/Off
█ IMPORTANT
Price always moves from trending to trading phase. Volume in Trending phase is generally high compared to volume in sideways phase. You need to identify the right volume threshold in each of the trading phases and change the settings accordingly.
█ BANKNIFTY /NIFTY VOLUME SETTINGS
BANKNIFTY - 3 MIN -50K volume
NIFTY - 3 MIN 125 K volume
Thanks to OSPL Siva for Nifty/Bank Nifty volumes. These volumes differ from trending phase & consolidation phase so adjust the threshold settings accordingly.
█ THANKS
Thanks a lot to Pine Team for this new great feature table & ‘ format. Volume ’ ! Thanks to @author=LucF, for the 'volume' logic.
█ DISCLIAMER
Indicator is built for educational purposes. Please test it thoroughly before you start using it.
You are free to use the code, please share the credit for reuse.
Hope - All these features help you get quick insights of the price movement to take the informed trades.
Happy Trading !!
Best Bulls Bears Volume trend Breakout V2 [badshah_e_alam]This is a intraday indicator. Only to be used on timeframe less than daily charts.
This indicator purely uses volume to plot the graph. The indicator helps in conforming a breakout strategy.
This indicator is advanced version of my previously developed indicator you can check this link
Total volume is made up of buying volume and selling volume . Buying volume is the number of shares, contracts, or lots that were associated with green bars, and selling volume is the number that were associated with red bars.
The labels on the right side are the current bar value and that days bulls /bears weightage.
the first value shows the current bar volume.
second value show the bulls weight in %
third value show the bears weightage throughout the day ( %)
The Blue plot in graph keeps the track of bulls movement in intraday( %)
The Red plot in graph keeps the track of bears movement in intraday ( %)
X axis is time.
Y axis ranges from 100 to -100
I use 1:2 risk to reward ratio. Do your own research.
**not a financial advice**
Example of price increasing, volume decreasing
this indicator can be used for confirming a breakout strategy with bulls or bears in action. In the current example, the buyer’s volume percentage is reducing and the price is increasing throughout the day. Hence a breakout of the trendline is confirmation of a short trade.
Example of Price reducing, volume decreasing
example of price moving down , bears losing the grip
Example of price decreasing volume increasing
Thanks to nizar9599 for giving idea to improve my previous indicator.
DISCLAIMER
Any and all liability for risks resulting from investment transactions or other asset dispositions carried out by the user based on information received or a market analysis is expressly excluded by me.
All the information made available here is generally provided to serve as an example only, without obligation and without specific recommendations for action. It does not constitute and cannot replace investment advice. We therefore recommend that you contact your personal financial advisor before carrying out specific transactions and investments.
Do your own research, This is not a financial advice.

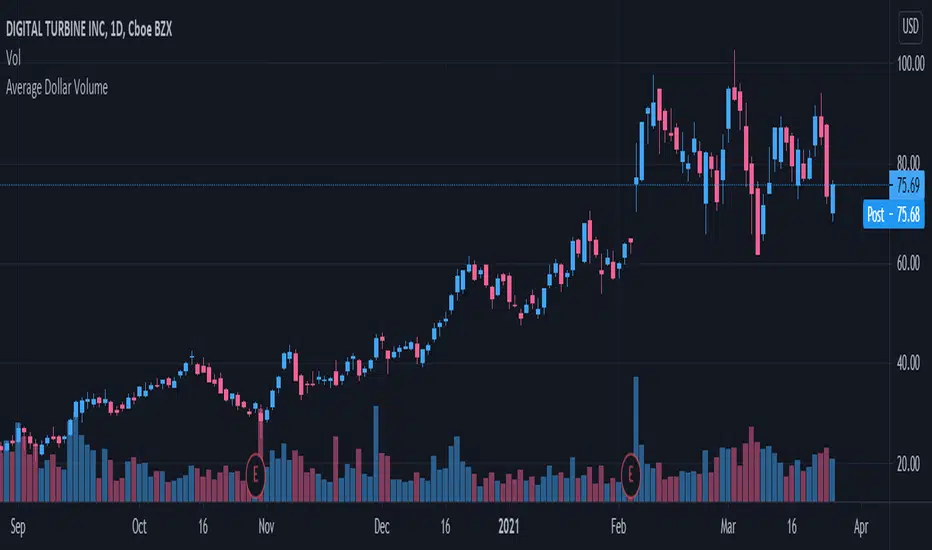
Average Dollar VolumeDollar volume is simply the volume traded multiplied times the cost of the stock.
Dollar volume is an extremely important metric for finding stocks with enough liquidity for market makers to position themselves in. Market Liquidity is defined as market's feature whereby an individual or firm can quickly purchase or sell an asset without causing a drastic change in the asset's price. The key concept you want to understand is that these big instructions with billions of dollars need liquidity in a stock in order to even think about buying it, and therefore these institutions will demand a large dollar volume. A good dollar volume amount, that represents a pretty liquid name, is typically above 100 million $ average. Why are institutions important? Simple because they are the ones who make stocks move, and I mean really move. If you want to see large growth from a stock in a short amount of time, you need institutions wielding billions of dollars to be fighting one another to buy more shares. Institutions are the ones who make or break a stock, this is why we call them market makers.
My script calculates average dollar volume using four averages: the 50, the 30, the 20, and the 10 period. I use multiple averages in order to provide the accurate and up to date information to you. It then selects the minimum of these averages and divides this value by 1 million and displays this number to you.
TL;DR? If you want monster moves from your stocks, you need to pick names with average high liquidity(dollar volume >= $100 million). The number presented to you is in millions of whatever currency the name is traded in.
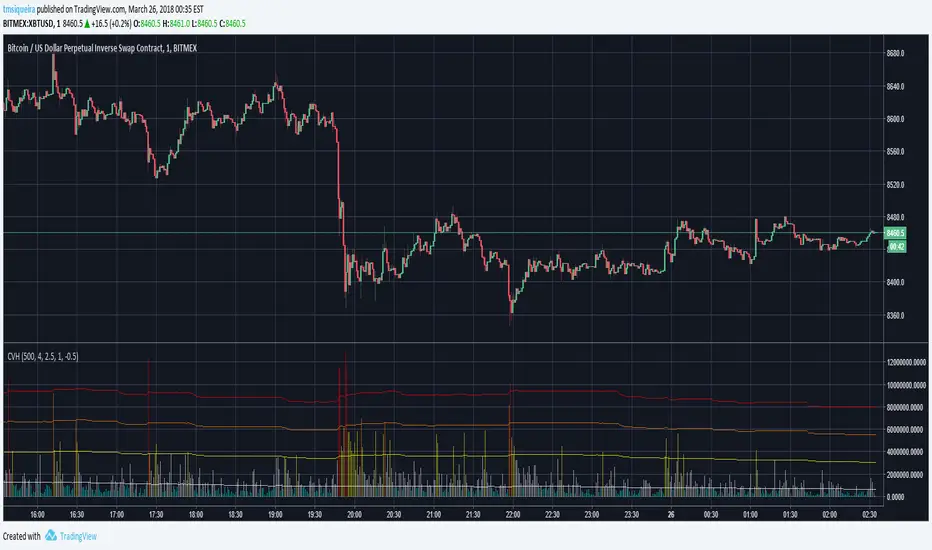
Colored Volumes HistogramThis colored volumes histogram uses standard deviation from the mean to color bars.
I prefer use large Length input for more stability at mean and standard deviation values.
Uses 5 colors, by default:
Red = Volume >= 4 stdev;
Orange = 4 stdev > Volume >= 2.5 stdev;
Yellow = 2.5 stdev > Volume >= 1 stdev;
White = 1 stdev > Volume >= -0.5 stdev;
Aqua = -0.5 stdev > Volume.
I coded another script, called "Volumes on Candles". It uses the same idea, but color directly the candle.
Big Notional Volume Bubbles (Lower-TF Order Flow Approximation)Big Notional Volume Bubbles (Lower-TF Order Flow Approximation)
### Overview
This indicator visualizes large notional trading activity by scanning lower-timeframe candles inside each chart bar and highlighting periods where unusually high traded value (volume × price) occurs.
This script is intended to help short-term traders and scalpers identify bursts of aggressive activity, potential absorption zones, and areas of heightened participation, using standard OHLCV data.
Important: This indicator does not access true market order tape or DOM data. It is an approximation based on lower-timeframe OHLCV data provided by TradingView.
What the Indicator Shows
Each bubble represents a lower-timeframe candle where traded notional value exceeds a user-defined threshold.
Bubble size scales with the notional value of that candle.
Green bubbles indicate the lower-timeframe candle closed higher (buy-side pressure approximation).
Red bubbles indicate the lower-timeframe candle closed lower (sell-side pressure approximation).
Bubbles can be plotted at candle closes or wick extremes for contextual analysis.
How It Works
1. Lower-timeframe OHLCV data is requested using `request.security_lower_tf`.
2. Notional value is calculated as volume × price for each micro-candle.
3. The script selects the largest notional events per bar that exceed the minimum threshold.
4. These events are rendered as bubbles on the main price chart.
Intended Use Cases
Scalping and short-term trading
Momentum ignition and continuation analysis
Absorption and failed breakout detection
Effort versus result analysis
Confirmation at key structural levels
Recommended Settings
Lower timeframe: Start with 1 (1 minute). Seconds-based timeframes may not be supported on all feeds.
Minimum notional (USD/USDT):
BTC / ETH: 25,000 – 250,000
Mid-cap assets: 5,000 – 50,000
Adjust based on liquidity and volatility
Max bubbles per bar: 3–8 to avoid visual clutter
Limitations
This indicator does not display individual market orders or aggressor-side execution.
Buy/sell classification is inferred from candle direction, not bid/ask data.
Lower-timeframe data availability depends on the selected symbol and exchange feed.
This tool should not be used as a standalone signal generator.
Best Practices
Use in conjunction with market structure, VWAP, and key price levels.
Focus on price behavior after a bubble appears rather than the bubble itself.
Interpret bubbles as areas of interest, not directional guarantees.

Turnover (Volume * HLC/3)Let's get the elephant out of the room. Everyone knows volume is the key to validate price movement, but you can't compare two volume candles of the same stock when the price is 3 times different you need to account for that. So here it is, Turnover chart, to replace volume entirely, because why would you look at volume when you can look at turnover instead?

Cumulative Volume Profile DeltaThis indicator calculates the Cumulative Volume Profile Delta (CVPD). It constructs a high-resolution volume profile for each bar using intra-bar data, then derives and accumulates the delta from that profile to show net buying/selling pressure.
Key Features:
Statistical Volume Profile Engine: For each bar, the indicator builds a high-resolution volume profile on a lower 'Intra-Bar Timeframe'. Instead of simple tick counting, it uses statistical models ('PDF' allocation) to distribute volume across price levels and advanced classifiers ('Dynamic' split) to determine the buy/sell pressure before accumulation.
Periodic Accumulation: The CVPD accumulation is anchored to a user-defined 'Anchor Timeframe' (e.g., daily, weekly). This cyclical reset allows to analyze the build-up of pressure within specific trading periods.
"Delta Candle" Visualization: The periodic CVPD is shown as a candle, where:
Open: The CVPD value at the start of the period (or zero).
High/Low: Represent the peak buying (CVD High) and selling (CVD Low) pressure within that period's profile.
Close: The final net delta value (CVD) for the period.
Dual CVD & Divergence Engine: The indicator calculates two CVPDs: a Periodic one (for plotting) and a Continuous one (non-resetting). The continuous line is used as a stable source for the built-in divergence engine (detecting Regular, Hidden, and Exaggerated).
Dynamic Divergence Plotting: Divergence markers are plotted relative to the periodic (candle) CVPD. They automatically adjust their vertical position after a reset to remain visually aligned with the plotted candles.
Note on Confirmation (Lag): Divergence signals rely on a pivot confirmation method to ensure they do not repaint.
The Start of a- divergence is only detected after the confirming pivot is fully formed (a delay based on Pivot Right Bars).
The End of a divergence is detected either instantly (if the signal is invalidated by price action) or with a delay (when a new, non-divergent pivot is confirmed).
Multi-Timeframe (MTF) Capability:
MTF Output: The entire analysis (Delta Candles, Divergences) can be calculated on a higher timeframe (using the Timeframe input), with standard options to handle gaps (Fill Gaps) and prevent repainting (Wait for...).
Limitation: The Divergence detection engine (pivDiv) is disabled if a Higher Timeframe (HTF) is selected.
Integrated Alerts: Includes 18 comprehensive alerts for:
The start and end of all 6 divergence types.
The periodic CVPD crossing the zero line.
Conditions of agreement or disagreement between the delta and the main bar's direction.
Caution: Real-Time Data Behavior (Intra-Bar Repainting) This indicator uses high-resolution intra-bar data. As a result, the values on the current, unclosed bar (the real-time bar) will update dynamically as new intra-bar data arrives. This behavior is normal and necessary for this type of analysis. Signals should only be considered final after the main chart bar has closed.
DISCLAIMER
For Informational/Educational Use Only: This indicator is provided for informational and educational purposes only. It does not constitute financial, investment, or trading advice, nor is it a recommendation to buy or sell any asset.
Use at Your Own Risk: All trading decisions you make based on the information or signals generated by this indicator are made solely at your own risk.
No Guarantee of Performance: Past performance is not an indicator of future results. The author makes no guarantee regarding the accuracy of the signals or future profitability.
No Liability: The author shall not be held liable for any financial losses or damages incurred directly or indirectly from the use of this indicator.
Signals Are Not Recommendations: The alerts and visual signals (e.Example: crossovers) generated by this tool are not direct recommendations to buy or sell. They are technical observations for your own analysis and consideration.

Net Positions (Net Longs & Net Shorts) - Volume AdjustedNet Positions (Net Longs & Net Shorts) - Volume Adjusted
Based on the legendary LeviathanCapital - Net Positions Indicator
Adjusted to use volume calculation for more percise data
Few important caveats:
- EVERY BUYER NEED A SELLER AND EVERY SELLER NEED A BUYER
- This indicator is meant to give you a sense of direction for the market orders ("who is the aggresive side") and should be used as confluence not as true values
In reality, in market movement each candle will contain both buying and selling, contracts closing and opening but due to some limitations that is hard to make properly.
Even with these limitations this indicator can provide a better picture than some other even external tools out there.
The main benefit of using volume delta and open interest instead of just open interest and candle closes G/R that it solves the problem with extreme cases where there might be an absorption of market orders.
Example of the Volume Edge in Action:
Bullish Absorption (The "Trap" for Sellers)
Candle Close + OI: A large Red Candle forms with Rising OI. The interpretation is simply: "New shorts are opening"
Volume Delta + OI: The same Red Candle with Rising OI has a Positive Volume Delta.
The True Story: Aggressive buyers tried to push the price up, but they were completely absorbed by large passive sell orders.
The "Volume Delta" logic:
If OI ↑ → new positions opened
• Delta ↑ → net longs added
• Delta ↓ → net shorts added
If OI ↓ → positions closed
• Delta ↑ → shorts closing
• Delta ↓ → longs closing
The "Price" logic:
If OI ↑ → new positions opened
• Price ↑ → net longs added
• Price ↓ → net shorts added
If OI ↓ → positions closed
• Price ↑ → shorts closing
• Price ↓ → longs closing

Volume Delta Pressure Tracker by GSK-VIZAG-AP-INDIA📢 Title:
Volume Delta Pressure Tracker by GSK-VIZAG-AP-INDIA
📝 Short Description (for script title box):
Real-time volume pressure tracker with estimated Buy/Sell volumes and Delta visualization in an Indian-friendly format (K, L, Cr).
📃 Full Description
🔍 Overview:
This indicator estimates buy and sell volumes using candle structure (OHLC) and displays a real-time delta table for the last N candles. It provides traders with a quick view of volume imbalance (pressure) — often indicating strength behind price moves.
📊 Features:
📈 Buy/Sell Volume Estimation using the candle’s OHLC and Volume.
⚖️ Delta Calculation (Buy Vol - Sell Vol) to detect pressure zones.
📅 Time-stamped Table displaying:
Time (HH:MM)
Buy Volume (Green)
Sell Volume (Red)
Delta (Color-coded)
🔢 Indian Number Format (K = Thousands, L = Lakhs, Cr = Crores).
🧠 Fully auto-calculated — no need for tick-by-tick bid/ask feed.
📍 Neatly placed bottom-right table, customizable number of rows.
🛠️ Inputs:
Show Table: Toggle the table on/off
Number of Bars to Show: Choose how many recent candles to include (5–50)
🎯 Use Cases:
Identify hidden buyer/seller strength
Detect volume absorption or exhaustion
✅ Compatibility:
Works on any timeframe
Ideal for intraday instruments like NIFTY, BANKNIFTY, etc.
Ideal for volume-based strategy confirmation.
🖋️ Developed by:
GSK-VIZAG-AP-INDIA

Volume Pressure Gauge + Volume %Volume Pressure Gauge and Volume Percentage Indicator – Pine Script Guide
This indicator provides a simplified, real-time visualization of both volume pressure (buy vs. sell activity) and today’s trading volume in comparison to historical averages. It is designed to help traders assess whether buyers or sellers dominate the current session and whether today’s volume is significant relative to recent behaviour.
________________________________________
Key Functional Segments
1. Inputs and Configuration
Users can configure the length of the Simple Moving Average (SMA) used to calculate average volume, set the position of the gauge table on the chart, and toggle the visibility of the volume pressure display. This allows flexibility in integrating the tool with various trading styles and chart layouts.
2. Volume Data Calculations
The indicator calculates three key volume metrics:
• volToday: The current day’s volume.
• volAvg: The average volume over the user-defined SMA period (default is 20 bars).
• volPct: The current volume as a percentage of the average.
This enables traders to quickly recognize whether current trading activity is above or below normal, which can be a precursor to potential trend strength or weakness.
3. Volume Pressure Calculation
The script estimates buying and selling pressure based on price movement and volume. It distributes volume into upward (buy) and downward (sell) segments and expresses them as percentages of the total volume. This gives an immediate sense of whether bulls or bears are more active in the current session.
4. Visual Representation (Progress Bars)
The indicator renders a simplified visual gauge using horizontal bar segments (pseudo-bars) to reflect the proportion of buy and sell pressure. The length of each bar correlates with the strength of pressure from buyers or sellers, helping users assess dominance without analyzing candlestick behavior in depth.
5. Table Display
A compact table is drawn on the chart showing:
• Buy pressure percentage and corresponding bar.
• Sell pressure percentage and corresponding bar.
• Volume percentage compared to the recent average.
This format makes it easy to evaluate volume dynamics at a glance, without cluttering the price chart or relying on separate overlays.
________________________________________
How Traders Benefit from This Indicator
• Momentum Shift Detection: Early signs of trend reversal can be observed when volume pressure flips direction.
• Breakout Validation: High volume combined with dominant pressure supports the credibility of breakout moves.
• False Move Avoidance: If price moves on low volume or mixed pressure, traders can avoid low-probability entries.
• Market Context Awareness: Users can assess whether a day is behaving normally in terms of participation or is unusually quiet or aggressive.
________________________________________
Basic Usage Guide
1. Add the script to your TradingView chart and set your preferred SMA length for volume comparison.
2. Customize the table’s position using the X and Y settings for clarity and alignment.
3. Interpret the outputs:
o A higher red bar indicates dominant sell pressure.
o A higher green bar indicates dominant buy pressure.
o Volume % above 100% suggests above-average activity, while values below 100% may imply low conviction.
4. Apply to trading decisions:
o High buy pressure and high volume may indicate a strong long opportunity.
o High sell pressure and high volume may support short setups.
o Low volume or conflicting signals may call for caution.
5. Combine with other tools such as trend indicators, support/resistance zones, or price action patterns for more reliable trade setups.
________________________________________
Practical Example
• Sell Pressure: 70% → Suggests strong seller control; potential for short setups.
• Buy Pressure: 30% → Weak buying interest; long trades may carry risk.
• Volume Percentage: 120% → Indicates a surge in participation; movement may have greater validity.
________________________________________
Tips for New Traders
• Use this indicator as a confirmation tool rather than a standalone strategy.
• Begin on higher timeframes (4-hour or daily) to develop familiarity.
• Compare multiple examples to identify reliable patterns over time.
• Always incorporate proper risk management, including stop losses.
________________________________________
Disclaimer from aiTrendview
This indicator is intended solely for educational and informational use. It does not constitute investment advice, trade signals, or financial recommendations. aiTrendview and its affiliates are not liable for any trading losses incurred through use of this tool. All trading involves risk. Past performance of any indicator does not guarantee future results. Users should conduct independent research and consult with a certified financial advisor before making any trading decisions.

Aggregated Spot vs Perp Volume (% Change)Aggregated Spot vs Perp Volume (% Change)
Description
The "Aggregated Spot vs Perp Volume (% Change)" indicator helps crypto traders compare the momentum of spot and perpetual futures (perp) trading volumes across 12 major exchanges. It calculates the percentage change in volume from one bar to the next, highlighting divergences and showing which market—spot or perp—is leading a move. By focusing on relative changes, it eliminates the issue of absolute volume differences, making trends clear.
The indicator aggregates data from Binance, Bybit, OKX, Coinbase, Bitget, MEXC, Phemex, BingX, WhiteBIT, BitMEX, Kraken, and HTX. Users can toggle exchanges and choose to measure volume in coin units (e.g., BTC) or USD.
How It Works
Volume Aggregation:
Fetches spot and perp volume data for the selected crypto (e.g., BTC) from up to 12 exchanges.
Spot volume is included only if perp volume is available for the same pair, ensuring consistency.
Volume can be measured in coin units or USD (volume × spot price).
Percentage Change:
Calculates the percentage change in spot and perp volumes from the previous bar:
Percentage Change = ((Current Volume − Previous Volume) / Previous Volume) ×100
This focuses on relative momentum, making spot and perp volumes directly comparable.
Visualization:
Spot volume % change is plotted as a blue line, and perp volume % change as a red line, both with a linewidth of 1.
Who Should Use It
Crypto Traders: To understand spot vs. perp market dynamics across exchanges.
Momentum Traders: To spot which market is driving price moves via volume divergences.
Scalpers/Day Traders: For identifying short-term shifts in market activity.
Analysts: To study liquidity and sentiment in crypto markets.
How to Use It
Blue line: Spot volume % change.
Red line: Perp volume % change.
Look for divergences (e.g., a sharp rise in the red line but not the blue line suggests perp markets are leading).
Combine with Price:
Use alongside price charts to confirm trends or spot potential reversals.
Context
Spot markets reflect actual asset trading, while perp markets, with leverage, attract speculative activity and often show higher volumes. This indicator uses percentage change to compare their momentum, helping traders identify market leadership and divergences. For example, a 50% increase in both spot and perp volumes plots at the same level, making it easy to see relative shifts across exchanges.

Volume Delta with Custom Colors and Min Delta Input### Indicator Description: **Volume Delta with Custom Colors and Min Delta Input**
---
Volume Delta with Custom Colors and Min Delta Input is a powerful and flexible indicator for analyzing volume delta (the difference between buying and selling volume) on TradingView charts. This indicator visualizes volume delta with customizable colors and allows filtering based on a minimum delta value. It is an ideal tool for traders who want to gain deeper insights into market activity and identify significant volume changes.
---
### Key Features:
Volume Delta Visualization:
- The indicator displays volume delta as candlesticks, where:
- Green candles indicate positive delta (buying volume dominance).
- Red candles indicate negative delta (selling volume dominance).
Customizable Colors:
- Users can choose their preferred colors for positive and negative delta to tailor the indicator to their preferences.
Minimum Delta Volume Filter:
- Added functionality to set a minimum delta volume threshold. This helps ignore insignificant volume changes and focus on important movements.
Flexible Timeframe Selection:
- The indicator supports analyzing volume delta on a different timeframe than the current chart. For example, you can analyze hourly volume delta on a daily chart.
Adaptive Settings:
- Users can configure the moving average (SMA) period and standard deviation multiplier to calculate the delta threshold.
---
### How to Use the Indicator:
Add the Indicator to Your Chart:
- Search for the indicator in the TradingView library and add it to your chart.
Configure the Settings:
- Positive Delta Bar Color: Choose the color for bars with positive delta.
- Negative Delta Bar Color: Choose the color for bars with negative delta.
- Minimum Delta Volume: Set the minimum delta volume value to be displayed.
- Use Custom Timeframe: Enable if you want to analyze volume on a different timeframe.
- Timeframe: Specify the desired timeframe for volume analysis (e.g., "1H" for hourly).
- SMA Period: Set the moving average period for delta calculation.
- Delta Multiplier: Adjust the standard deviation multiplier to fine-tune the delta threshold.
Analyze the Chart:
- Green candles indicate buying volume dominance, while red candles indicate selling volume dominance.
- Use the minimum delta volume filter to focus on significant movements.
---
### Benefits of the Indicator:
Flexibility: Customizable colors, timeframe selection, and filtering make the indicator versatile for various trading strategies.
Clarity: Volume delta visualization as candlesticks allows for quick assessment of market activity.
Noise Reduction: The minimum delta volume filter helps ignore insignificant changes and focus on important movements.
---
### Example Use Cases:
For Scalping: Use a minute timeframe and set a minimum delta volume filter to identify short-term volume anomalies.
For Long-Term Trading: Analyze volume delta on daily or weekly timeframes to identify key support and resistance levels.
---
### Recommendations:
Use the indicator in combination with other technical analysis tools (e.g., support/resistance levels or trendlines) to improve signal accuracy.
Experiment with the settings to adapt the indicator to your trading strategies.
---
Volume Delta with Custom Colors and Min Delta Input is an essential tool for traders who want to gain a deeper understanding of market dynamics and make more informed trading decisions. Try it out today and see its effectiveness for yourself!

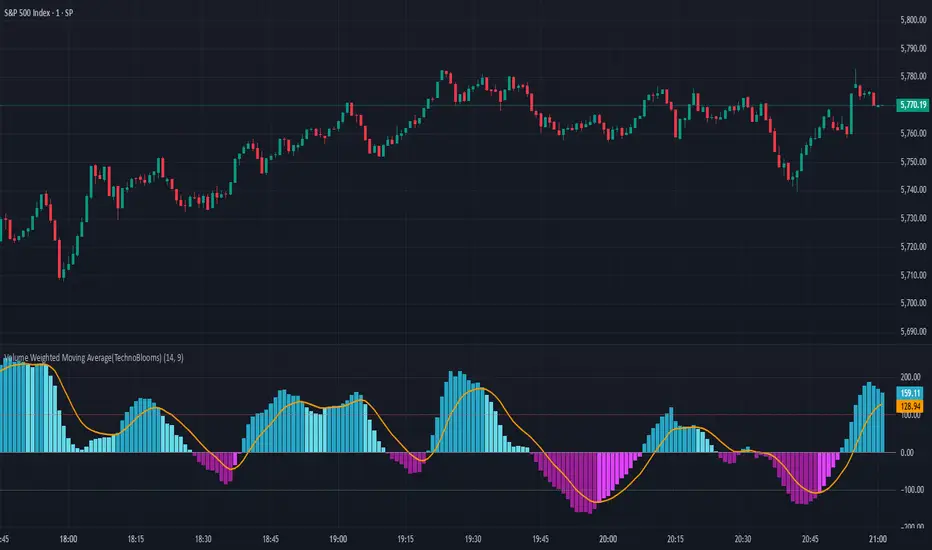
Volume Weighted Moving Average (TechnoBlooms)The Volume Weighted Moving Average Oscillator (VWMO) is a custom technical indicator designed to measure market momentum while accounting for volume. It helps traders assess whether price movements are supported by strong or weak trading volumes. The VWMO provides insights into potential trends by comparing current momentum with historical averages.
Indicator Overview:
The VWMO is based on a combination of price and volume data, highlighting the relationship between these two components to generate a clear oscillation value. The oscillator displays dynamic insights into market strength, capturing price directionality and volume alignment.
Key Features:
1. Dynamic Visualization of Momentum:
o The oscillator displays positive and negative momentum by analyzing the relationship between price movements and trading volume over a specified period.
o Positive momentum typically represents a bullish market, while negative momentum reflects bearish conditions.
2. Volume-Weighted Analysis:
o Volume is incorporated to give an adjusted price perspective, where price movements on high-volume days have more influence on the resulting oscillator values.
3. Trend Confirmation via EMA:
o An Exponential Moving Average (EMA) of the oscillator is plotted to smooth the raw oscillator values and provide trend confirmation.
o The EMA is essential for identifying whether the oscillator is in an upward or downward trend. It also serves as a support for evaluating when momentum might reverse.
4. Visual Indicators and Color Coding:
o The indicator uses varying color intensities to differentiate between strong and weak momentum.
o Bullish and bearish momentum is visually reflected by colors, offering at-a-glance guidance on potential trade opportunities.
5. Overbought and Oversold Thresholds:
o Horizontal lines at predefined levels (e.g., +100 and -100) help to define overbought and oversold areas, which assist in identifying overextended price movements that may signal reversals.
6. Scalability & Adaptability:
o The indicator allows for adjustment of the period, EMA length, and other key parameters to tailor its usage according to different asset classes or timeframe preferences.
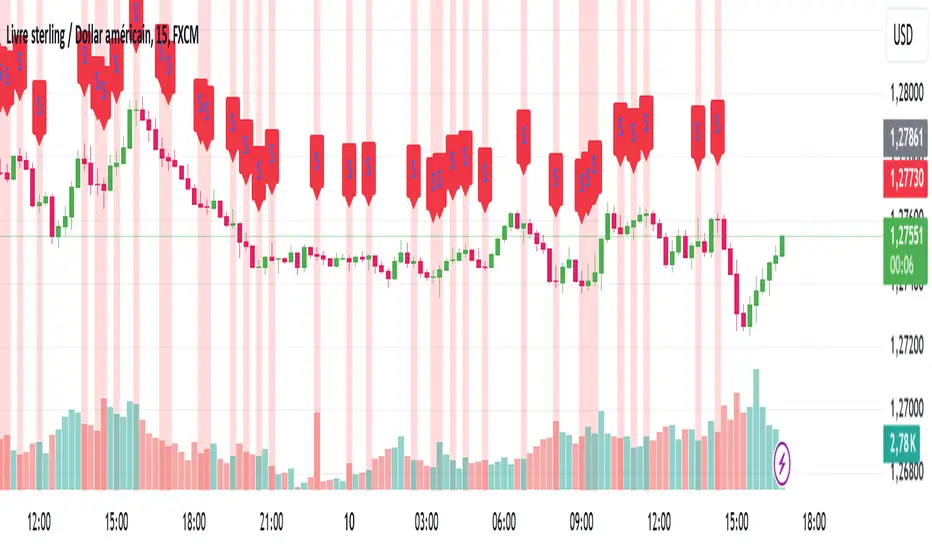
squeeze candles with volume Function :
This indicator was designed to detect specific candles called “squeeze”. These candles are characterized by a relatively small body (the difference between the opening and closing price) and long shadows (the distance between the high and low prices), accompanied by significant volume. They often indicate a period of increased volatility or a potential trend reversal.
Use :
Visual detection:
Candles identified as "squeeze" are highlighted in red on the chart.
An “S” icon appears above each detected squeeze candle.
Alerts:
The indicator emits an audible and visual alert when a squeeze candle with high volume is detected (if alerts are enabled).
Market analysis:
This indicator is particularly useful for identifying trading opportunities during periods when the market is showing signs of compression or impending volatility.
Customizable settings:
Minimum volume: Defines the threshold at which the volume is considered high.
Maximum body/shadow ratio: Allows you to adjust the sensitivity to detect squeeze candles (the lower the ratio, the smaller the detected candles will have in relation to their shadows).
Benefits :
Provides accurate alerts on key market candles.
Helps anticipate large movements through analysis of volume and candle characteristics.
Adaptable to different strategies thanks to adjustable parameters.
Ideal for:
Traders who want to identify areas of potential volatility or reversal signals in the market, regardless of the asset or time frame used.
Dix$on's Weighted Volume FlowDixson's Weighted Volume Flow
Dixson's Weighted Volume Flow is a technical indicator designed to analyze and visualize the distribution of buy and sell volume within a given timeframe. It dynamically calculates the proportional allocation of volume based on price action within each bar, providing insights into market sentiment and activity. This indicator displays horizontal volume bars in a separate pane and annotates them with precise volume values.
How It Works
1. Volume Allocation:
- The indicator calculates buy and sell volume using the following formulas:
- Buy Volume = (Close - Low) / (High - Low) Total Volume
- Sell Volume = (High - Close) / (High - Low) Total Volume
- These formulas allocate volume proportionally based on the bar's price range, attributing more volume to buying or selling depending on the relationship between the close, high, and low prices.
2. Dynamic Scaling:
- The buy and sell volumes are scaled relative to their combined total for the period.
- The resulting values determine the length of the horizontal bars, providing a comparative view of buy and sell activity.
3. Bar Visualization:
- Buy Volume Bars: Displayed as green horizontal bars.
- Sell Volume Bars: Displayed as red horizontal bars.
- The lengths of the bars represent the dominance of buy or sell volume, scaled dynamically within the pane.
4. Labels:
- Each bar is annotated with a label showing its calculated buy or sell volume value.
5. Timeframe Adjustment:
- The indicator uses the request.security() function to fetch data from the selected timeframe, allowing users to customize their analysis for intraday, daily, or longer-term trends.
6. Customization Options:
- Enable or disable the indicator using a toggle.
- Adjust colors for the buy/sell bars and text labels to suit your chart theme.
How to Use It
1. Enable the Indicator:
- Activate the indicator using the "Enable/Disable" toggle in the settings.
2. Select a Timeframe:
- Choose the timeframe for analysis (e.g., 1-minute, 1-hour, daily). The indicator fetches volume data specific to the selected timeframe.
3. Interpret the Visualization:
- Compare Bar Lengths:
- Longer buy volume bars (green) indicate stronger buying activity.
- Longer sell volume bars (red) suggest dominant selling pressure.
- Labels:
- Use the labels to view the exact buy and sell volume values for precise analysis.
4. Combine with Other Tools:
- Use the indicator alongside price action analysis, support/resistance levels, or trend indicators to confirm market sentiment and detect potential reversals.
5. Monitor Imbalances:
- Significant disparities between buy and sell volume can signal shifts in market sentiment, such as the end of a trend or the start of a breakout.
Practical Applications
- Trend Confirmation:
- Align the dominance of buy or sell volume with price trends to confirm market direction.
- Reversal Signals:
- Watch for volume imbalances or a sudden shift in the dominance of buy or sell volume to identify potential reversals.
- High-Activity Zones:
- Identify areas with increased volume to anticipate significant price movements or key support/resistance interactions.
Dixson's Weighted Volume Flow provides a clear and systematic way to analyze market activity by visualizing the dynamics of buy and sell volume. It is particularly useful for traders looking to enhance their understanding of volume-based sentiment and its impact on price movements.

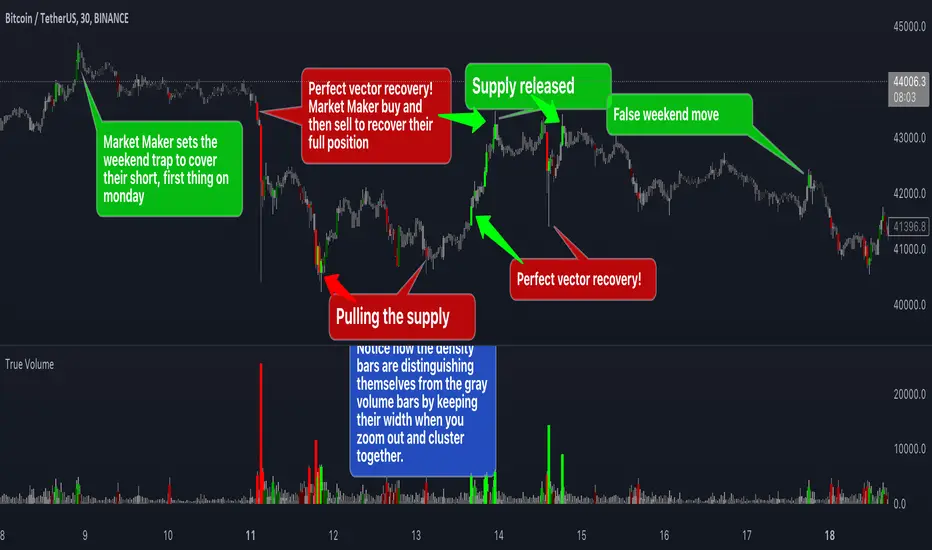
True VolumeThis indicator is designed to provide in-depth analysis of volume data from multiple sources and distinguish highly liquid candles by measuring the density of the volume. By focusing on the density and concentration of volume, rather than just the volume itself, it offers a more nuanced view of the market. This can be particularly beneficial in markets like cryptocurrencies, where understanding the role of market makers versus retail traders is crucial for strategic trading.
This is how it works:
Multiple Asset Integration:
Unlike standard volume indicators, True Volume allows the inclusion of up to four different assets (or the same asset from various exchanges) into its volume calculations. This feature provides a broader and more accurate total volume representation, essential in markets like cryptocurrencies where volume is dispersed across multiple exchanges.
Adjustable Time Anchors:
It offers various time anchor options, allowing traders to analyze volume data over different time periods or a specific amount of lookback candles. This flexibility helps in understanding volume trends over both short and long-term time frames.
Volume Density Analysis:
The core of this indicator is the innovative concept of Volume Density. It's calculated using a sigmoid function that normalizes the volume-to-price movement ratio in a unique way without needing a max cap or having the density column spike off the chart. This method helps in distinguishing between normal volume fluctuations and those that are unusually dense for the given price movement. This distinction is key in identifying potential market maker activities.
The Visuals:
The Volume Density is displayed in a unique way without compromising the original volume bars or cap the density. Infinite density can essentially be represented without having an infinitely large bar or caping out the density data. There's also two different color themes, optional bar color, and an option to flip the density bars up-side down for a different representation. Each of the original volume sources can be displayed separately as well. All colors as customizable as well for your own preference.
Price Volume Trend (PVT):
Included in this indicator is also the Price Volume Trend, which cumulatively measures the density delta, offering insights into the longer-term momentum of the market.
How do I trade it?
This indicator aims to give you insight into 'the other side of the trade', the Market Makers. When you buy, they provide liquidity by selling to you. That drives the Volume Density up.
Consider whether the market maker is currently long or short and might need to cover their position by wicking price back, or "adjust inventory". Especially towards the end of a market session.
Consider dense candles during market gaps or weekends to be market manipulation moves.
The density also goes up when stop losses are hit. If price makes a higher high or lower low, high density could indicate a liquidation event.
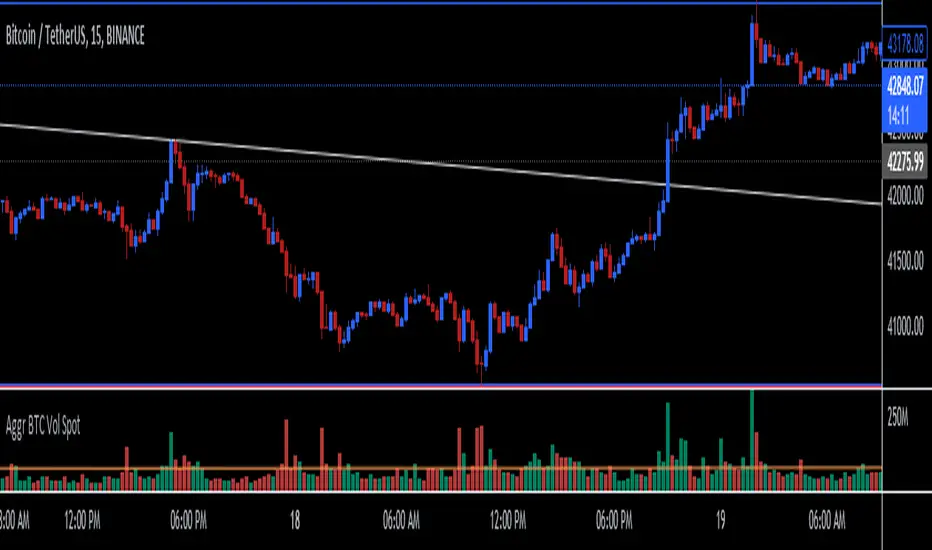
Aggregate BTC Volume Spot - Ma78erAggregate BTC Volume indicator show aggregates trading volumes of Bitcoin from multiple trading platforms.
Exchange Include:
1: Binance - BTC(USDT, USDC, FDUSD, TUSD)
2: Coinbase - BTC(USD, EUR, USDT, GBP)
3: OKX - BTC(USDT, USDC)
4: BYBIT - BTC(USDT, USDC)
5: KUCOIN - BTC(USDT, USDC)
6: KRAKEN - BTC(USD, EUR, USDT, GBP, USDC)
7: Bitfinex - BTC(USD, EUR, GBP)
8: Bitstamp - BTC(USD, EUR, USDT, GBP, USDC)
9: GATEIO - BTC(USDT)
You can also add other exchange in script manually.
ETH Volume*Close Top Exchanges in millions $The script is designed to create a custom indicator that calculates the total volume of Ethereum traded on various exchanges, calculated in millions of dollars, and then plots a histogram of that volume along with a Simple Moving Average (SMA) of the volume.
The script starts by setting some input parameters such as the length of the SMA and the range period. It then requests data on the volume of Ethereum traded on several exchanges such as Binance, Coinbase, Kraken, and others. It calculates the combined total volume across all these exchanges and multiplies it by the close price of Ethereum to get a value in millions of dollars.
The script then checks if the volume is rising while the price is lower than the previous 5 bars high and higher than the previous 5 bars low, and if so, it sets the color of the histogram bars to white. It then plots the histogram bars and the SMA on the chart.

BTC Volume*Close from Top ExchangesThe script is designed to create a custom indicator that calculates the total volume of Bitcoin traded on various exchanges, calculated in millions of dollars, and then plots a histogram of that volume along with a Simple Moving Average (SMA) of the volume.
The script starts by setting some input parameters such as the length of the SMA and the range period. It then requests data on the volume of Bitcoin traded on several exchanges such as Binance, Coinbase, Kraken, and others. It calculates the combined total volume across all these exchanges and multiplies it by the close price of Bitcoin to get a value in millions of dollars.
The script then checks if the volume is rising while the price is lower than the previous 5 bars high and higher than the previous 5 bars low, and if so, it sets the color of the histogram bars to white. It then plots the histogram bars and the SMA on the chart.

Volume Trend AnalysisThe VTA indicator is a trend analysis indicator based on trading volume and candlestick charts, used to determine the states of bullish strength, bearish strength, and market balance. When the bullish volume gradually increases while the bearish volume gradually decreases or remains steady, the market is in a state of bullish strength; when the bearish volume gradually increases while the bullish volume gradually decreases or remains steady, the market is in a state of bearish strength; when both the bullish and bearish volumes remain steady, the market is in a state of market balance.
The VTA indicator can help traders better determine market trends, select appropriate entry and exit points.
