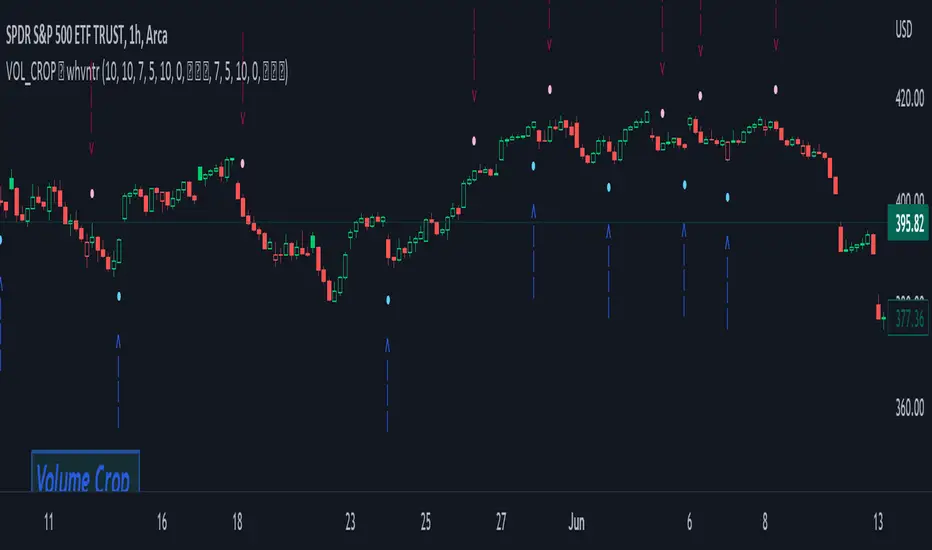
Volume Crop ━ Hidden Volume Divergence [whvntr] Volume Divergence
• Formula originated from: "Hidden Price Divergence" (circles) by TheLark. I did two things to harness its
effectiveness:
• Firstly, I developed a unique way to filter out the divergence signals that were appearing on both sides of the
midline. This filter will be known as the "Midline Tool" . It filters out a lot of the false signals commonly
associated with oscillators.
• Then, I modified the default format from Price to Volume.
• The midline formula "Midline Tool" was developed by me . It adjusts in the thousands since it's volume.
Let me know in the comments if you would rater have a smaller step value than 10,000. How does it work?
Crossover then Crossunder, the arrows only appear during the first sign of hidden volume divergence once
crossing the midline. Normally, these signs appear on both side of the midline both bearish and bullish no
matter if it's on an oversold or overbought side of the spectrum... Also, let
me know in the comments if you would like for me to release an oscillator version of this
indicator for co-witnessing.
Features:
• Volume divergence
• Midline Tool©
• Disclaimer: This indicator does not constitute investment advice. Trade at your own risk with the investments
you can afford to lose because all financial investments have risks and this is not a
guarantee that the volume divergence will be 100% all the time.
"volume" için komut dosyalarını ara
Volume Price Change RatioMessing around with this two point selecting ability I recently learned about from Tradingview's CAGR. Here is a script that will tell you changes in volume(obv)/price, volume to price change ratio, and the average volume to price change ratio for the length you define in the settings menu. You can use this to compare the ratio of a current pump to an older pump to help assess the strength of a movement. Enjoy!

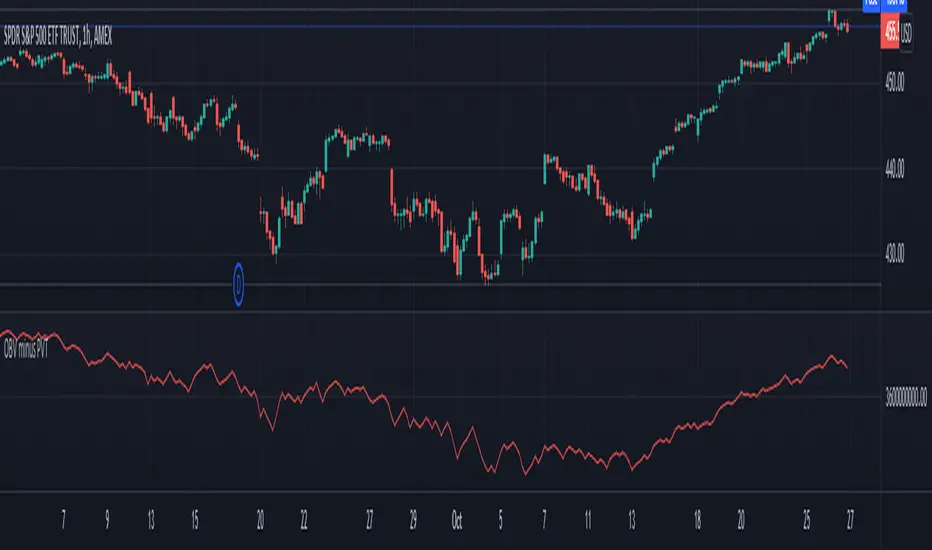
Volume Difference IndicatorThis indicator is a simple volume difference indicator.
How it works:
First we calculate the on balance volume, and then we calculate the price volume trend.
For those unaware, the OBV subtracts all volumes when price records a lower close and adds them in the case of a higher price close. In contrast, PVT subtracts or adds only a proportion of the volume from its cumulative total in relation to a percentage change in price.
Using this knowledge, we are using the difference of OBV (the indicator with the entire amount added or subtracted), minus PVT (which subtracts a percent based on the percentage in price), this gives us a unique indicator which out puts a more whole picture of the two indicators. It shows us the difference of absolute volume minus relative volume based on the percent of close price. It allows us to see large shifts in volume BEFORE it happens.
How to use this indicator:
When there is a sharp increase of Volume Difference Indicator, but close has NOT risen, price tends to rise immediately following this. When the Volume Difference Indicator drops, but price has NOT changed, price tends to fall immediately following this.
Volume In USDDisplay volume in fiat base currency so that we can compare symbols in a list to find healthy one to trade.
Add a label so that we can see the latest volume number easier on mobile phone.


Volume Cloud [LucF]A strictly volume-based cloud. It plots current volume (green line) over its 20-period linear regression (red line) on the chart. Unlike Ichimoku's cloud, it is not offset. While probably not something that you would have on your charts all the time, it can provide a useful way to study the interaction between price and volume.
Because the green line is the current volume, you can forego volume columns when using the indicator.
Volume Cloud does have practical uses. I will show here how I use volume to help me in selecting better probability entries, with only Volume Cloud and my TLD indicator on the chart (the Volume Columns are there to provide context for first-time users of the Volume Cloud).
When looking for entries, I’m trying to find spots where a reversal from a bottom or a continuation after a pause is confirmed by increasing volume (preferably above average) candles with proper wick/body structure. The candle structure of increasing volume candles is important because for me, it provides granularity on the volume action during the candle. I view wicks as failed tests and body height as reinforcement of the price movement. As for candles where volume is not increasing, I mostly ignore them. This is a simplified account of my mindset; just the stories I trade with and that I believe provide an edge—and profits. I certainly don’t pretend having found an infallible way to trade, and there is much more to it that I can explain here, but let’s look at a chart.
Point 1: Solid increasing volume and above average down candle, but I don’t enter on big candles. The volume on that candle has reached a new high though, so I’m thinking bearish sentiment for the next bars.
Point 2: Nicely formed above average increasing volume candle, but I’m looking to short. A similar’ish candle 4 bars back was followed by non-descript action. After 2, a test of past resistance fails before reaching it and a lower low and then a lower high bring us to point 3.
Point 3: Exactly what I’m looking for. No upper wick, solid body that’s not too big, and the highest volume reached on chart yet as a bonus. I enter on the following candle and because of the solid context, I can use a tight stop at the previous candle’s high. Going down, I will move my stop to the high of any increasing volume candle going in my direction, starting when that point is at least as far from my entry as my stop (RR=1).
Point 4: This is the last point where I move my stop at the candle’s high and get stopped out at the following candle for a RR=3.75 trade. Notice how the very high volume at point 4 generates a relatively small body. This is often a sign of stopping volume that portends a reversal or a pause.
Point 5: A first above average increasing volume candle, but with longish wicks that don’t fit my idea of a solid candle. Definitely not a strong enough sign to bet on a reversal from the recent strong descent.
Point 6: This candle is a different story altogether. No lower wick, reasonably sized body, double the volume of previous candle and a close way above the previous 20 candles. Long entry with stop at candle 6’s low. I don’t move my stop on the candle following my entry because it wouldn’t put me at RR=1, so the first time I move my stop up is at candle just before point 7.
Point 7: I get stopped out for RR=3 after that candle because I will have moved my stop a second time, at candle’s 7 low.
I didn’t make these trades (can’t even short on Binance yet), and while this is a typical a posteriori story, it does reflect what I do in reality.

Volume DeltaThis indicator provides a detailed view of Volume Delta (VD) by analyzing order flow on a lower, intra-bar timeframe. For each bar on the chart, it calculates the net difference between buying and selling volume based on the direction of the intra-bar candles.
Key Features:
Intra-Bar Delta Calculation: The indicator analyzes price action on a user-defined lower timeframe ('Intra-Bar Timeframe') to construct a detailed picture of the underlying order flow for each bar on the main chart.
"Delta Candle" Visualization: The delta for each bar is shown as a candle, where:
Open: Always starts at the zero line.
High/Low: Represent the peak buying and selling pressure accumulated within the bar.
Close: The final net delta value for that bar. This visualization shows absorption, exhaustion, and conviction in a single glance.
Customizable Moving Average: An optional moving average of the net delta (Close) can be added. The MA type, length, and an optional Volume weighted setting are customizable.
Intra-Bar Peak Pivot Detection: Automatically identifies and plots significant turning points (pivots) in the peak buying (High) and selling (Low) pressure.
Note on Confirmation (Lag): Pivot signals are confirmed using a lookback method. A pivot is only plotted after the Pivot Right Bars input has passed, which introduces an inherent lag.
Multi-Timeframe (MTF) Capability:
MTF Output: The entire analysis (Delta Candles, MA, Pivots) can be calculated on a higher timeframe (using the Timeframe input), with standard options to handle gaps (Fill Gaps) and prevent repainting (Wait for...).
Limitation: The Pivot detection (Calculate Pivots) is disabled if a Higher Timeframe (HTF) is selected.
Integrated Alerts: Includes 8 alerts for:
The net delta crossing its moving average.
The detection of new peak buying or selling pivots.
Conditions of agreement or disagreement between the net delta and the main bar's direction (absolute volume).
Caution: Real-Time Data Behavior (Intra-Bar Repainting) This indicator uses high-resolution intra-bar data. As a result, the values on the current, unclosed bar (the real-time bar) will update dynamically as new intra-bar data arrives. This behavior is normal and necessary for this type of analysis. Signals should only be considered final after the main chart bar has closed.
DISCLAIMER
For Informational/Educational Use Only: This indicator is provided for informational and educational purposes only. It does not constitute financial, investment, or trading advice, nor is it a recommendation to buy or sell any asset.
Use at Your Own Risk: All trading decisions you make based on the information or signals generated by this indicator are made solely at your own risk.
No Guarantee of Performance: Past performance is not an indicator of future results. The author makes no guarantee regarding the accuracy of the signals or future profitability.
No Liability: The author shall not be held liable for any financial losses or damages incurred directly or indirectly from the use of this indicator.
Signals Are Not Recommendations: The alerts and visual signals (e.g., crossovers) generated by this tool are not direct recommendations to buy or sell. They are technical observations for your own analysis and consideration.

Volume Profile Auto POC📌 Overview
Volume Profile Auto POC is a trend-following strategy that uses the automatically calculated Point of Control (POC) from the volume profile, combined with ATR zones, to capture reversals and breakouts.
By basing decisions on volume concentration, it dynamically visualizes the price levels most watched by market participants.
⚠️ This strategy is provided for educational and research purposes only.
Past performance does not guarantee future results.
🎯 Strategy Objectives
Automatically detect the volume concentration area (POC) to improve entry accuracy
Optimize risk management through ATR-based volatility adjustment
Provide early and consistent signals when trends emerge
✨ Key Features
Automatic POC Detection : Updates the volume profile over a defined lookback window in real time
ATR Zone Integration : Defines a POC ± 0.5 ATR zone to clarify potential reversals/breakouts
Visual Support : Plots the POC line and zones on the chart for intuitive decision-making
📊 Trading Rules
Long Entry:
Price breaks above the POC + 0.5 ATR zone
Volume is above average to support the breakout
Short Entry:
Price breaks below the POC - 0.5 ATR zone
Volume is above average to support the downside move
Exit (or Reverse Position):
Price returns to the POC area
Or touches the ATR band
⚙️ Trading Parameters & Considerations
Indicator Name: Volume Profile Auto POC
Parameters:
Lookback Bars: 50
Bins for Volume Profile: 24
ATR Length: 14
ATR Multiplier: 2.0
🖼 Visual Support
POC line plotted in red
POC ± 0.5 ATR zone displayed as a semi-transparent box
ATR bands plotted in blue for confirmation
🔧 Strategy Improvements & Uniqueness
This strategy is inspired by traditional Volume Profile + ATR analysis,
while adding the improvement of a sliding-window mechanism for automatic POC updates.
Compared with conventional trend-following approaches,
its strength lies in combining both price and volume perspectives for decision-making.
✅ Summary
Volume Profile Auto POC automatically extracts key market levels (POC) and combines them with ATR-based zones,
providing a responsive trend-following method.
It balances clarity with practicality, aiming for both usability and reproducibility.
⚠️ This strategy is based on historical data and does not guarantee future profits.
Always use proper risk management when applying it.

Volume Spread Candle█ Overview
Volume Spread Candle is a Solid tool for VSA (Volume Spread Analysis).
█ Setting
please put on VSCandle above the candle chart.
█ Features
Candle color reflect volume size.
Back ground color reflect Spread size.
Warning Volume is relatively large volume compared to the Volume flow (up volume MA - down volume MA).
Yellow square mark appears when Warning volume.
Volume Density is Volume / Spread.
Yellow circle mark appears when large Volume Density.
█ Usage
Abnormal Volume and Spread hint what about to happen.

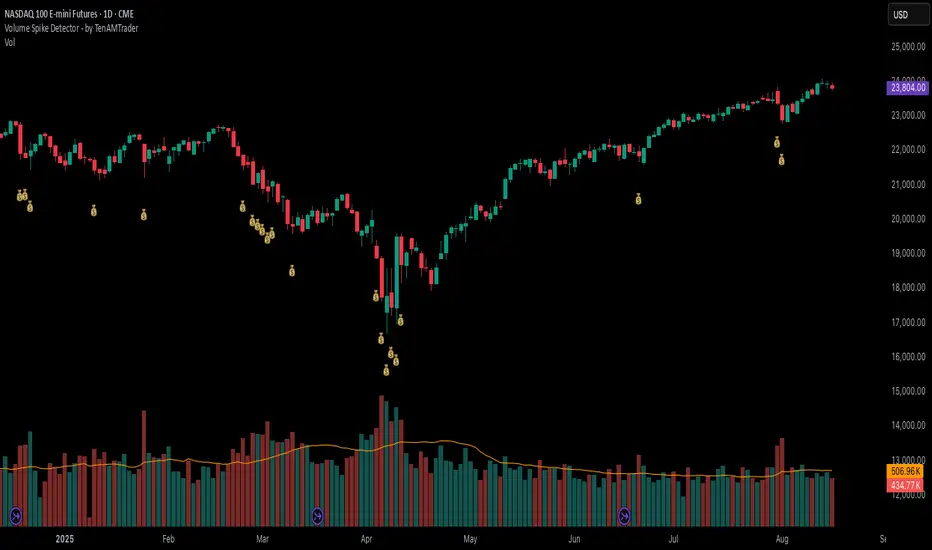
Volume Spike Detector - by TenAMTrader📌 Volume Spike Detector – by TenAMTrader
This indicator is designed to help traders quickly identify unusual surges in trading volume relative to recent activity. High-volume spikes can often signal strong buying or selling pressure, potential trend reversals, or breakout setups.
⚙️ How It Works
The script calculates the average trading volume over a user-defined period (default: 21 bars).
It then sets a spike threshold, which is that average volume plus a percentage buffer (default: 25%).
Whenever the current bar’s volume exceeds this threshold, a 💰 label is plotted below the candle.
If alerts are enabled, you’ll also receive a real-time alert whenever a spike occurs.
🔧 User Settings
Spike Ratio % → Adjust how much higher than average volume must be to qualify as a spike.
Trading Period → Set the lookback period used to calculate the average volume.
Enable Alert → Turn alerts on/off.
📊 Practical Use Cases
Breakout Trading: Volume spikes often confirm breakouts from consolidation zones.
Reversal Signals: A sudden surge in volume may precede a trend reversal.
News & Events: Spot unusual activity during earnings, economic releases, or unexpected events.
⚠️ Disclaimer
This indicator is provided for educational and informational purposes only. It does not constitute financial advice, investment advice, or trading recommendations. Past performance is not indicative of future results. Always do your own research and consult with a licensed financial professional before making any trading decisions.
Volume Surge Detector[SpeculationLab]Volume Surge Detector
This tool is especially useful for spotting early signs of breakouts, news-driven spikes, or institutional activity that are often preceded by abnormal surges in volume.
For better chart readability, the volume bar colors are based on TradingView’s original Volume indicator, while all other code is fully original by Speculation Lab.
You can customize both the SMA line and the volume bar colors to fit your style.
The logic compares the current volume against its SMA (default length: 14, fully adjustable).
The script comes with two surge levels:
Surge Level 1 (default = 5) → When volume is more than 5× the SMA, the bar turns aqua.
Surge Level 2 (default = 10) → When volume is more than 10× the SMA, the bar turns yellow.
It also includes built-in alerts, so you’ll be notified instantly whenever a surge is detected.
This makes it easier to spot potential breakout moves or large market participation in real time.
Disclaimer: This script is for educational purposes only. It does not provide financial advice.
这是一个用于探测 成交量爆发 的指标。
为了图表美观,成交量柱的颜色借鉴了 TradingView 原始 Volume 指标,其余代码均为 Speculation Lab 原创。
用户可以自由调整成交量柱和其对应的 SMA 均线的颜色。
指标通过对比成交量和其 SMA(默认长度为14,可自定义长度和颜色)的比例来检测放量。
默认设置了两个放量级别:
Surge Level 1(默认=5):当成交量超过均量的 5 倍时,量柱变为水蓝色。
Surge Level 2(默认=10):当成交量超过均量的 10 倍时,量柱变为黄色。
脚本还设置了 内置警报功能,方便交易者在出现放量时实时收到通知。

Volume Spike DetectorVolume Spike Detector
This script is designed to identify significant spikes in trading volume and visually represent them on the chart. It calculates the 20-period simple moving average (SMA) of the trading volume and multiplies it by a user-defined threshold to determine the spike threshold. When the current volume exceeds this threshold, the script detects and highlights a volume spike.
Key Features:
Dynamic Spike Threshold:
The script calculates the spike threshold dynamically based on the average trading volume. Users can customize the threshold multiplier using an input setting.
Example: A threshold multiplier of 2.0 means the current volume must be twice the 20-period SMA to trigger a detection.
Visual Representation:
The current volume is plotted in blue bars.
The spike threshold is plotted as a red line, making it easy to visually identify when the volume crosses the threshold.
Alert Notification:
When a volume spike is detected, an alert is triggered to notify the user.
This feature is useful for real-time monitoring and spotting potential trading opportunities.
Use Case:
Traders can use this tool to identify sudden increases in trading activity, which may indicate a significant market move or event. It’s suitable for all markets, including cryptocurrencies, stocks, and forex.

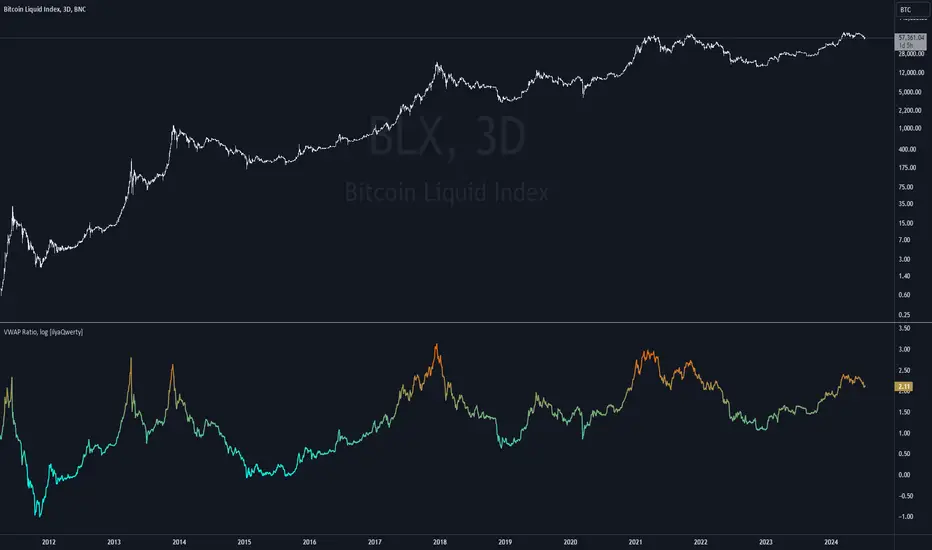
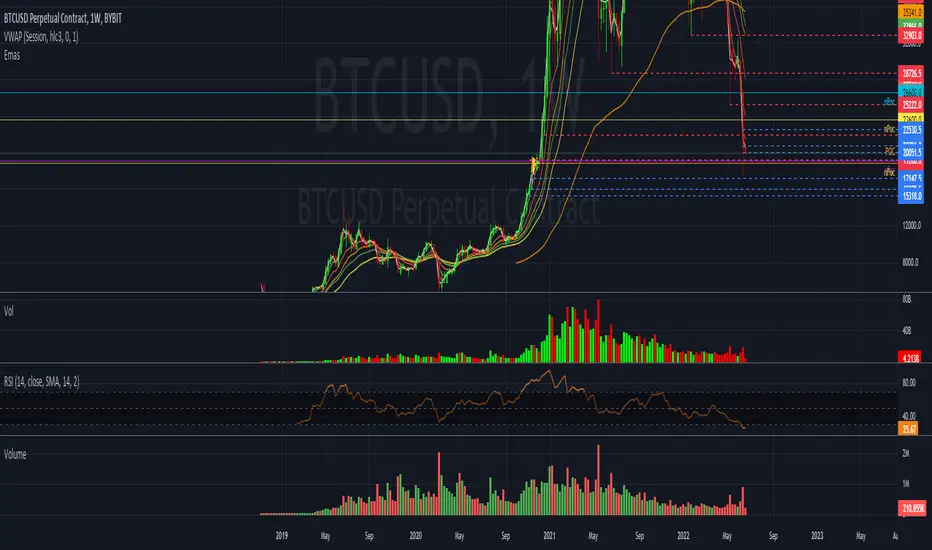
Volume Weighted Average Price Ratio (log) [ilyaQwerty]The VWAP Ratio indicator is a valuable tool for traders aiming to assess market trends and price movements in relation to the Volume Weighted Average Price (VWAP). Volume Weighted Average Price Ratio represents the ratio of the price of the asset compared to total traded volume in US Dollars. In a context of Bitcoin, VWAP ratio helps traders assess the market state, if it is overvalued or undervalued. High values of the indicator can suggest that the market is highly overvalued and low values can indicate a great buying opportunity.
Ratio Calculation: The VWAP Ratio is computed by dividing the current price by the VWAP (Price / VWAP). VWAP represents a ratio between a cumulative sum of a traded value (price multiplied by the volume) and a cumulative traded volume.
BTC-Specific Optimization: Although the indicator can be applied to various assets, the VWAP Ratio indicator is particularly useful for Bitcoin (BTC) due to its significant trading volume and unique market behaviour.
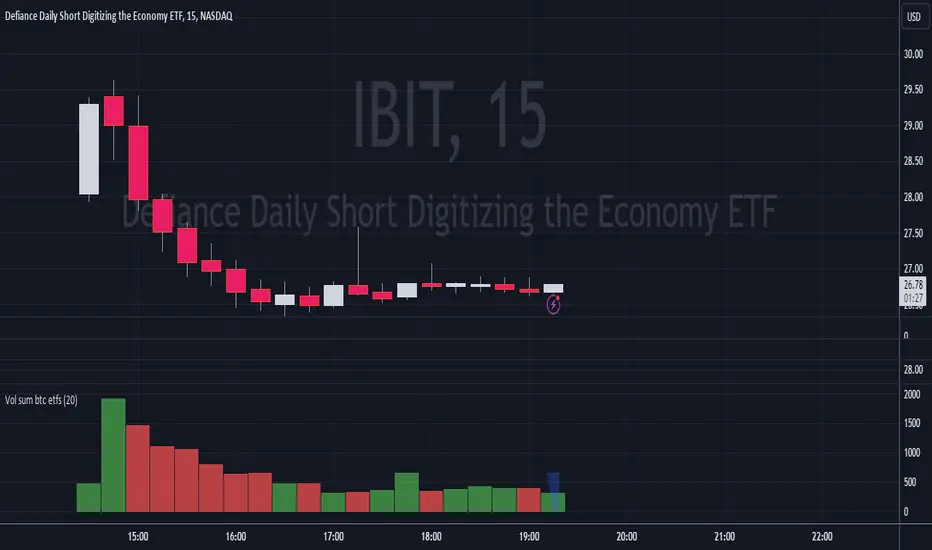
Volume Sum BTC ETFsThis volume indicator tracks the volume of these 10 bitcoin ETFS:
AMEX:GBTC, NASDAQ:IBIT, AMEX:BTCO, AMEX:ARKB, AMEX:HODL, AMEX:EZBC, NASDAQ:BRRR, AMEX:BTCW, AMEX:DEFI, AMEX:BITB
It multiplies the traded shares with the hl2 share price and then devides the volume by the bitcoin hl2 price.
You can change to usd volume in settings.
Enjoy!
Notice that historical volume comes from etfs which traded already before launch like GBTC.
Also notice that that btc trades also when tradfi markets are closed, so then the indicator will show the last available volume. Something to fix later.
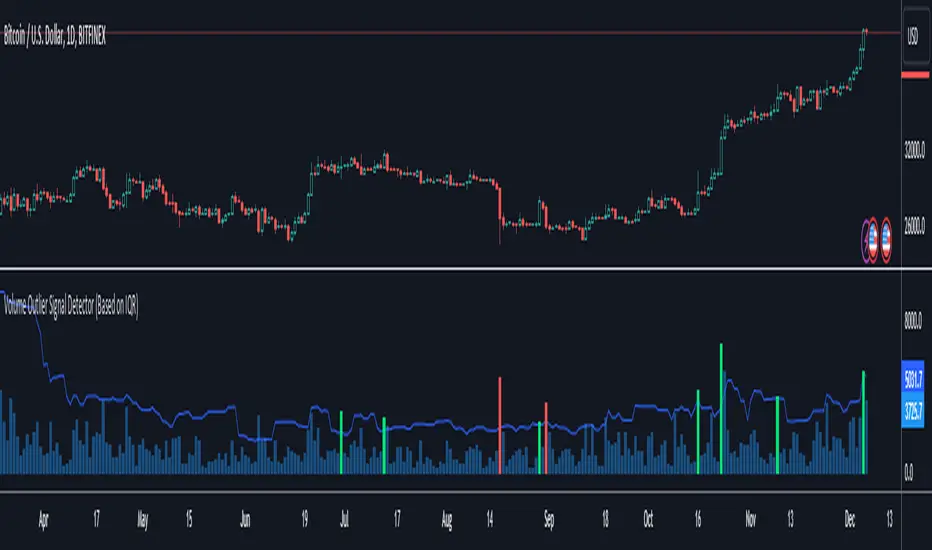
Volume Outlier Signal Detector (Based on IQR)This indicator can detect outliers in trading volume using the 1.5 IQR rule or the outlier formula.
The outlier formula designates outliers based on upper and lower boundaries. Any value that is 1.5 times the Interquartile Range (IQR) greater than the third quartile is designated as an outlier.
The indicator computes the Q3 (75th percentile) and Q1 (25th percentile) of a given volume dataset. The IQR is then calculated by subtracting the Q1 volume from the Q3 volume.
To identify volume outliers, the indicator uses the formula:
Q3 Volume + IQR Multiplier(1.5) * IQR
If the trading volume surpasses the volume outlier, the indicator will display either a green or red column.
A green column indicates that the current bar volume is higher than the volume outlier, and simultaneously, the current bar close is higher than the previous bar's close. Vice versa for the red column.
Moving averages are an optional parameter that can be added to filter out instances where the indicator shows a green or red column. If this option is enabled, the indicator will not display a green column if the price is not above the moving average, and vice versa for red columns.
Several settings can be customized to personalize this indicator, such as setting the moving average filter to higher timeframes. The MA type can also be switched, and IQR settings can be adjusted to fit different markets.
This indicator only works with TradingView charts with volume data.
***Disclaimer:
Before using this indicator for actual trading, make sure to conduct a back test to ensure the strategy is not a losing one in the long run. Apply proper risk management techniques, such as position sizing and using stop loss.
Volume CVD and Open InterestVolume, Cumulative Delta Volume and Open Interest are great indications of strength and sentiment in the market. Until now they have required separate indicators, but this indicator can show them all.
With a clean and aesthetic plot, this indicator has the option to choose the data source:
- Volume - the total volume of transactions, buys and sells
- Up Volume - the total volume from buys only
- Down Volume - the total volume from sells only
- Up/Down Volume (Net) - the difference in the Buy Volume and Sell Volume
- Cumulative Delta - the sum of the up/down volume for the previous 14 bars
- Cumulative Delta EMA - a smoothed average of the sum of the up/down volume for the previous 14 bars, over a 14 period EMA
- Open Interest - a user defined ticker, whose value is added to the plot, while this is designed to be used with Open Interest tickers, you can actually choose any ticker you want, perhaps you want to see DXY while charting Bitcoin!
There are several customization features for the colour of the plot, with a nice gradient colouring from high to low. You can choose the lookback which defines only the highest and lowest values for the colour gradient. There is also an option for how the Open Interest value is determined, based on Close, Open or differences between previous values.
While similar, Volume and Open Interest are not the same. To me the simplest explanation is Volume shows the trades that have been executed and the buy/sell direction, while Open Interest shows the value of open trades that are yet to be completed.
Volume shows strength, sentiment and volatility.
Open Interest does not show direction, but does indicate momentum and liquidity in the market.

Volume DeltaThis script is meant to only show you the most significant volume moves. The way it works is it takes the cumulative sum of the delta of the volume. You can go from current all the way to ten bars back in your delta window.
Review on what volume is: The Volume indicator measures how much of a given financial asset has traded in a specific period of time. Volume is measured by shares traded for stocks, whereas for futures, it is based on the number of contracts.

Hussarya Volume cumulated. Buy Sell.
Volume frome curent chart or cumulated volume from Binance, Bybit Kraken, Ftx and Coinbase.
You can chose also. log scale on simple or cumulated volume.
Colors:
Grey. total volume
Red. sell Volume
Green. Buy volume
Red or green shows only bigger value

Volume Value per UnitThis script will plot the result of Volume / Close.
This is meant to normalize the volume of tickers with exponential growth, for example a ticker like $BTC that went from $1 to $50k. Having the volume divided by the close will normalize the volume for when the price was $1 and $50k.
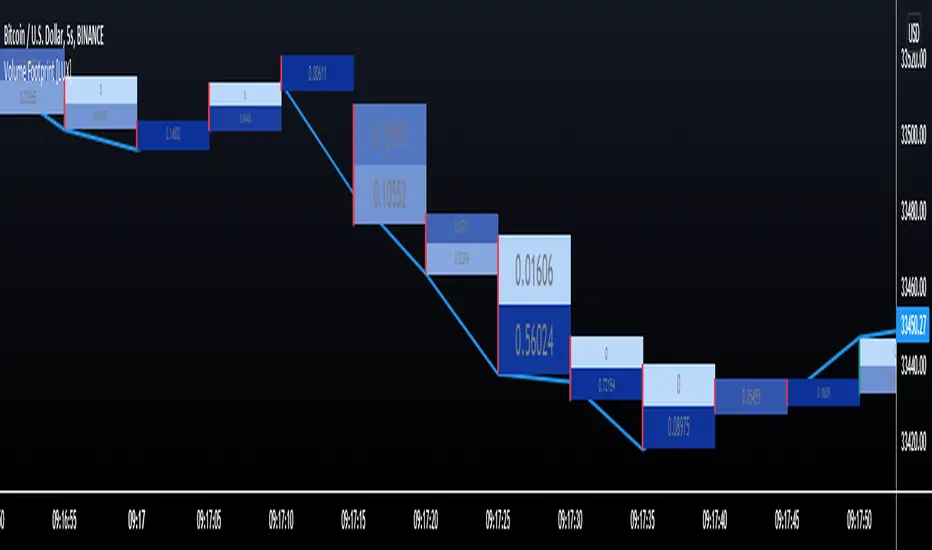
Volume Footprint [LuxAlgo]This indicator estimates a volume footprint using tick data. The script automatically separates a candle into equidistant intervals with a width obtained from the average true range or a user-given width.
Settings
Method: Interval width calculation method. This ultimately determines the number of intervals separating one candle.
Width (At the right of Method): Atr period or user given width depending on the selected method. A lower user-given width would divide a candle into a higher number of intervals.
As Percent: Returns the accumulated volume within each interval as a percentage of the total candle volume.
Style
Display Type: Determines the appearance of the returned volume footprint.
Trend Color: Color to use based on whether a candle is bullish or bearish.
Usage
When applied to a chart, the user will be asked to select the settings to use for the volume footprint. Note that changing the settings afterward will reset the volume footprint, removing previously generated footprints.
A new footprint will appear on the confirmation of a new bar, as such this version might only be useful in lower timeframes.
A volume footprint allows users to see the number of contracts exchanged within a candle interval. It can as such be seen as some kind of intrabar volume profile.
This can be useful to see areas of interest within a candle.
Different Appearance
By default, the volume footprint makes use of colored boxes with a color based on whether the candle was bullish or bearish.
Another appearance that gives additional information is the gradient type, which uses intervals color based on the number of contracts exchanged within an interval relative to the total volume of the candle. A higher number of contracts within an interval would return a darker color by default.
The regular display type makes use of boxes with a single color, with lines on the side indicating whether the candle was bullish or bearish.
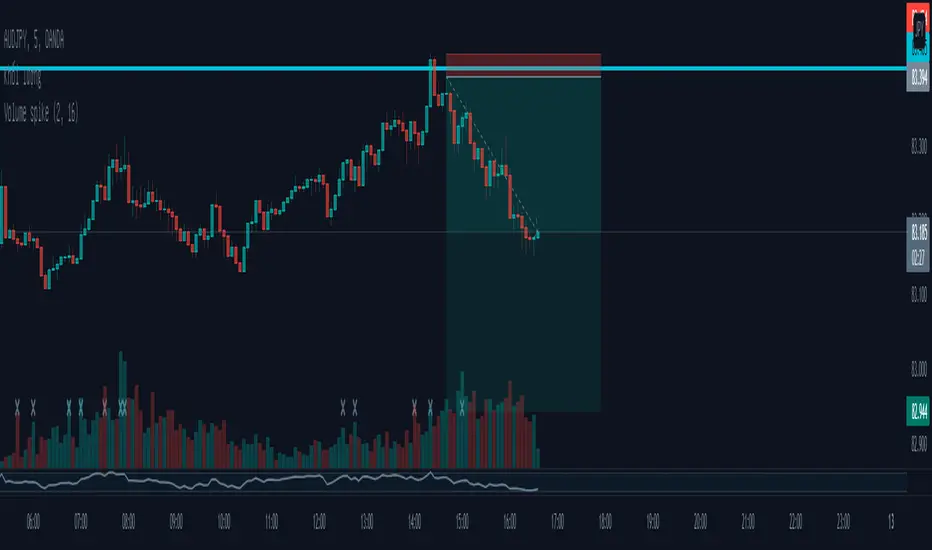
Volume spikeTo locate volume spikes, you compare a single day's volume to average volume. If one day's volume is two to three times the average volume, it will appear as a spike. Unusually large volume often foreshadows a major change in price trend.
Volume Pressure AnalysisVolume Pressure Analysis is a new concept I have been working on designed to show the effort required to move price. An ideal tool for confirming trends or locating reversals early. This indicator can highlight whale action and market manipulation. It calculates volume vs volatility and displays the results as a meter:
Above 0 shows how easy price action is traveling, the bigger these bars the less volume and effort is required to push price. These are indicated with a teal or red arrows and can confirm the beginning or continuation of a trend. This is the natural direction the chart wants to travel at that time.
Below 0 shows how hard price is to move. The bigger these bars the more volume and effort is required to push price. When whales and market makers push price against its will these bars will get bigger.
Yellow arrows signal pressure in that direction and excessive amounts of volume is required to move price. These signals can lead to reversal/ pivot points as price action struggles to continue its trend. These signals can be turned on in settings or use the overlay version of this script to display signals on chart. This is a very powerful tool when used with relative volume.

Volume fightThe Volume fight indicator looks for the predominance of bullish or bearish trading volume on the chart by dividing the trading volume in the bar into 2 parts - "bullish volume" and "bearish volume", and comparing the weighted average values by volume with each other at a given distance.
This indicator is suitable for any instrument (cryptocurrency, Forex, stocks) and is able to work on any TF.
The Volume fight indicator should be used as an auxiliary indicator that tells you who is currently prevailing in the market - " bulls "or"bears".
To configure the indicator, it is necessary to set the range of evaluation of the predominance of bullish or bearish volume (the number of bars, by default-24 bars for TF=1H). The smaller the TF, the higher the range value should be used to filter out false signals.
When there is a predominance of "bulls" on the chart, a green triangle appears (relevant at the close of the bar) and the histogram is highlighted in green, when "bears" appear on the chart, a red triangle appears (relevant at the close of the bar) and the histogram is highlighted in red.
In the indicator settings, there is smoothing to reduce false signals and highlight the flat zone by specifying a percentage, at least which should be the difference between the forces of the "bullish" and "bearish" volume. If the difference between the volume forces is less than the specified one (by default-15%), the zone is considered flat and is displayed in gray on the histogram.
If you set the percentage to zero, the flat zones will not be highlighted, but there will be much more false signals, since the indicator becomes very sensitive when the smoothing percentage decreases.
There is a function-to show the color background of the current trading zone. For" bullish "- green, for" bearish " - red.
In the settings, you can enable the display and use of each signal in the trading zone, not only the initial one, but also each after the flat zone. By default, only the signal of the beginning of the ascending/descending zone is used.
The indicator has alerts for "bullish" and "bearish" movements. Use alerts - "Once per bar close".
If you have any questions, you can write to me in private messages or by using the contacts in my signature.
----------------------------------------------------
Индикатор Volume fight ищет на графике преобладание бычьего или медвежьего объёма торгов путём разделения торгового объёма в баре на 2 части - "бычий объём" и "медвежий объём", и сравнения средне-взвешенных значений по объёму между собой на заданной дистанции.
Данный индикатор подходит для любого инструмента (криптовалюта, Forex, акции) и способен работать на любом ТФ.
Индикатор Volume fight следует использовать как вспомогательный индикатор, который подсказывает Вам кто сейчас преобладает на рынке - "быки" или "медведи".
Для настройки индикатора необходимо выставить диапазон оценки преобладания бычьего или медвежьего объема (количество баров, по умолчанию - 24 бара для ТФ=1Ч). Чем меньше ТФ, тем выше следует использовать значение диапазона, чтобы отфильтровать ложные сигналы.
При возникновении преобладания на графике "быков" появляется зелёный треугольник (актуален по закрытию бара) и гистограмма подсвечивается зелёным цветом, при возникновении на графике "медведей" появляется красный треугольник (актуален по закрытию бара) и гистограмма подсвечивается красным цветом.
В настройках индикатора есть сглаживание для уменьшения ложных сигналов и выделения зоны флета с помощью указания процента, не менее которого, должна быть разница между силами "бычьего" и "медвежьего" объёма. Если разница между силами объёмов меньше заданного (по умолчанию - 15%), то зона считается флетовой и отображается на гистограмме серым цветом.
Если выставить процент равным нулю, то зоны флета выделяться не будут, но будет гораздо больше ложных сигналов, так как индикатор становится очень чувствительным при снижении процента сглаживания.
Есть функция - показывать цветовой фон текущей торговой зоны. Для "бычьего" - зелёный, для "медвежьего" - красный.
В настройках можно включить отображение и использование каждого сигнал в торговой зоне, не только начального, но и каждого после зоны флета. По умолчанию - только сигнал начала восходящей/нисходящей зоны.
Индикатор имеет оповещения для "бычьего" и "медвежьего" движения. Используйте оповещения - "на закрытии бара".
По любым вопросам Вы можете написать мне в личные сообщения или по контактам в моей подписи.
