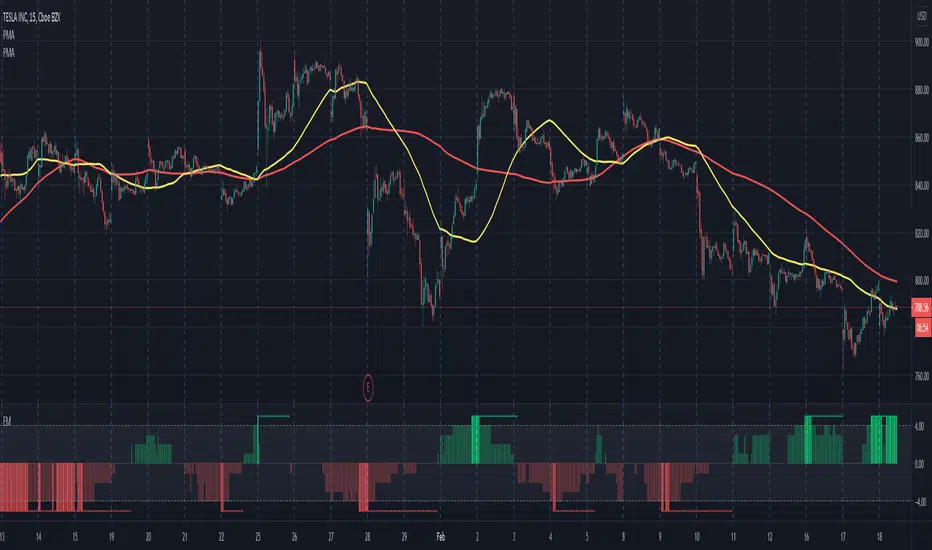
Trend Trader Buy/Sell SignalsTrend Trader
The code is open source, what it uses to print signals is MACD cross and ADX. Bar colors change in relation to where price is according to the 50 day MA. The MA ribbon is used for visualizing trend and using it for dynamic support/resistance. The ribbon is comprised of the 50 day and 100 day MAs.
Main reason to publish this script is because some like to jumble up scripts together slap some moving averages on it to "follow trend" and then label it an algorithm, market it and sell it to people online. No single system will work 100% of the time, do you due diligence in anything you are interested in buying. Plenty of free scripts in the TV library that can do you justice when trading.
"signal" için komut dosyalarını ara

Bollinger Band Crossover SignalI'm a little surprised I couldn't find a BB crossover script on here since I've always used it on other charting software. So of course I had to write one in for TradingView.
Essentially what this script signifies are price breakouts when price crosses over the upper BB band. So what it shows is that market conditions are entering overbought territory.
Length is set to 20 and Standard Deviation is set to 2. These are the default settings.
The way I use the script is to identify breakouts in price, as well as a signal to start scaling out of a position if I am already in one.

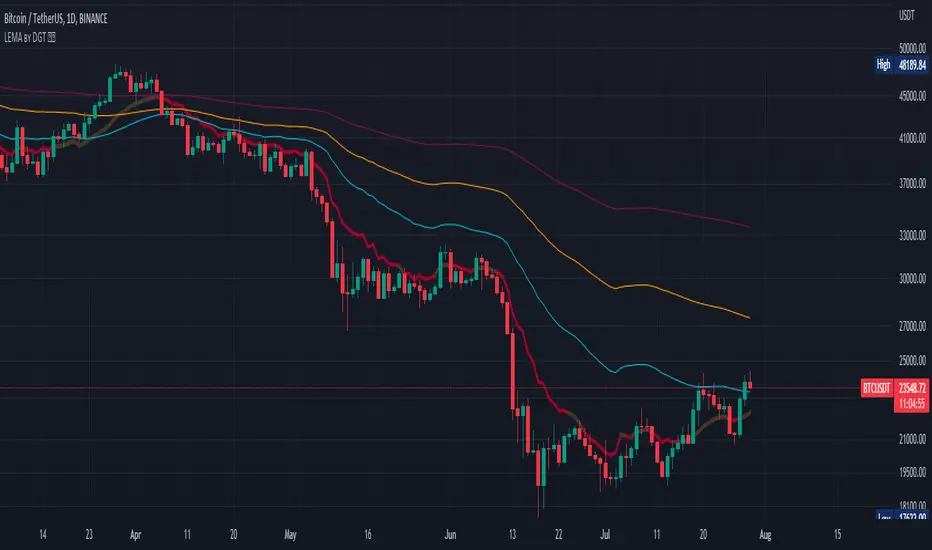
Logistic EMA w/ Signals by DGTLogistic Map Equation - The logistic map connects fluid convection, neuron firing, the Mandelbrot set and so much more.
This study is an attempt to apply Logistic Map Equation in Trading
Logistic Map Equation
Xn+1 = r * Xn * (1 - Xn)
Where,
r - growth rate
Xn - percentage of theoretical maximum of measured event (from 0 to 1)
(1 - Xn) - represents constraints of the environment, presents the idea of negative feedback
For trading the measured event will be the price of the instrument (price is commonly reffered as source in mathematicall forumlations),
hence
r - growth rate can be expressed as => change(source, length) / source, expressing r in such manner mades the equation dynamic with regards to the growth rate
Xn - percentage of theoretical maximum of the price for given duration can be expressed as => source / highest(length)
Putting pieces together we are ready to plot
Printed alone does not seem to provide much useful visualization for trading, in fact not easy to interpret especially when the market is an uptrend
What it has numerically,
Provides a ratio, where sudden changes are much more reflected thanks to negative feedback nature of the logistic equation.
As we know moving average indicators are lagging and the logistic map may fit here to reduce the lag
With this study you will find application of Logistic Map Equation with combination of Exponential Moving Average (EMA)
Logistic EMA (LEMA) and LEMA COLORS
one line with user defined periods of length, where the colors of the line will change automatically depending where the value is compared to 50-100-200 moving average
Multiple LEMAs : optional – three fixed lenght of 50-100-200 period lines
LEMA Signals
Various signals are added by using LEMA and applying some common market approaches. Use with caution and with conjunction of other indicators
Thanks to @allanster for the idea
A fascinating YouTube video explaining the logistic map - “This equation will change how you see the world (the logistic map)”
Disclaimer:
Trading success is all about following your trading strategy and the indicators should fit within your trading strategy, and not to be traded upon solely
The script is for informational and educational purposes only. Use of the script does not constitute professional and/or financial advice. You alone have the sole responsibility of evaluating the script output and risks associated with the use of the script. In exchange for using the script, you agree not to hold dgtrd TradingView user liable for any possible claim for damages arising from any decision you make based on use of the script
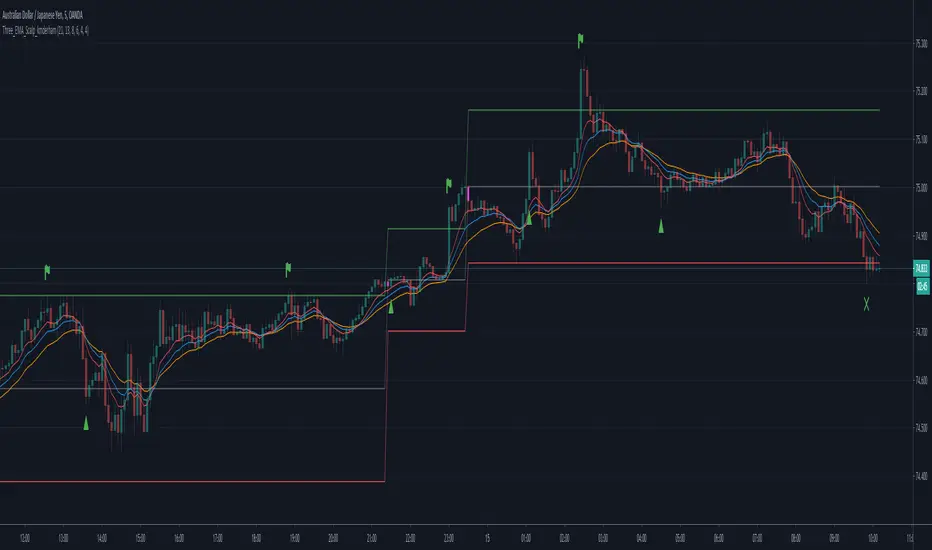
Three EMA Scalp Signals by kmderhamThis script looks for a set up condition where 5 consecutive candles have broken away from the fast EMA (set to 8 by default) followed by a "trigger" candle that crosses back over the fast EMA but not the medium EMA (set to 13 by default). It then determines the entry point based on the bar high or low (not tail or wick) depending on direction of the trend. Once the entry point is crossed, we can enter the position. Win or loss is determined whether the lower or upper levels are crossed (as per trend). After the position is won or lost and if the entry level is re-crossed before a new set up condition is found then a new entry signal is given.
Please note that this should really be used in conjunction with a higher timeframe "Anchor" chart with a fast and a slow EMA so setups and positions should should correspond to the trend of the higher timeframe chart. This was designed for a 5 minute timeframe and a 60 minute anchor chart.
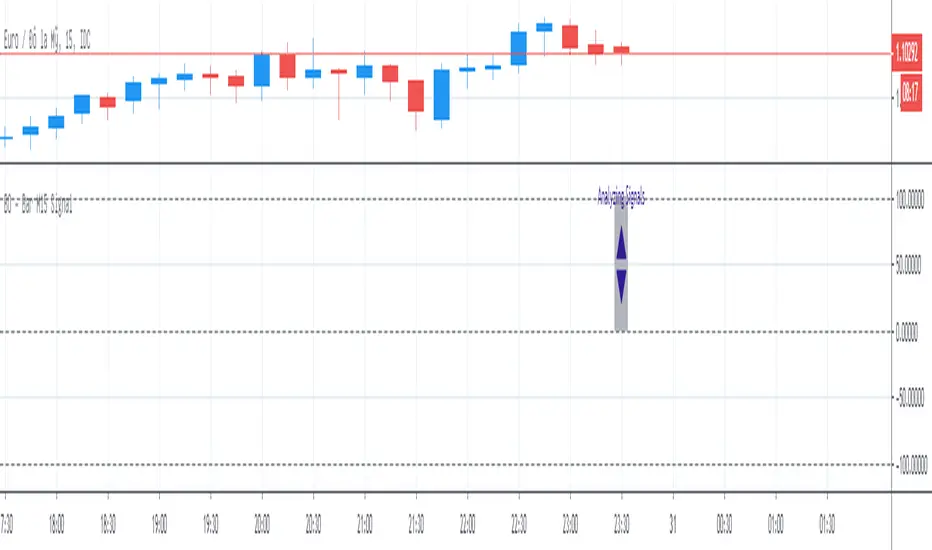
BO - Bar M15 2/3 SignalBO - Bar M15 2/3 Signal show the signal to trade Binary Option with rule below:
A. Indicator
* Bollinger Band (20,2): avoid waterfall
B. Rule of Signal
1. Rule1: Split Bar M15 to 3 part and load them on M5 chart (recommend use M5 IDC chart)
2. Rule 2: Delay 10' after bar M15 open => wait for price's pattern
3. Rule 3: Put Signal row 30-32
* Delay 10' after bar M15 open.
* Direction of 1/3 and 2/3 Bar M15 is upward
* close of 2/3 Bar M15 below upper band Bb(20,2) on M5 chart => avoid strong buy
4. Rule 4: Call Signal row 36-38
* Delay 10' after bar M15 open.
* Direction of 1/3 and 2/3 Bar M15 is downward
* close of 2/3 Bar M15 above lower band Bb(20,2) on M5 chart => avoid strong sell
C. Recommend Expiry time: Bar M15 close
* We try to catch the shadow of Bar M15 but dont trade when price run on the upper or lower band of BB(20,2,M5)

BO - Bar M15 Signal* This script show the signal base on volatility of previous bar M15 to trade Binary Option.
* Rule of Signal is below:
A. Rule 1: Wait for prices created temporary peak and bottom
Row 18: 10 minutes till close
B. Rule 2: Reversal previous bar's direction
1. Put Signal - Row 22 - 25:
- Delay 5' after bar M15 open
- previous bar's direction is upward
- price less than previous close
- temporary bottom greater than previous open
2. Call Signal - Row 29 - 32:
- Delay 5' after bar M15 open
- previous bar's direction is downward
- price greater than previous close
- temporary peak less than previous open
C. Rule 3: Follow previous bar's direction
1. Put Signal - Row 37 - 40:
- Delay 5' after bar M15 open
- previous bar's direction is downward
- price greater than previous open
- temporary peak less than previous peak
2. Call Signal - Row 43 - 46:
- Delay 5' after bar M15 open
- previous bar's direction is upward
- price less than previous open
- temporary bottom greater than previous bottom
Doji signalsYou can create an alert based on this signal :)
Works on standard and Heikin-ashi candles
You can also adjust the sensitivity (how big you want the body of the doji)
:)

RN MACD SignalsThis is my simple way to quickly see MACD signals without having the MACD taking up space. The one at the bottom is for display to show how this works. A crossover occurs when the arrow flips over. The position of the arrow tells you if it is currently above or below the zero line. You can change the script to overlay and have it show up above or below price also. Let me know what you think.

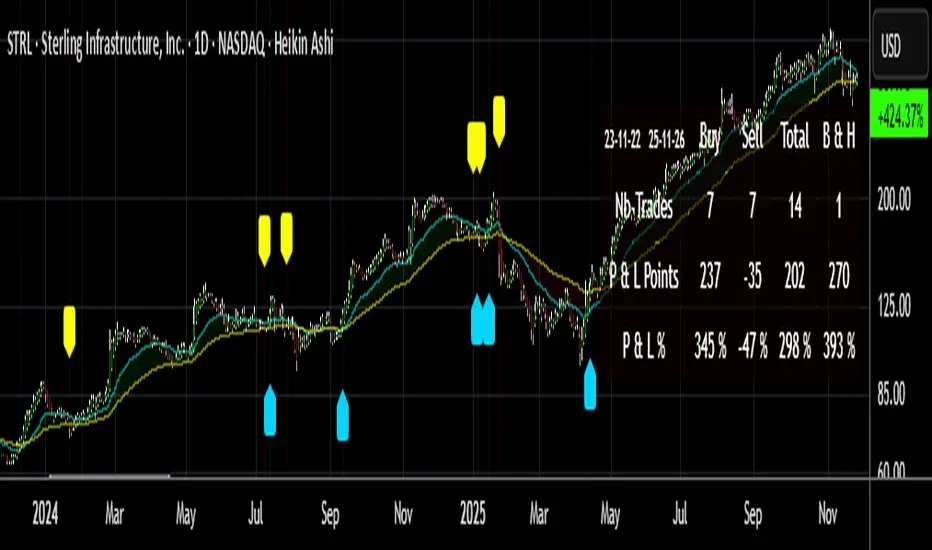
Buy/Sell Signals [WynTrader]My name is WynTrader. I cumulate 24 years of experience.
This Indicator produces Buy/Sell Signals using these features:
- Fast and Slow Moving averages (modifiable) optimized at EMA-8 and SMA-35
- Bollinger Bands (modifiable) optimized at Basis-18 and Multiplier-1
Also, the Buy/Sell Signals are conditioned by three Filters (optionable, modifiable) :
. Bollinger-Bands Lookback
. High-Low vs Candle Range %
. Distance from Fast and Slow Moving averages %
The Results Calculation presented in a Table are based :
- on the Current Chart Visible Range (optionable)
or
- on the specified TIme Frame Start and End Dates (modifiable)
The Table shows Calculation Results of the Buy and Sell Signals that are activated on the chart, with the Number of Trades (Signals), the Winning Points and the Win Rate %. The Buy&Hold starts calculation at the first Buy encountered.
So be surprised by my Buy/Sell Indicator. But always remember that the world is not perfect. The Graal Indicator, even with AI, doesn't already exist, maybe one day (all of us richier...), but not now. , depending on the chart product (stocks...), volatility, probabilities, unpredictable behaviour. , the moves, etc.
Enjoy
WynTrader
P. s. :
My name is WynTrader. I cumulate 24 years of experience. In 2001, I took an intensive technical analysis course taught by an exceptional friend, Cyril, who taught me everything I know. The foundation I gained through his teaching remains solid and relevant to this day, never failing me.
Before i made this Indicator, I have used many Trading View Buy/Sell Indicators using alone or combined RSI, SMI, OBV, MACD ATR, ADX, Neural, Fractal, Geometry, etc., that are already available for the Trading View community. A great thanks to those who give their time that help me build this tool.
Note that I'm not a programmer, so... ;-)
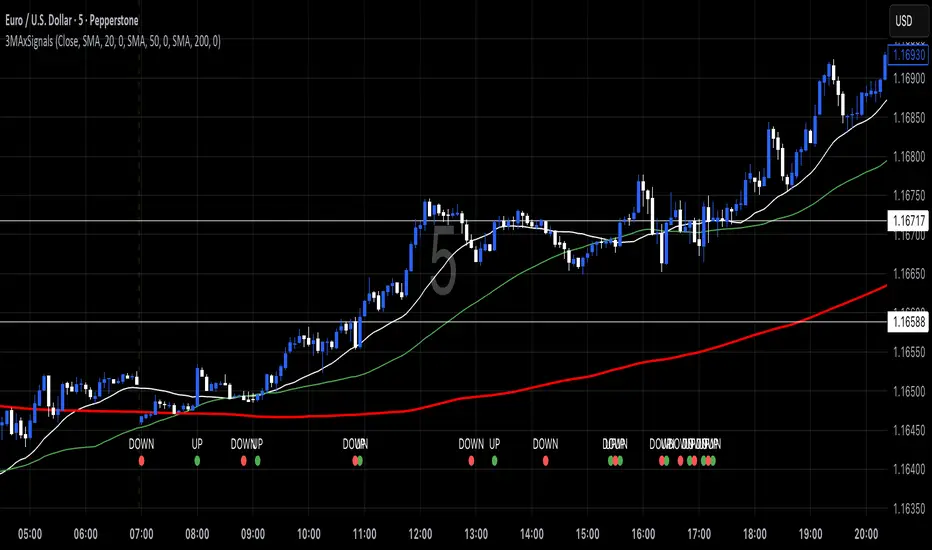
3 MA's with Crossing SignalsPlots three fully configurable moving averages on one chart and prints/alerts BUY/SELL signals when price crosses your chosen MA(s). Built to match TradingView’s built-ins exactly.
Features
Per-line MA type: SMA, EMA, SMMA (RMA), WMA, VWMA
Per-line settings: length, color, offset
Source control: Close, Open, High, Low, HL2, HLC3, OHLC4
Optional Heikin Ashi calculation for both the MAs and the cross price
Toggle signals vs MA1 / MA2 / MA3 independently
Alert conditions for every cross (ready for “Once per bar close”)
How signals work
UP when the selected price stream crosses above the chosen MA
DOWN when it crosses below
Signals/alerts follow your selected source (and HA toggle) to keep everything consistent.
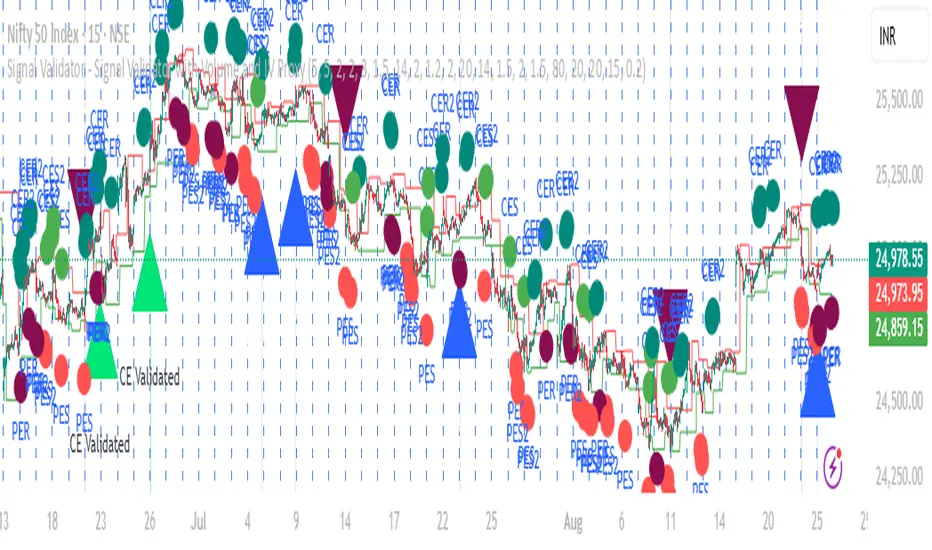
Signal Validator - Signal Validator with Volume and IV ProxySignal Validator - Signal Validator with Volume and IV Proxy
SuperTrend Confluence Signals [AlgoAlpha]OVERVIEW
This script enhances the classic SuperTrend indicator by integrating volume dynamics, retracement detection, and a multi-asset trend matrix—alongside an automatic mitigation-level drawing system. It's designed for traders who want to see not just trend direction, but the confluence of trend strength, volatility-adjusted retracements, and capital flow through volume pressure. It visually maps key transitions in market structure while offering a clean, color-coded overview of multiple symbols and timeframes in a single chart.
CONCEPTS
At the core is the traditional SuperTrend , which determines directional bias using Average True Range (ATR) with a volatility multiplier. This script overlays that with a dynamic volume histogram that scales relative to recent volume standard deviation, coloring volume bursts within the trend. Retracement signals are triggered when price pulls back toward the SuperTrend level but respects it—quantified through normalized distance sensitivity. On top of that, the indicator automatically draws and manages horizontal support/resistance zones that appear at key trend shifts. These levels persist and are cleared based on configurable rules such as wick/body sweeps or consecutive candle closes. A multi-asset, multi-timeframe table then gives an instant snapshot of trend status across five user-defined symbols and timeframes.
FEATURES
SuperTrend : Configurable ATR length and multiplier for flexible trend sensitivity.
Volumetric Histogram : Gradient-filled candles anchored to SuperTrend bands, scaled by relative volume to indicate activity intensity during trends.
Retracement Arrows : Signals printed when price nears the SuperTrend level without breaking it, allowing identification of high-probability continuation zones.
Volume TP Markers : Diamond markers flag high-volume events, contextualizing price moves with liquidity bursts.
Automatic Structure Levels : Draws clean horizontal lines at significant trend transitions, with optional volatility-based band fills. These levels self-update and clear based on price interaction logic.
Trend Table : Displays trend direction (▲/▼) across five assets and five timeframes. Each cell is colored according to trend bias, providing a compact overview for multi-market confluence.
USAGE
Start by loading the indicator on your main chart and adjusting the ATR Length and Multiplier to match your strategy timeframe. Use lower values for scalping and higher values for swing trading. The histogram bars will appear as colored candles above or below the SuperTrend level, indicating how strong volume is within that trend. Arrow signals suggest minor pullbacks within the trend, which can act as entry opportunities. The level system will automatically plot key price zones during trend flips; if "Body" is selected for mitigation, price must close through the level to invalidate it. If "Wick" is chosen, a single wick breach is enough. Adjust expiry and rejection settings to fine-tune how long levels stay on chart. Finally, enable the Multi-Asset Table to view live trend signals across popular symbols like AAPL or NVDA in different timeframes, helping spot macro-to-micro alignment for higher-confidence trades.

Breakout and Retest Signals [AlgoAlpha]OVERVIEW
This script detects breakout and retest signals by identifying key pivot points in price action and analyzing their relationship with historical swing highs and lows. It highlights breakout structures using ATR-based tolerance levels and volume analysis to confirm potential trend continuations or reversals. The script marks significant price levels with dynamic boxes and dashed lines to help traders visualize breakout and retest areas effectively.
CONCEPTS
The script relies on pivot point analysis, a technique used to identify significant price levels where the market has previously reversed. It dynamically tracks a set number of recent swing highs and lows, allowing traders to see if the price is revisiting a previously significant level. The concept of breakouts and retests is widely used in technical analysis to determine potential entry points. A breakout occurs when the price moves beyond a resistance or support level, and a retest happens when the price returns to test that level before continuing in the breakout direction. This script enhances that analysis by incorporating ATR-based tolerance levels, ensuring that price zones are not too large.
FEATURES
Breakout and Retest Markings : Highlights breakout and retest areas with shaded boxes, allowing traders to visualize where price action is confirming key levels.
Volume Delta and Ratio : Analyzes volume at breakout levels to gauge the strength of the move, displaying volume delta information for additional context. The script also displays the ratio of selling to buying at the retest along traders to make better judgement on their entries.
Multi-Timeframe Adaptability : Dynamically adjusts volume analysis to align with the appropriate lower timeframe, ensuring reliable volume comparisons.
Alerts for Breakout and Retest Events : Traders can receive real-time notifications when bullish or bearish breakout retests are detected.
USAGE
This script is best suited for traders looking to identify strong breakout and retest setups across different timeframes. Users can customize the pivot detection period and swing point memory to adjust sensitivity based on their trading style. The ATR length and multiplier allow further refinement of breakout tolerance, reducing noise in volatile markets. The breakout zones are displayed as shaded boxes, where traders can assess whether a price retest is occurring under favorable conditions. Alerts can be set to notify traders of potential trade opportunities.

Luma Signals – Orderflow ImbalanceLuma Signals – Imbalance Detector
The Luma Signals – Imbalance Detector highlights price inefficiencies where buying or selling pressure dominates, causing rapid market movements. These imbalances can act as potential support and resistance zones or indicate areas where liquidity needs to be filled.
🔹 Key Features:
✔ Identifies Bullish & Bearish Imbalances – Blue candles indicate strong buying pressure, red candles indicate strong selling pressure.
✔ Clear Market Structure – Normal bullish candles appear in light gray, normal bearish candles in white.
✔ Dynamic Orderflow Analysis – Helps traders spot high-volatility price movements and potential reversals.
✔ No repainting & lightweight – The indicator works in real-time without altering past data.
📊 How to Use:
Trend Confirmation: If an imbalance aligns with a strong trend, it may indicate trend continuation.
Liquidity Gaps: Price often revisits imbalances before continuing its movement.
Scalping & Intraday Trading: Identify key reaction points for short-term trades.
Kalman Step Signals [AlgoAlpha]Take your trading to the next level with the Kalman Step Signals indicator by AlgoAlpha! This advanced tool combines the power of Kalman Filtering and the Supertrend indicator, offering a unique perspective on market trends and price movements. Designed for traders who seek clarity and precision in identifying trend shifts and potential trade entries, this indicator is packed with customizable features to suit your trading style.
Key Features
🔍 Kalman Filter Smoothing : Dynamically smooths price data with user-defined parameters for Alpha, Beta, and Period, optimizing responsiveness and trend clarity.
📊 Supertrend Overlay : Incorporates a classic Supertrend indicator to provide clear visual cues for trend direction and potential reversals.
🎨 Customizable Appearance : Adjust colors for bullish and bearish trends, along with optional exit bands for more nuanced analysis.
🔔 Smart Alerts : Detect key moments like trend changes or rejection entries for timely trading decisions.
📈 Advanced Visualization : Includes optional entry signals, exit bands, and rejection markers to pinpoint optimal trading opportunities.
How to Use
Add the Indicator : Add the script to your TradingView favorites. Customize inputs like Kalman parameters (Alpha, Beta, Period) and Supertrend settings (Factor, ATR Period) based on your trading strategy.
Interpret the Signals : Watch for trend direction changes using Supertrend lines and directional markers. Utilize rejection entries to identify price rejections at trendlines for precision entry points.
Set Alerts : Enable the built-in alert conditions for trend changes or rejection entries to act swiftly on trading opportunities without constant chart monitoring.
How It Works
The indicator leverages a Kalman Filter to smooth raw price data, balancing responsiveness and noise reduction using user-controlled parameters. This refined price data is then fed into a Supertrend calculation, combining ATR-based volatility analysis with dynamic upper and lower bands. The result is a clear and reliable trend-detection system. Additionally, it features rejection markers for bullish and bearish reversals when prices reject the trendline, along with exit bands to visualize potential price targets. The integration of customizable alerts ensures traders never miss critical market moves.
Add the Kalman Step Signals to your TradingView charts today and enjoy a smarter, more efficient trading experience! 🚀🌟

Quick scan for signal🙏🏻 Hey TV, this is QSFS, following:
^^ Quick scan for drift (QSFD)
^^ Quick scan for cycles (QSFC)
As mentioned before, ML trading is all about spotting any kind of non-randomness, and this metric (along with 2 previously posted) gonna help ya'll do it fast. This one will show you whether your time series possibly exhibits mean-reverting / consistent / noisy behavior, that can be later confirmed or denied by more sophisticated tools. This metric is O(n) in windowed mode and O(1) if calculated incrementally on each data update, so you can scan Ks of datasets w/o worrying about melting da ice.
^^ windowed mode
Now the post will be divided into several sections, and a couple of things I guess you’ve never seen or thought about in your life:
1) About Efficiency Ratios posted there on TV;
Some of you might say this is the Efficiency Ratio you’ve seen in Perry's book. Firstly, I can assure you that neither me nor Perry, just as X amount of quants all over the world and who knows who else, would say smth like, "I invented it," lol. This is just a thing you R&D when you need it. Secondly, I invite you (and mods & admin as well) to take a lil glimpse at the following screenshot:
^^ not cool...
So basically, all the Efficiency Ratios that were copypasted to our platform suffer the same bug: dudes don’t know how indexing works in Pine Script. I mean, it’s ok, I been doing the same mistakes as well, but loxx, cmon bro, you... If you guys ever read it, the lines 20 and 22 in da code are dedicated to you xD
2) About the metric;
This supports both moving window mode when Length > 0 and all-data expanding window mode when Length < 1, calculating incrementally from the very first data point in the series: O(n) on history, O(1) on live updates.
Now, why do I SQRT transform the result? This is a natural action since the metric (being a ratio in essence) is bounded between 0 and 1, so it can be modeled with a beta distribution. When you SQRT transform it, it still stays beta (think what happens when you apply a square root to 0.01 or 0.99), but it becomes symmetric around its typical value and starts to follow a bell-shaped curve. This can be easily checked with a normality test or by applying a set of percentiles and seeing the distances between them are almost equal.
Then I noticed that on different moving window sizes, the typical value of the metric seems to slide: higher window sizes lead to lower typical values across the moving windows. Turned out this can be modeled the same way confidence intervals are made. Lines 34 and 35 explain it all, I guess. You can see smth alike on an autocorrelogram. These two match the mean & mean + 1 stdev applied to the metric. This way, we’ve just magically received data to estimate alpha and beta parameters of the beta distribution using the method of moments. Having alpha and beta, we can now estimate everything further. Btw, there’s an alternative parameterization for beta distributions based on data length.
Now what you’ll see next is... u guys actually have no idea how deep and unrealistically minimalistic the underlying math principles are here.
I’m sure I’m not the only one in the universe who figured it out, but the thing is, it’s nowhere online or offline. By calculating higher-order moments & combining them, you can find natural adaptive thresholds that can later be used for anomaly detection/control applications for any data. No hardcoded thresholds, purely data-driven. Imma come back to this in one of the next drops, but the truest ones can already see it in this code. This way we get dem thresholds.
Your main thresholds are: basis, upper, and lower deviations. You can follow the common logic I’ve described in my previous scripts on how to use them. You just register an event when the metric goes higher/lower than a certain threshold based on what you’re looking for. Then you take the time series and confirm a certain behavior you were looking for by using an appropriate stat test. Or just run a certain strategy.
To avoid numerous triggers when the metric jitters around a threshold, you can follow this logic: forget about one threshold if touched, until another threshold is touched.
In general, when the metric gets higher than certain thresholds, like upper deviation, it means the signal is stronger than noise. You confirm it with a more sophisticated tool & run momentum strategies if drift is in place, or volatility strategies if there’s no drift in place. Otherwise, you confirm & run ~ mean-reverting strategies, regardless of whether there’s drift or not. Just don’t operate against the trend—hedge otherwise.
3) Flex;
Extension and limit thresholds based on distribution moments gonna be discussed properly later, but now you can see this:
^^ magic
Look at the thresholds—adaptive and dynamic. Do you see any optimizations? No ML, no DL, closed-form solution, but how? Just a formula based on a couple of variables? Maybe it’s just how the Universe works, but how can you know if you don’t understand how fundamentally numbers 3 and 15 are related to the normal distribution? Hm, why do they always say 3 sigmas but can’t say why? Maybe you can be different and say why?
This is the primordial power of statistical modeling.
4) Thanks;
I really wanna dedicate this to Charlotte de Witte & Marion Di Napoli, and their new track "Sanctum." It really gets you connected to the Source—I had it in my soul when I was doing all this ∞

How To Limit Repeating SignalsAn example of how to limit the input number of allowed signals using a function containing a condition counter with a reset.

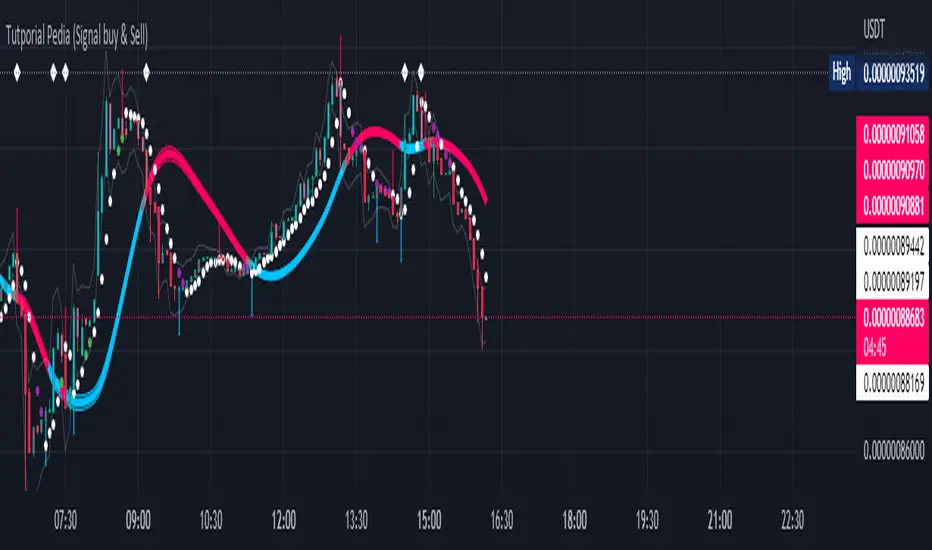
Tutporial Pedia (Signal buy & Sell)Untuk mempermudah kita dalam bermain dan memahami Signal Trade View Rate 98 %
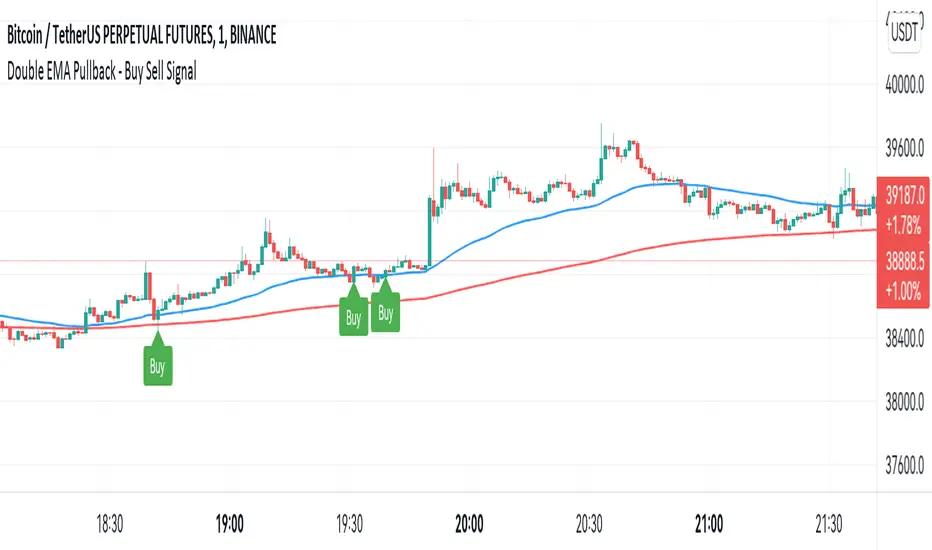
Double EMA WIth Pullback Buy Sell Signal - Smarter AlgoBuilt with love "Double EMA With Pullback Buy Sell Signal "
This indiator will help you to find a Double EMA Pullback Signal
You can combine with your own strategy, or use this purely
DISCLAIMER :
Measure the risk first before use it in real market
Backtest The Strategy was very important, so you know the probability
Fundamentally Logical :
Pullback (Some Previous candle is Red for Bull Pullback vice versa)
the Entry candle must be a Candlestick Pattern
Features :
1. Double EMA
2. Pullback Signal
How to use it :
1. Adjust the Pullback Backstep
2. Adjust the EMA Period
3. Adjust the Style to your preferences
Regards,
Hanabil
Average True Range (VStop) Cloud SignalsThis indicator extends the built-in Volatility Stop indicator to a visual signals type indicator based on the crossover of a small VStop value (default 1.5x ATR) and a larger VStop value (default 3x ATR). The two values form a "cloud" with default coloring based on RSI/strength of trend.

P-Signal GravityP-Signal Gravity will help you choose a trading strategy, taking into account volatility and exchange commissions. The white circles indicate the probabilistic position of the virtual center of gravity. The reliability parameter determines the probability of finding such a center of gravity. The table shows the latest price and the expected P/L, taking into account the exchange commission, which is also a parameter. Due to the overlay type of indicator, the table also contains p-signal values and its increment.

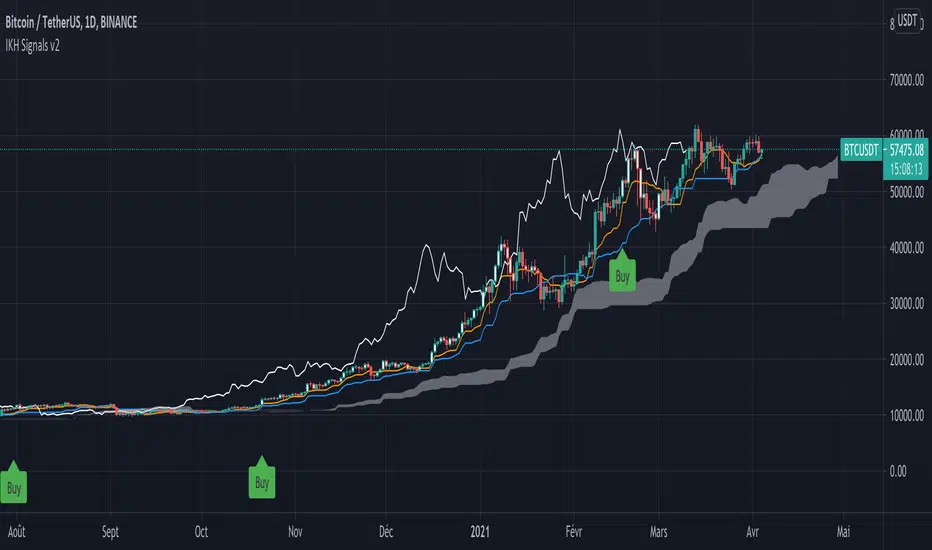
IKH Signals v2Hi,
I'm happy to release this new update after few weeks working.
Fixes
Fix kumo break-out of Chiku span and close price
Fix buy trigger and strong buy trigger
Improvement
Signals take now the kumo thickness and kumo angle
Signals does not trigger on doji candles
Multi time frame validation is now available
I hope this fixes and new features will improve the signals for you too.
Let me know if you find strange behavior or possible improvments.
Electrified Momentum Signal (Prototype)This indicator uses an ensemble of different indicators to help in identifying significant changes in momentum.
It's time-frame is constant and is based up on the length of the configurable period. This allows for a consistent signal across multiple time-frames.
This is not a buy or sell signal but can be used for alerts to indicate a change in momentum that might be worth paying attention to.
If looking for an long entry point, a negative (red) value can signal "don't buy yet" or may simple mean "it's risky". In a similar way if looking for a short, a positive (green) value can signal "not now".
Note: "Electrified" does not mean this has anything to do with electric vehicles or the power grid. :P