TonyUX EMA Scalper - Buy / SellThis is a simple scalping strategy that works for all time frames... I have only tested it on FOREX
It works by checking if the price is currently in an uptrend and if it crosses the 20 EMA.
If it crosses the 20 EMA and its in and uptrend it will post a BUY SIGNAL.
If it crosses the 20 EMA and its in and down it will post a SELL SIGNAL.
The red line is the highest close of the previous 8 bars --- This is resistance
The green line is the lowest close of the previous 8 bars -- This is support
"signal" için komut dosyalarını ara

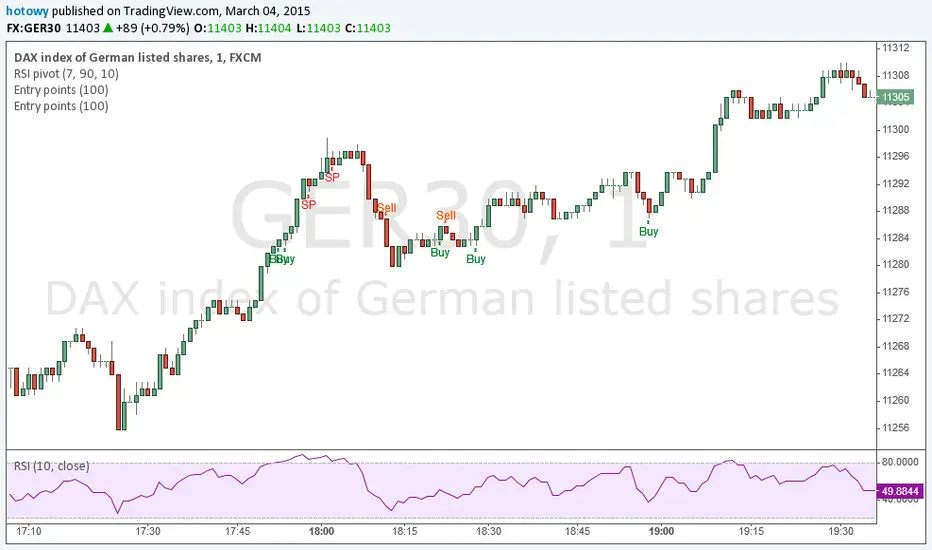
Entry pointsThis great and simple indicator based on EMA generates information about entry points at close of the candle. First signal is the best entry point but you can re-enter at the next. IMPORTANT: this script does not generate exit signals and those shoud be find using money management rules or else. Perfectly catches long runs in trends at all underlayings (forex, stocks, indexes, commodities) at all timeframes. Period=100 works best independently on timeframe but I encourage you to try other. Lower period gives more incorrect signals and shorter runs, higher period gives you late entry and less. Ofcourse it gives false signals from time to time but fortunately it makes a correction very fast. Try it! Good luck and good traiding!
SuperTrend Long/Short Signals“Provides trend-based long and short signals. With regular use while adhering to the entry, stop-loss, and take-profit levels, profits can be achieved.”

Swing Trading Indicator: RSI + EMA + MACD + BB Signals**Swing Trading Indicator: Multi-Indicator Confluence Signals**
This indicator identifies high-probability swing trading setups using RSI pullbacks, EMA trend filter, MACD momentum confirmation, and Bollinger Bands for volatility-based entries. Perfect for daily/4H charts on stocks like TSLA or SPY.
**Key Features:**
- **Long Signal (Green ↑ Arrow)**: Uptrend (above 200 EMA) + RSI crosses above oversold (default 30) + MACD bullish crossover + Price at/near BB lower band + Optional squeeze filter.
- **Short Signal (Red ↓ Arrow)**: Mirror for downtrends.
- **Real-Time Dashboard**: Top-right table shows condition status (✓/✗) and "LONG/SHORT READY" alerts.
- **Customizable**: Adjust RSI levels, BB multiplier, enable/disable shorts/squeeze/arrows.
- **Alerts**: Built-in for entry notifications.
**How to Use:**
1. Add to chart (daily timeframe recommended).
2. Watch for arrows + "READY" in dashboard.
3. Manual entry: Risk 1% per trade, target 1:2 reward (e.g., trail stops).
**Backtest Note**: Based on similar setups, ~55-65% win rate in trending markets (test yourself). Not financial advice—trading involves risk. Fork and improve!
#swingtrading #RSI #MACD #BollingerBands #PineScript

Ahmed Gold Signals - 5M LIVE (Frequent)📈 Gold (XAUUSD) Trading Signals – Precision-Based Strategy
Our Gold signals are built on pure price action, not random indicators or guesswork.
🔍 How our signals are generated
We focus on:
🧲 Liquidity Sweeps
Identifying when price grabs stop-losses above highs or below lows and then reverses
📊 Clear trend direction using EMA 50 & EMA 200
✅ Strong confirmation candles after the sweep
🎯 Entries only in the direction of the trend to increase accuracy
🔵 BUY Signals
Bullish market structure
Price sweeps liquidity below recent lows
Strong bullish confirmation candle closes
➡️ High-probability BUY setup
🔴 SELL Signals
Bearish market structure
Price sweeps liquidity above recent highs
Strong bearish confirmation candle closes
➡️ High-probability SELL setup
⏱️ Timeframe
5-minute chart (5M)
Fast, precise signals ideal for scalping Gold
🛡️ Risk Management
Stop loss placed beyond the liquidity sweep
Clear take-profit targets
Risk-to-reward typically 1:2 or better
⚠️ Important Notes
We do not trade every move
We wait for confirmation
Quality over quantity — always

Entry Scanner Conservative Option AKeeping it simple,
Trend,
RSI,
Stoch RSI,
MACD, checked.
Do not have entry where there is noise on selection, look for cluster of same entry signals.
If you can show enough discipline, you will be profitable.
CT

Swing Trading IndicatorThis script is a swing‑trading dashboard designed for BTC, ETH, S&P 500 (for now). It combines weekly RSI, USDT.D, VIX, moving averages and Fisher Transform into a single visual tool, with background highlights, an on‑chart info table and ready‑made alerts to help you time high‑probability swing entries and manage risk.
1. Overview
The indicator is intended to work on daily timeframe.
Signals are context‑aware: BTC and ETH get USDT.D conditions, SPX gets VIX and EMA‑100 logic, and all non‑ETH symbols can also use Fisher Transform as a mean‑reversion filter.
2. Conditions and background highlights
Each component sets a boolean condition and, when active, paints a background layer:
Weekly RSI condition
True when weekly RSI is below its symbol‑specific threshold.
USDT.D conditions
BTC: triggered when USDT.D is above the user threshold and the chart symbol is BTC.
ETH: same logic for ETH, but tracked separately..
VIX condition (SPX only)
True when VIX high is at or above the VIX threshold while the chart is SPX.
EMA condition (BTC & SPX)
BTC: daily close below EMA‑200.
SPX: daily close below EMA‑100.
Fisher Transform condition (non‑ETH)
Fisher Transform on the chart timeframe, using the configured period.
True when Fisher value is below the Fisher threshold.
3. Intended use and notes
This indicator is designed as a confluence tool for swing traders, not a standalone buy/sell system. It works best on assets that are in a clear uptrend, where the main idea is to accumulate during corrections within that broader bullish structure.
During larger market shocks, deep corrections, or black‑swan events, trend‑based and mean‑reversion filters can produce false signals, because volatility and correlations often behave abnormally in those periods. For that reason, this script should always be combined with independent risk management, higher‑timeframe trend analysis, and your own discretion.

ATR + BJ Signal(GOLD)This script visualizes a price-based counting pattern that highlights potential market exhaustion and reversal areas.
When a series of candles continues in one direction, the indicator measures price momentum loss and marks possible turning points.
Features
Counts consecutive upward or downward price movement
Highlights possible exhaustion or reversal areas
Optional alerts, take-profit and stop-loss visual levels
Fully customizable colors and display settings
Useful as a confirmation tool with trend or volume indicators
This indicator is designed to assist decision-making, not to generate mechanical buy/sell signals.
Best used together with other trend or volatility tools.
📎 Short Description (for compact field)
Counts consecutive price movement to highlight potential market exhaustion and reversal zones.
Helps identify when strong trends may be weakening.

CODY BOT – Breakout SignalsCODY BOT is a minimalist, high-probability breakout indicator designed to keep your chart clean while highlighting actionable trading opportunities.
Unlike traditional indicators that generate too many signals, CODY BOT only alerts you to strong directional moves following consolidation, helping you focus on high-quality entries.
Key Features:
Detects breakouts above recent highs and below recent lows.
Filters weak moves using minimum candle body size.
Includes a cooldown period to prevent signal spam.
Clean and intuitive visual signals with large arrows for easy interpretation.
Optional customization for consolidation lookback bars, minimum candle size, and arrow visibility.
Alerts built-in for server-side and mobile notifications.
How to Use:
Look for BUY arrows when price breaks above consolidation highs.
Look for SELL arrows when price breaks below consolidation lows.
Combine with your preferred risk management and trend confirmation strategies.

UM OBV with Signal (EMA/SMA/WMA/NWE)SUMMARY
A visual OBV trend tool that highlights bullish and bearish volume pressure using smart smoothing and intuitive color-coding.
⸻
WHY THIS INDICATOR?
There are only three variables you can adjust on a chart: price, volume, and time. I wanted a good volume indicator.
⸻
DESCRIPTION
This tool extends classic On-Balance Volume with selectable trend smoothing (EMA, SMA, WMA, or NWE) and visual directional coloring on both OBV and the Signal line. Green shows bullish volume flow, red shows bearish volume flow. Optional crossover markers help confirm shifts in buying pressure.
Nadaraya-Watson Regression (NWE) provides a smooth, non-MA alternative for filtering volume trend noise, and optional dual-NWE coloring helps reduce false flips in choppy markets.
⸻
THE CHART
The indicator is added twice at the bottom; once with a 21 EMA and again with a 55 SMA. The chart has text and illustrations to show where the OBV flipped colors. More red equals more selling pressure. More green equals more buying volume or pressure.
⸻
DEFAULTS
• OBV smoothing length = 3
• Signal = 21 EMA
• Crossover bubbles are hidden/off by default
⸻
SUGGESTED USES
• Combine with price structure, momentum, or volatility tools to confirm trend strength.
• Try switching between EMA and NWE on faster intraday charts to see volume trend earlier.
• Use crossover signals as secondary confirmation rather than standalone entries.
• Use this indicator with your other favorite indicators for confirmation.
• Select timeframes suitable to your style of trading.
• I use the 30-minute, 6-hour, and Daily timeframes.
• I question myself if I am buying something with this indicator being red.
• Experiment with various timeframes and settings.
⸻
AUTHOR OBSERVATIONS
OBV often turns before price—especially when volume surges ahead of breakout levels.
NWE tends to smooth choppy OBV much better than traditional moving averages in noisy markets.
Look for Signal color flips at key support/resistance or volatility inflection points.
⸻
ALERTS
Right-click the indicator and choose Add alert… – two presets are available:
• Bullish OBV Turning Up
• Bearish OBV Turning Down

Stoch RSI Buy/Sell Signals with AlertsMy charts show HBM and CMCL graphs. The colors show you when to buy and when to sell.
The script is data-driven:
It calculates RSI and Stoch RSI based on each ticker’s own price movement.
The %K and %D lines are smoothed from that ticker’s momentum.
Signals only fire when that ticker’s %K crosses %D in the right zone.
So if CMCL is oversold and HBM is overbought, you’ll get:
✅ Green K line and green background on CMCL
❌ Red K line and red background on HBM
Even if they both show gray at the same time, it’s because neither is in a signal zone — not because the charts are duplicates.

Slow Stochastic 3-Minute Signalsdisplay B for buy signal, s for sell signal for slow stochastic 3 minute time frame

Trend Follow Line Point📌 Trend Follow Line Point
The Trend Follow Line Point indicator removes the confusing, repainting-based swing connections commonly found in traditional swing tools.
It maintains consistent swing-point calculation, keeps structural swing lines intact even when trend lines are broken, and integrates market structure + trend + volatility + volume into one intuitive, visual indicator.
This tool is designed for:
Trend Following
Swing Structure Analysis
Volatility-Based Entry & Exit
Market Strength Evaluation
📊 Component Explanation
🔹 1. Swing High / Swing Low Detection
Based on the user-defined sensitivity (swgLen):
A Swing High forms when the current high exceeds the previous swgLen highs.
A Swing Low forms when the current low falls below the previous swgLen lows.
🔹 2. Swing-Based Structure Lines
Connect Swing Highs → Structural visualization
Connect Swing Lows → Structural visualization
These lines reveal the underlying market structure without repainting or disappearing unexpectedly.
🔹 3. Dynamic ATR + Volume Weighting
ATR values combined with the volume ratio (vol / volMA) create a dynamic volatility channel that reflects real-time market pressure.
🔹 4. Enhanced SuperTrend Calculation
Uses ATR-based stability to produce more realistic and smoother trend lines, reducing noise and improving signal clarity.
🔹 5. Trend Color Mapping
Up Trend → User-selected color
Down Trend → User-selected color
Visual trend direction and strength can be identified immediately.
🧭 How to Use
When Swing Highs/Lows are detected, structure lines are automatically drawn between previous swings.
Use these lines to evaluate support/resistance breaks and overall structural direction.
Manage risk with volatility guidance:
Higher ATR (volume-weighted) → wider trend spacing → increased risk
Lower ATR → tighter spacing → reduced risk
This helps with position sizing, entry timing, and exit decisions.
+

Buy Sell Signal — Ema crossover [© gyanapravah_odisha]Professional EMA Crossover + ATR Risk Control
Trade with confidence using a complete system that gives you clear entries, smart exits, and full automation.
Includes:
Precision 5/13 EMA crossover signals
ATR-based adaptive stop-loss
Multiple take-profit levels (with intermediate targets)
Fully customizable R:R ratios
ATR + volume filters to avoid choppy markets
Real-time trade dashboard
All alerts included
Built for: Crypto, Forex, Stocks • Scalping & Swing Trading
Built for you: Free, open-source & made for real-world trading.

ADX Breakout Enhanced Signal🥋 Trading Dojo – ADX Breakout Enhanced Signal
This indicator combines the trend-strength power of the ADX with dynamic breakout-based signals, designed for traders who want more frequent and higher-probability entries on timeframes like 1 hour.
The core logic focuses on:
📌 1. Trend Strength Detection with ADX
The indicator evaluates whether the market is showing a strong directional trend using an optimized ADX.
When ADX rises above the configured threshold, the system interprets that price has enough momentum to validate an entry.
📌 2. Breakout Entry Logic
It identifies points where price breaks recent highs or lows, confirming the start or continuation of movement.
This breakout-based approach produces more entries than traditional ADX strategies alone.
📌 3. Clear and Simple Signals
🟩 Long when price breaks a recent high with strong trend confirmation.
🟥 Short when price breaks a recent low with strong trend confirmation.
📌 4. Built-In Automated Alerts
The indicator automatically generates JSON alerts ready for use with automation tools such as trading bots, webhooks, BingX, 3Commas, Discord bots, and more.
🎯 Purpose of the Indicator
To provide more frequent, well-distributed, and momentum-validated entries, while maintaining simplicity and speed — perfect for real-time decision-making.
Perfect For:
Intraday trading
1h, 30m, and 15m timeframes
Breakout-based strategies
Automated trading systems

Income Engine - Daily Supertrend Covered Call SignalsWhat This Indicator Does
1. Identifies the safest time to sell a 1-week covered call
The script uses the Daily Supertrend as a primary trend filter.
When the trend turns bearish or weak, the indicator highlights a Sell Zone, signaling a statistically safer window to sell a covered call.
Covered calls perform best when price is:
Sideways
Weak
Trending down
Not likely to surge upward
The Sell Zone captures exactly this behavior.
Green line=Let the stock run.
Red line=safe to sell calls without assignment. Gererate income while stock falters.

Delta Signals NO REPINTA (FINAL)📢 New Indicator: Delta Signals NO REPAINT 🔥
Introducing my new indicator based on Order Flow Delta, designed to provide buy and sell signals with absolutely NO repainting — perfect for scalping, day trading, or swing trading.
This tool combines two powerful components:
✅ Order Flow Delta — Measures the real strength between buyers and sellers
✅ Smart Trend Filter — Only shows signals in the direction of the dominant trend
Together, they deliver cleaner, more accurate and more reliable signals, with clear entry markers on the chart and a delta histogram revealing real market pressure.
🚀 What’s Included?
🔹 Buy/Sell signals with NO repaint
🔹 Intelligent delta calculation
🔹 Trend filter using moving average
🔹 Clear labels on entry points
🔹 Visual delta histogram
🔹 Works great on Crypto, Forex, Indices & Stocks
🔹 Very lightweight and fast on TradingView
🎯 Why is it powerful?
Because it doesn't rely on lagging indicators — it reads the actual imbalance between buyers and sellers, often detecting strong moves before traditional indicators do.
This type of analysis is used by professional order flow traders, but now you have it on your TradingView chart in a simple, visual format.
🔥 Perfect for:
Scalpers who need precision
Day traders working breakouts and pullbacks
Swing traders seeking strong confirmations
Traders who want clean, NO-repaint signals
If you want a version with automatic TP/SL, alerts, or full backtesting, I can publish that as well.
Just let me know. 🚀📈

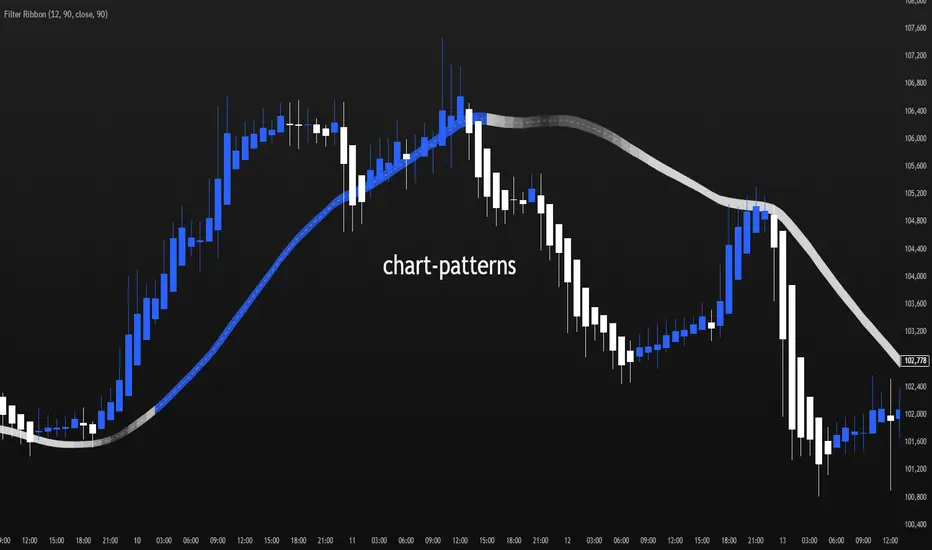
Filter Ribbon1. Indicator Name
Filter Ribbon
2. One-line Introduction
A trend visualization ribbon that uses linear regression and directional scoring to highlight bullish and bearish strength with intuitive color gradients.
3. General Overview
Filter Ribbon is a minimalistic yet powerful trend visualization tool that leverages linear regression slope ordering to determine directional momentum. It analyzes the ordering of regression values over a defined lookback period and quantifies how consistently the price has been trending upward or downward.
Using a pairwise comparison system, it calculates a trend "score" and compares this to a configurable threshold to determine if a bullish, bearish, or neutral condition exists.
The result is a color-coded ribbon that sits over the chart, changing hue and opacity based on both the direction and strength of the trend. The stronger the directional alignment, the more opaque the ribbon becomes, offering traders a fast, intuitive way to assess market sentiment at a glance.
It also includes an optional linear regression line to further help visualize the central trend.
This indicator is best used in trend-following systems or as a dynamic background layer when combined with signal-based strategies.
Thanks to its efficient design and protected logic, Filter Ribbon offers high-performance visualization without compromising strategy integrity.
4. Key Advantages
🌈 Visual Trend Heatmap
Dynamic color ribbon gives real-time visual feedback on both trend direction and strength.
🔢 Quantified Trend Scoring
Calculates a mathematically sound trend score using pairwise linear regression comparisons.
⚖️ Adjustable Sensitivity
Users can tune lookback and threshold parameters to fit different asset classes and timeframes.
📉 Smooth Ribbon Effect
Plots upper/lower bands around regression line with smooth filling for a professional chart look.
🎯 Precise Trend Confirmation
Acts as a confidence layer for other entry/exit signals by confirming broader trend bias.
🔒 Secure and Minimal Codebase
Core logic is embedded securely with minimal exposure, reducing risk of replication or misuse.
📘 Indicator User Guide
📌 Basic Concept
Filter Ribbon determines trend direction and intensity by comparing the order of linear regression values over time.
It forms a ribbon on the chart that changes color based on trend direction and opacity based on trend strength.
This makes it ideal for identifying clear trending periods vs. uncertain consolidations.
⚙️ Settings Explained
Lookback Period: Number of bars for scoring the trend direction (higher = smoother trend)
Range Tolerance (%): Determines how aggressive the trend classification is (lower = stricter)
Regression Length: Period for calculating the base linear regression line
Ribbon Colors: Customize colors for bullish and bearish conditions
📈 Bullish Timing Example
Ribbon color is green and becomes increasingly opaque
Regression line slopes upward and price remains above it
Can be used as trend confirmation for long trades
📉 Bearish Timing Example
Ribbon color is red with higher opacity
Price consistently below the regression line
Useful for confirming short trade setups or avoiding long entries
🧪 Recommended Use Cases
Combine with breakout indicators to validate if the breakout aligns with broader trend
Use in swing or trend-following strategies as a background filter
Helps filter out trades during unclear, sideways market conditions
🔒 Precautions
Not a signal generator on its own — meant for trend context only
Ribbon may lag slightly during sudden trend reversals; best used with reactive entry tools
Always test ribbon parameters on your specific market/timeframe before applying live
Avoid using solely in low-volatility or flat markets — sensitivity may require tuning
+++
MOMO Exhaustion Short Signal Strategy v6 alexh1166Prints Short Signals for Exhausted Momentum stocks primed for reversals

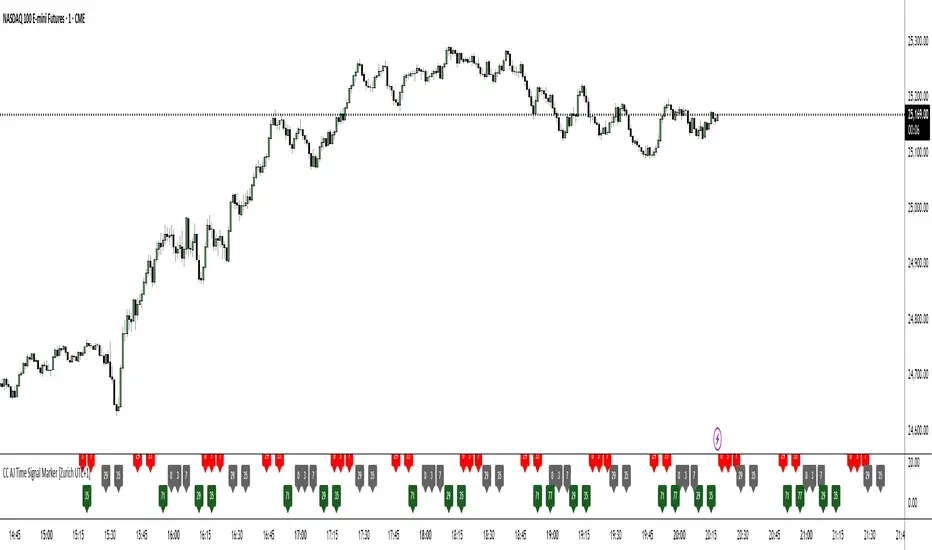
CC AJ Time Signal Marker [Zurich UTC+1]CC AJ Time Signal Marker
Overview
This non-repainting, overlay-free indicator displays time-based numerical signals derived from Zurich time (UTC+1) using three user-selectable calculation methods. It is designed for intraday traders who analyze time patterns and numerical confluence on lower timeframes (especially 1-minute charts).
Core Functionality
The script evaluates three mathematical conditions on every bar:
Method Calculation Row (Top → Bottom) Default Color
Subtraction Minute − Hour Top Row Red
Minute Minute Middle Row Gray
Addition Hour + Minute Bottom Row Green
When the result matches a user-defined AJ Time (0–77), the value is displayed in its dedicated row.
Key Features
Three dedicated label rows — no overlap, no clutter
User-defined AJ Times (0–77) with individual ON/OFF checkboxes
Fully customizable colors for current bar and future/past labels
Optimized for 1-minute charts during European session
McMillan Volatility Bands (MVB) – with Entry Logic// McMillan Volatility Bands (MVB) with signal + entry logic
// Author: ChatGPT for OneRyanAlexander
// Notes:
// - Bands are computed using percentage volatility (log returns), per the Black‑Scholes framing.
// - Inner band (default 3σ) and outer band (default 4σ) are configurable.
// - A setup occurs when price closes outside the outer band, then closes back within the inner band.
// The bar that re‑enters is the "signal bar." We then require price to trade beyond the signal bar's
// extreme by a user‑defined cushion (default 0.34 * signal bar range) to confirm entry.
// - Includes alertconditions for both setups and confirmed entries.

3HH/3LL → Next Bar Inside = Signal (Neon)Detects 3 consecutive Higher Highs or 3 consecutive Lower Lows.
Signals only when the very next candle is an Inside Bar.
Uses your Neon Lime (HH case) and Neon Pink (LL case) colors.
