Algo Trading Signals - Buy/Sell System# 📊 Algo Trading Signals - Dynamic Buy/Sell System
## 🎯 Overview
**Algo Trading Signals** is a sophisticated intraday trading indicator designed for algorithmic traders and active day traders. This system generates precise buy and sell signals based on a dynamic box breakout strategy with intelligent position management, add-on entries, and automatic target adjustment.
The indicator creates a reference price box during a specified time window (default: 9:15 AM - 9:45 AM IST) and generates high-probability signals when price breaks out of this range with confirmation.
---
## ✨ Key Features
### 📍 **Smart Signal Generation**
- **Primary Entry Signals**: Clear buy/sell signals on confirmed breakouts above/below the reference box
- **Confirmation Bars**: Reduces false signals by requiring multiple bar confirmation before entry
- **Cooldown System**: Prevents overtrading with configurable cooldown periods between trades
- **Add-On Positions**: Automatically identifies optimal pullback entries for scaling into positions
### 📦 **Dynamic Reference Box**
- Creates a high/low range during your chosen time window
- Automatically updates after each successful trade
- Visual box display with color-coded boundaries (red=resistance, green=support)
- Mid-level reference line for market structure analysis
### 🎯 **Intelligent Position Management**
- **Automatic Target Calculation**: Sets profit targets based on average move distance
- **Add-On System**: Up to 3 additional entries on optimal pullbacks
- **Position Tracking**: Monitors active trades and remaining add-on capacity
- **Auto Box Shift**: Adjusts reference box after target hits for continued trading
### 📊 **Visual Clarity**
- **Color-Coded Labels**:
- 🟢 Green for BUY signals
- 🔴 Red for SELL signals
- 🔵 Blue for ADD-ON buys
- 🟠 Orange for ADD-ON sells
- ✓ Yellow for Target hits
- **TP Level Lines**: Dotted lines showing current profit targets
- **Hover Tooltips**: Detailed information on entry prices, targets, and add-on numbers
### 📈 **Real-Time Statistics**
Live performance dashboard showing:
- Total buy and sell signals generated
- Number of add-on positions taken
- Take profit hits achieved
- Current trade status (LONG/SHORT/None)
- Cooldown timer status
### 🔔 **Comprehensive Alerts**
Built-in alert conditions for:
- Primary buy entry signals
- Primary sell entry signals
- Add-on buy positions
- Add-on sell positions
- Buy take profit hits
- Sell take profit hits
---
## 🛠️ Configuration Options
### **Time Settings**
- **Box Start Hour/Minute**: Define when to begin tracking the reference range
- **Box End Hour/Minute**: Define when to lock the reference box
- **Default**: 9:15 AM - 9:45 AM (IST) - Perfect for Indian market opening range
### **Trade Settings**
- **Target Points (TP)**: Average move distance for profit targets (default: 40 points)
- **Breakout Confirmation Bars**: Number of bars to confirm breakout (default: 2)
- **Cooldown After Trade**: Bars to wait after closing position (default: 3)
- **Add-On Distance Points**: Minimum pullback for add-on entry (default: 40 points)
- **Max Add-On Positions**: Maximum additional positions allowed (default: 3)
### **Display Options**
- Toggle buy/sell signal labels
- Show/hide trading box visualization
- Show/hide TP level lines
- Show/hide statistics table
---
## 💡 How It Works
### **Phase 1: Box Formation (9:15 AM - 9:45 AM)**
The indicator tracks the high and low prices during your specified time window to create a reference box representing the opening range.
### **Phase 2: Breakout Detection**
After the box is locked, the system monitors for:
- **Bullish Breakout**: Price closes above box high for confirmation bars
- **Bearish Breakout**: Price closes below box low for confirmation bars
### **Phase 3: Signal Generation**
When confirmation requirements are met:
- Entry signal is generated with clear visual label
- Target price is calculated (Entry ± Target Points)
- Position tracking activates
- Cooldown timer starts
### **Phase 4: Position Management**
During active trade:
- **Add-On Logic**: If price pulls back by specified distance but stays within favorable range, additional entry signal fires
- **Target Monitoring**: Continuously checks if price reaches TP level
- **Box Adjustment**: After TP hit, box automatically shifts to new range for next opportunity
### **Phase 5: Trade Exit & Reset**
On target hit:
- Position closes with TP marker
- Statistics update
- Box repositions for next setup
- Cooldown activates
- System ready for next signal
---
## 📌 Best Use Cases
### **Ideal For:**
- ✅ Intraday breakout trading strategies
- ✅ Algorithmic trading systems (via alerts/webhooks)
- ✅ Opening range breakout (ORB) strategies
- ✅ Index futures (Nifty, Bank Nifty, Sensex)
- ✅ High-liquidity stocks with clear ranges
- ✅ Automated trading bots
- ✅ Scalping and day trading
### **Markets:**
- Indian Stock Market (NSE/BSE)
- Futures & Options
- Forex pairs
- Cryptocurrency (adjust timing for 24/7 markets)
- Global indices
---
## ⚙️ Integration with Algo Trading
This indicator is **algo-ready** and can be integrated with automated trading systems:
1. **TradingView Alerts**: Set up alert conditions for each signal type
2. **Webhook Integration**: Connect alerts to trading platforms via webhooks
3. **API Automation**: Use with brokers supporting TradingView integration (Zerodha, Upstox, Interactive Brokers, etc.)
4. **Signal Data Access**: All signals are plotted for external data retrieval
---
## 📖 Quick Start Guide
1. **Add Indicator**: Apply to your chart (works best on 1-5 minute timeframes)
2. **Configure Time Window**: Set your desired box formation period
3. **Adjust Parameters**: Tune confirmation bars, targets, and add-on settings to your trading style
4. **Set Alerts**: Create alert conditions for automated notifications
5. **Backtest**: Review historical signals to validate strategy performance
6. **Go Live**: Enable alerts and start receiving real-time trading signals
---
## ⚠️ Risk Disclaimer
This indicator is a **tool for analysis** and does not guarantee profits. Trading involves substantial risk of loss. Always:
- Use proper position sizing
- Implement stop losses (not included in this indicator)
- Test thoroughly before live trading
- Understand market conditions
- Never risk more than you can afford to lose
- Consider your risk tolerance and trading experience
**Past performance does not indicate future results.**
## 🔄 Version History
**v1.0** - Initial Release
- Dynamic box formation system
- Confirmed breakout signals
- Add-on position management
- Visual signal labels and statistics
- Comprehensive alert system
- Auto-adjusting target boxes
---
## 📞 Support & Feedback
If you find this indicator helpful:
- ⭐ Please leave a like/favorite
- 💬 Share your feedback in comments
- 📊 Share your results and improvements
- 🤝 Suggest features for future updates
---
## 🏷️ Tags
`breakout` `daytrading` `signals` `algo` `automated` `intraday` `ORB` `opening-range` `buy-sell` `scalping` `futures` `nifty` `banknifty` `algorithmic` `box-strategy`
*Remember: The best indicator is combined with proper risk management and trading discipline.* Use it at your own rist, not as financial advie
"signal" için komut dosyalarını ara

CVD Pro – Smart Overlay + Signals (with Persist Mode)What this Indicator Does
CVD Pro visualizes Cumulative Volume Delta (CVD) data directly on your main price chart — helping you detect real buying vs. selling pressure in real time.
Unlike most CVD scripts that run in a separate subwindow, this one overlays price-mapped CVD curves on the candles themselves for better confluence with market structure and FVG zones.
The script dynamically scales normalized CVD values to the price range and uses adaptive smoothing and deviation bands to highlight shifts in trader behavior.
It also includes automatic bullish/bearish crossover signals, displayed as on-chart labels.
⚙️ Main Features
✅ Price-mapped CVD Overlay
CVD is normalized (Z-score) and projected onto the price chart for easy visual correlation with price structure.
✅ Multi-Timeframe Presets
Three sensitivity presets optimized for different chart environments:
Strict (4H) → Best for macro trends and high-timeframe structure.
Balanced (1H / 30m) → Great for active swing setups.
Sensitive (15m) → Captures short-term intraday reversals.
✅ Dynamic Bands & Smoothing
Deviation bands visualize statistical extremes in delta pressure — helping to identify exhaustion and divergence points.
✅ Smart Buy/Sell Signal Logic
Automatic label triggers when the CVD Overlay crosses its smoothed baseline:
🟢 BULL LONG → Rising CVD above the mean (buyers in control).
🔴 BEAR SHORT → Falling CVD below the mean (sellers in control).
✅ Persist Mode
Toggle to keep the last signal visible until a new one forms — ideal for traders who prefer clean chart annotations without noise.
✅ Clean, Minimal Overlay
Everything happens directly on your chart — no extra windows, no clutter. Designed for use with Smart Money Concepts, Fair Value Gaps (FVGs), or volume imbalance setups.
🧩 Use Case
CVD Pro is designed for traders who:
Use Smart Money Concepts (SMC) or ICT-style trading
Watch for FVG reactions, breaker blocks, and liquidity sweeps
Need to confirm order flow direction or momentum strength
Trade intraday or swing setups with precision entries and clear bias confirmation
⚡ Recommended Settings
4H / 1H: Use Strict mode for major structure and confirmation.
1H / 30m: Balanced mode for clear mid-term trend alignment.
15m: Sensitive mode to catch scalps and lower-TF shifts.
🧠 Pro Tips
Combine with RSI or Market Structure Breaks (MSS) for additional confluence.
A strong CVD divergence near a key FVG or 0.5–0.705 Fibonacci zone often signals reversal.
Persistent CVD crossover + price structure break = high-probability entry.
🧩 Credits
Created by Patrick S. ("Nova Labs")
Concept inspired by professional order-flow analytics and adaptive Z-Score normalization.
Would you like me to write a shorter “public summary” paragraph (for the short description at the top of TradingView, the one-liner users see before expanding)?
It’s usually a 2–3 sentence hook like:
“Overlay-based CVD indicator that merges volume delta with price structure. Detect true buying/selling pressure using adaptive normalization, deviation bands, and clean bullish/bearish crossover signals.”

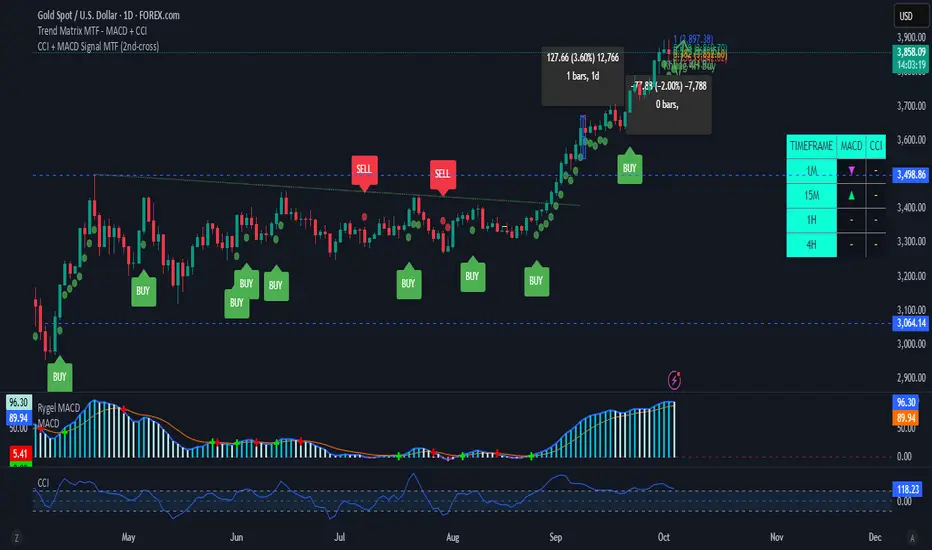
CCI + MACD Signal MTF (2nd-cross)This custom indicator combines the Commodity Channel Index (CCI) and the MACD to generate trading signals.
Basic signals (dots):
A green dot is plotted when CCI is above +100 and MACD is positive.
A red dot is plotted when CCI is below –100 and MACD is negative.
These dots help visualize momentum alignment between the two indicators.
Second-cross signals (text + alert):
The indicator also tracks cycles of the CCI.
When CCI first moves above +100 and later falls back below +100, this is counted as one completed cycle.
The next time CCI crosses back above +100 (the second cross), if MACD is still positive, a “BUY” label is plotted and a buy alert is triggered.
Conversely, when CCI first moves below –100 and later rises back above –100, that is one completed cycle.
The next time CCI crosses back below –100 (the second cross), if MACD is negative, a “SELL” label is plotted and a sell alert is triggered.
Alerts:
Alerts are only fired on the second-cross events (BUY or SELL), making them rarer but potentially more reliable than the basic dot conditions.
Timeframe flexibility:
Both the CCI and the MACD can be calculated on custom timeframes independently of the chart’s timeframe.
Dominance Signal Apex [CHE]]Dominance Signal Apex — Triple-confirmed entry markers with stateful guardrails
Summary
This indicator focuses on entry timing by plotting markers only when three conditions align: a closed-bar Heikin-Ashi bias, a monotonic stack of super-smoother filters, and the current HMA slope. A compact state machine provides guardrails: it starts a directional state on closed-bar Heikin-Ashi bias, maintains it only while the smoother stack remains ordered, and renders a marker only if HMA slope agrees. This design aims for selective signals and reduces isolated prints during mixed conditions. Markers fade over time to visualize the age and persistence of the current state.
Motivation: Why this design?
Common triggers flip frequently in noise or react late when regimes shift. The core idea is to gate entry markers through a closed-bar state plus independent filter alignment. The state machine limits premature prints, removes markers when alignment breaks, and uses the HMA as a final directional gate. The result is fewer mixed-context entries and clearer clusters during sustained trends.
What’s different vs. standard approaches?
Reference baseline: Single moving-average slope or classic MA cross signals.
Architecture differences:
Multi-length two-pole super-smoother stack with strict ordering checks.
Closed-bar Heikin-Ashi bias to start a directional state.
HMA slope as a final gate for rendering markers.
Time-based alpha fade to surface state age.
Practical effect: Entry markers appear in clusters during aligned regimes and are suppressed when conditions diverge, improving selectivity.
How it works (technical)
Measurements: Four recursive super-smoother series on price at short to medium horizons. Up regime means each shorter smoother sits below the next longer one; down regime is the inverse.
State machine: On bar close, positive Heikin-Ashi bias starts a bull state and negative bias starts a bear state. The state terminates the moment the smoother ordering breaks relative to the prior bar.
Rendering gate: A marker prints only if the active state agrees with the current HMA slope. The HMA is plotted and colored by slope for context.
Normalization and clamping: Marker transparency transitions from a starting to an ending alpha across a fixed number of bars, clamped within the allowed range.
Initialization: Persistent variables track state and bar-count since state start; Heikin-Ashi open is seeded on the first valid bar.
HTF/security: None used. State updates are closed-bar, which reduces repaint paths.
Bands: Smoothed high, low, centerline, and offset bands are computed but not rendered.
Parameter Guide
Show Markers — Toggle rendering — Default: true — Hides markers without changing logic.
Bull Color / Bear Color — Visual colors — Defaults: bright green / red — Aesthetic only.
Start Alpha / End Alpha — Transparency range — Defaults: one hundred / fifty, within zero to one hundred — Controls initial visibility and fade endpoint.
Steps — Fade length in bars — Default: eight, minimum one — Longer values extend the visual memory of a state.
Smoother Length — Internal band smoothing — Default: twenty-one, minimum two — Affects computed bands only; not drawn.
Band Multiplier — Internal band offset — Default: one point zero — No impact on markers.
Source — Input for HMA — Default: close — Align with your workflow.
Length — HMA length — Default: fifty, minimum one — Larger values reduce flips; smaller values react faster.
Reading & Interpretation
Entry markers:
Bull marker (below bar): Closed-bar Heikin-Ashi bias is positive, smoother stack remains aligned for up regime, and HMA slope is rising.
Bear marker (above bar): Closed-bar Heikin-Ashi bias is negative, smoother stack remains aligned for down regime, and HMA slope is falling.
Fade: Transparency progresses over the configured steps, indicating how long the current state has persisted.
Practical Workflows & Combinations
Trend following: Focus on marker clusters aligned with HMA color. Add structure filters such as higher highs and higher lows or lower highs and lower lows to avoid counter-trend entries.
Exits/Stops: Consider exiting or reducing risk when smoother ordering breaks, when HMA color flips, or when marker cadence thins out.
Multi-asset/Multi-TF: Suitable for liquid crypto, FX, indices, and equities. On lower timeframes, shorten HMA length and fade steps for faster response.
Behavior, Constraints & Performance
Repaint/confirmation: State transitions and marker eligibility are decided on closed bars; live bars do not commit state changes until close.
security()/HTF: Not used.
Resources: Declared max bars back of one thousand five hundred; recursive filters and persistent states; no explicit loops.
Known limits: Some delay around sharp turns; brief states may start in noisy phases but are quickly revoked when alignment fails; HMA gating can miss very early reversals.
Sensible Defaults & Quick Tuning
Start here: Keep defaults.
Too many flips: Increase HMA length and raise fade steps.
Too sluggish: Decrease HMA length and reduce fade steps.
Markers too faint/bold: Adjust start and end alpha toward lower or higher opacity.
What this indicator is—and isn’t
A selective entry-marker layer that prints only under triple confirmation with stateful guardrails. It is not a full system, not predictive, and does not handle risk. Combine with market structure, risk controls, and position management.
Disclaimer
The content provided, including all code and materials, is strictly for educational and informational purposes only. It is not intended as, and should not be interpreted as, financial advice, a recommendation to buy or sell any financial instrument, or an offer of any financial product or service. All strategies, tools, and examples discussed are provided for illustrative purposes to demonstrate coding techniques and the functionality of Pine Script within a trading context.
Any results from strategies or tools provided are hypothetical, and past performance is not indicative of future results. Trading and investing involve high risk, including the potential loss of principal, and may not be suitable for all individuals. Before making any trading decisions, please consult with a qualified financial professional to understand the risks involved.
By using this script, you acknowledge and agree that any trading decisions are made solely at your discretion and risk.
Best regards and happy trading
Chervolino

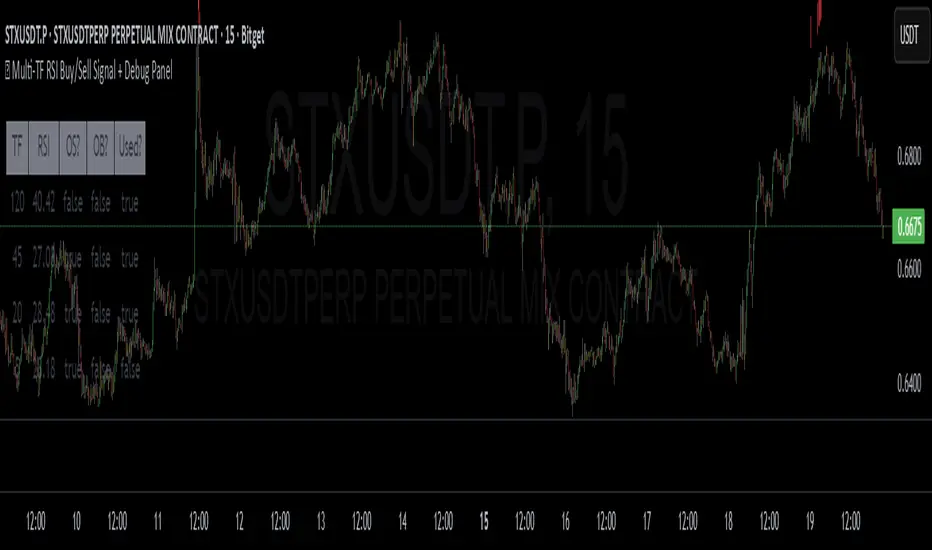
✅ Multi-TF RSI Buy/Sell Signal + Debug Panel
Multi-TF RSI Buy/Sell Signal + Debug Panel
This script provides RSI-based Buy and Sell signals confirmed across multiple timeframes, designed to help identify high-confluence market entries. Includes an optional debug panel for real-time monitoring and diagnostics.
How It Works
RSI Thresholds:
Oversold (OS): RSI < Oversold value → potential Buy
Overbought (OB): RSI > Overbought value → potential Sell
Timeframe Inputs:
You can monitor RSI across up to 4 different timeframes (customizable).
You can enable/disable each individually.
Signal Confirmation:
You define how many of the selected timeframes need to agree (via Min Confirmations).
If Auto Confirm is enabled, it automatically matches the number of confirmations to how many timeframes are enabled.
Signal Logic:
If enough RSI values are oversold, a Buy arrow is shown below the bar.
If enough RSI values are overbought, a Sell arrow appears above the bar.
Alerts are also triggered accordingly.
How to Use
Choose the 4 timeframes you want to monitor.
Toggle which ones to enable (checkboxes).
Select RSI thresholds for oversold/overbought conditions.
Enable Auto Confirmations or manually set how many confirmations are required to trigger a signal.
Use the Style tab to customize the signal visuals.
Turn on alerts with Buy Alert or Sell Alert
Debug Panel
Toggle it on/off via Show Debug Panel.
Move its position to any chart corner.
Updates every 5 bars.
Displays:
Each TF label
RSI value
If it's currently oversold/overbought
If that TF is currently enabled
Tips:
Try to match chart timeframe with one of your selected TFs for better signal visibility.
Use in confluence with other indicators for best results.
RSI alone is not a guaranteed signal – treat it as a filter or alert, not a full strategy.
Notes
This is not financial advice. Always combine with your own analysis.
RSI-based systems work best in ranging or balanced conditions.
Confirmation logic helps reduce noise, but no indicator is infallible.
Trend ChannelThis Trend Channel is designed to simplify how traders view trends, while also keeping track of potential shifts in trends with signals. It is designed for traders that prefer less over more.
The indicator can be used for trend following, trend reversals and confirmation in combination with price or other indicators.
At the core is one EMA and a smoothed volatility based channel around it.
The purpose of the channel is to avoid false signals on trend reclaim or trend loss and instead identify trend deviations.
The indicator also incorporates long and short EMA cross-over signals to recognize possible shifts in trend without having to overlay multiple EMAs and keep the chart cleaner.
Additionally the indicator fires warnings for potential false signals on golden/death crosses with a letter "W" above/below the signal candle. Those warnings are based on the distance between price and the crossover. When the distance is above a certain threshold the indicator fires a warning that price might mean revert.
Traders can customize all inputs in the settings.

Deviation Rate Crash SignalDescription
This indicator provides entry signals for contrarian trades that aim to capture rebounds after sharp declines, such as during market crashes.
A signal is triggered when the deviation rate from the 25-day moving average falls below -25% (default setting). On the chart, a red circle is displayed below the candlestick to indicate the signal.
Backtest (2000–2024, Nikkei 225 stocks):
Win rate: 64.73%
Payoff ratio: 1.141
Probability of ruin: 0.0% (with proper risk control)
Trading Rules (Long only):
Entry: Market buy at next day’s open when the closing price is 25% or more below the 25-day MA.
Exit: Market sell at next day’s open when:
The closing price is 10% above the entry price (take profit), or
The closing price is 10% below the entry price (stop loss), or
40 days have passed since entry.
Notes:
This indicator is tuned for crisis periods (e.g., 2008 Lehman Shock, 2011 Great East Japan Earthquake, 2020 COVID-19 crash, 2024 Yen carry trade reversal).
In normal market conditions, signals will be rare.
Pine Screener BETA Support:
Add this indicator to your favorites and scan with long condition = true.
Screener results display both the MA deviation rate and current price.
When multiple signals occur, use the deviation rate as a reference to prioritize setups.
説明
このインジケーターは、暴落時など短期間で急落した銘柄のリバウンドを狙う逆張りトレードのエントリーシグナルを提供します。
25日移動平均線からの乖離率が -25% を下回ったときにシグナルが点灯します(初期設定)。シグナルはメインチャートのローソク足の下に赤い丸印で表示されます。
バックテスト結果(2000~2024年、日経225銘柄):
勝率: 64.73%
ペイオフレシオ: 1.141
破産確率: 0.0%(適切なリスク管理を行った場合)
トレードルール(買いのみ):
エントリー: 終値が25日移動平均線から25%以上下方乖離した場合、翌日の寄り付きで成行買い。
手仕舞い: 翌日の寄り付きで成行売り(以下のいずれかの条件を満たした場合)
終値が買値より10%以上上昇(利確)
終値が買値より10%以上下落(損切り)
エントリーから40日経過
注意点:
このインジケーターは、2008年リーマンショック、2011年東日本大震災、2020年コロナショック、2024年円キャリートレード巻き戻しショックなど、危機的局面で効果を発揮するように調整されています。
通常の相場ではシグナルはほとんど出現しません。
Pine Screener BETA 対応:
このインジケーターをお気に入り登録し、long condition = true をフィルター条件にしてスキャンしてください。
スクリーナー結果には移動平均乖離率と現在値が表示されます。
シグナルが同時に多数出現した場合は、移動平均乖離率を参考に優先順位をつけてください。

Moving Average Signals : Support ResistanceThis indicator plots a Simple Moving Average (default 50-period, adjustable) and highlights potential bounce or rejection signals when price interacts with the SMA.
It is designed to identify moments when price tests the moving average from one side and then continues in the prior direction, signaling a possible continuation trade.
🔴 Red Triangle (Bearish Rejection)
A red triangle is plotted above the bar when:
Price has been trading below the SMA.
Price tests the SMA from below (the high touches or pierces the SMA but closes back below it).
Price then continues lower on the next bar.
This suggests the SMA acted as resistance and the downtrend may resume.
🟢 Green Triangle (Bullish Rejection)
A green triangle is plotted below the bar when:
Price has been trading above the SMA.
Price tests the SMA from above (the low touches or pierces the SMA but closes back above it).
Price then continues higher on the next bar.
This suggests the SMA acted as support and the uptrend may resume.
⚡ HOW TO USE IN TRADING
Trend Confirmation
Use this indicator in trending markets (not choppy ranges).
A rising SMA suggests bullish trend bias; a falling SMA suggests bearish trend bias.
Signal Entry
Green Triangle: Consider long entries when the SMA supports price and a bullish continuation is signaled.
Red Triangle: Consider short entries when the SMA rejects price and a bearish continuation is signaled.
Stop-Loss Placement
Place stops just beyond the SMA or the rejection candle’s high/low.
Example: For a red signal, stop above the SMA or rejection candle’s high.
Take-Profit Ideas
Target prior swing highs/lows or use risk/reward multiples (e.g., 2R, 3R).
You can also trail stops behind the SMA in a strong trend.
Filters for Higher Accuracy (optional)
Confirm signals with volume, momentum indicators (e.g., RSI, MACD), or higher-timeframe trend.
Avoid trading signals against strong higher-timeframe bias.

SAP121212 — Close vs VWAP + Optional RSI (Signals)This indicator combines Supertrend, VWAP with bands, and an optional RSI filter to generate Buy/Sell signals.
How it works
Supertrend Flip (ATR-based): Detects when trend direction changes (from bearish to bullish, or bullish to bearish).
VWAP Band Filter: Signals only trigger if the candle close is beyond the VWAP bands:
Buy = Supertrend flips up AND close > VWAP Upper Band
Sell = Supertrend flips down AND close < VWAP Lower Band
Optional RSI Filter:
Buy requires RSI < 20
Sell requires RSI > 80
Can be enabled/disabled in settings.
Features
Choice of VWAP band calculation mode: Standard Deviation or ATR.
Adjustable ATR/StDev length and multiplier for VWAP bands.
Toggle Supertrend, VWAP lines, and Buy/Sell labels.
Alerts included: add alerts on BUY or SELL conditions (use Once Per Bar Close to avoid intrabar signals).
Use
Works best on intraday or higher timeframes where VWAP is relevant.
Use the RSI filter for more selective signals.
Can be combined with your own stop-loss and risk management rules.
⚠️ Disclaimer: This script is for educational and research purposes only. It is not financial advice. Always test thoroughly and trade at your own risk.
ORB Breakout Traffic Signal (5/15/30)ORB Breakout Traffic Signal (5/15/30)
This indicator visualizes Opening Range Breakouts (ORB) for the first 5, 15, and 30 minutes of the US regular trading session (09:30–16:00 ET).
It provides a compact, easy-to-read traffic signal table on your chart to show whether price is breaking out, breaking down, or consolidating inside the range.
🔑 Features
Auto-anchors at 09:30 ET (converted to your local time automatically).
Tracks ORB High/Low for:
5-minute window (09:30–09:34)
15-minute window (09:30–09:44)
30-minute window (09:30–09:59)
Displays results in a compact table:
↑ (green) → price has broken above the ORB high
↓ (red) → price has broken below the ORB low
• (gray) → price remains inside the ORB range (optional; can be disabled)
Customizable:
Toggle which ORBs to show (5m, 15m, 30m)
Choose table position (top/bottom left/right)
Adjustable text size
Option to plot the ORB High/Low lines on your chart
📌 Usage
Designed for intraday traders watching US equities/ETFs/futures.
Works best on 1-minute or 5-minute charts with Extended Hours turned OFF (so the session starts exactly at 09:30 ET).
Helps you quickly spot early breakouts (5m), mid-session trends (15m), or confirmed directional moves (30m).
⚠️ Notes
Signals only update during the RTH session
Outside market hours, the last locked ORB and signal remain displayed until the next open.
This tool is for analysis/visualization only; not a buy/sell signal. Always combine with your own trading strategy and risk management.
👉 Perfect for traders who want a quick visual confirmation of whether price is breaking out of the opening range or stuck inside it.

ICT FVG Buy/Sell SignalsThis bot is built on ICT (Inner Circle Trader) concepts such as:
Fair Value Gaps (FVGs) – imbalance zones between candles.
Consequent Encroachment (CE) – the midpoint of a gap.
Premium / Discount Arrays – dealing ranges split into premium (sell-side) and discount (buy-side) zones.
Displacement candles – strong impulsive moves that confirm intent.
The bot scans for FVGs, marks CE levels, and waits for price to return to these levels.
When price revisits a valid FVG zone with displacement confirmation and in the correct PD array, the bot generates a BUY or SELL signal.
✅ Signal Rules
Buy Signal
Price trades back into a Bullish FVG.
Current bar shows bullish displacement (large bullish body relative to ATR).
Price is in discount territory of the current dealing range (if PD filter is enabled).
Close is above the CE line of the FVG.
Sell Signal
Price trades back into a Bearish FVG.
Current bar shows bearish displacement.
Price is in premium territory of the current dealing range.
Close is below the CE line of the FVG.
🎯 What You’ll See on the Chart
Green “BUY” labels below candles when long signals trigger.
Red “SELL” labels above candles when short signals trigger.
Shaded background:
Red = Premium zone (sell side).
Teal = Discount zone (buy side).
Yellow line = dealing range midpoint (equilibrium).
Dots on CE lines = midpoints of the latest bullish/bearish FVG.
🔔 Alerts
ICT Buy → Triggers when a bullish setup confirms.
ICT Sell → Triggers when a bearish setup confirms.
You can connect these alerts to:
TradingView notifications.
Webhooks (for brokers or bots like MetaTrader, NinjaTrader, or Discord).
⚙️ Settings
Swing length – how many bars to use when detecting swing highs/lows for the dealing range.
Use PD filter – toggle ON/OFF for requiring discount/premium alignment.
Displacement ATR multiple – how strong the candle body must be compared to ATR to count as a displacement.
ATR length – used for displacement filter.
📈 Supported Markets
Works on all symbols and timeframes.
Commonly applied to:
NASDAQ (NQ, QQQ)
S&P500 (ES, SPX, SPY)
Forex pairs
Crypto (BTC, ETH, etc.)
⚠️ Disclaimer
This bot is for educational purposes only. It does not guarantee profits and should be tested on demo accounts first.
Always apply proper risk management before trading live.

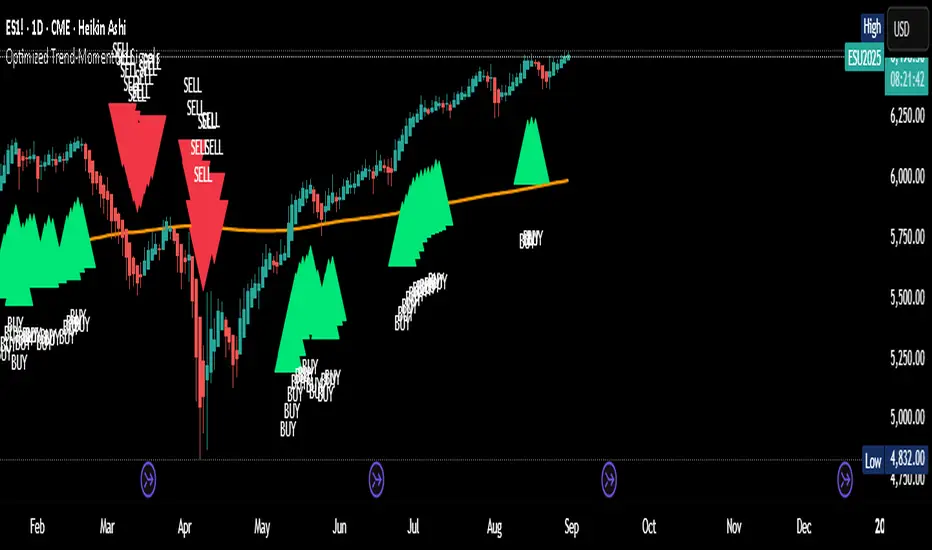
Optimized Trend-Momentum SignalsThis indicator combines trend, momentum, and volume-strength factors into a single buy/sell signal system. It integrates:
SMA 200 → Identifies the long-term trend (price above = bullish bias, below = bearish bias).
MACD (12,26,9) → Confirms momentum direction with line crossovers.
RSI (7) → Filters strength (above 50 = bullish, below 50 = bearish).
ROC (45) → Validates positive or negative rate of change.
Signal Logic:
Buy Signal → Price above SMA 200, MACD bullish, RSI > 50, and ROC > 0.
Sell Signal → Price below SMA 200, MACD bearish, RSI < 50, and ROC < 0.
Features:
Clear arrows for BUY and SELL signals.
Long-term SMA plotted for trend visualization.
Alerts built-in for real-time notifications.
This tool helps traders filter out noise and act only when all major confirmation factors align, reducing false signals and improving decision-making.
Breakout Signals This indicator is a Pine Script tool for identifying potential trading opportunities using breakout signals. It provides two distinct types of breakout alerts and calculates a potential price target for one of them.
### Breakout Signal Types
* **Lowest Low Breakout:** This signal is triggered when the current bar closes above the high of the previous bar, and that previous bar had the lowest low within a user-defined lookback period. This indicates a potential bullish reversal after a short-term downtrend.
* **Highest High Breakout:** This signal occurs when the current bar's close price exceeds the highest high recorded within a specified lookback period. This pattern suggests strong bullish momentum and a potential continuation of an uptrend.
### Visuals and Alerts
The indicator helps visualize these signals on the chart by highlighting the background of entry candles. It uses a light green background for the Lowest Low Breakout and a light yellow for the Highest High Breakout. A table is displayed on the chart to show the details of the most recent Lowest Low Breakout and its calculated target. Additionally, it provides an alert feature to notify users in real time when either of the breakout conditions is met.

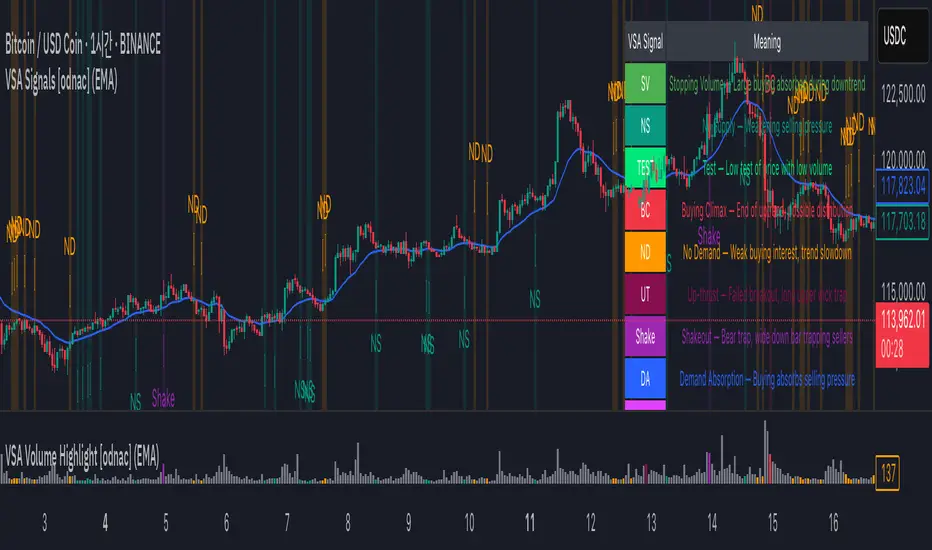
VSA Signals [odnac]This indicator applies Volume Spread Analysis (VSA) concepts to highlight important supply and demand events directly on the chart. It automatically detects common VSA patterns using price spread, relative volume, and candle structure, with optional trend filtering for higher accuracy.
Features:
Stopping Volume (SV): Signals potential end of a downtrend when heavy buying appears.
Buying Climax (BC): Indicates exhaustion of an uptrend with heavy volume near the top.
No Supply (NS): Weak selling pressure, often a bullish sign in an uptrend.
No Demand (ND): Weak buying interest, often a bearish sign in a downtrend.
Test: Low-volume test bar probing for supply.
Up-thrust (UT): Failed breakout with long upper wick, often a bearish trap.
Shakeout: Bear trap with high-volume wide down bar closing low.
Demand Absorption (DA): Demand absorbing heavy selling pressure.
Supply Absorption (SA): Supply absorbing heavy buying pressure.
Additional Options:
Background highlights for detected signals.
Configurable moving average (SMA, EMA, WMA, VWMA) as a trend filter.
Adjustable multipliers for volume and spread sensitivity.
Legend table for quick reference of signals and meanings.
Alerts available for all signals.
This tool is designed to help traders spot professional accumulation and distribution activity and to improve trade timing by recognizing supply/demand imbalances in the market.
Locked 5m 13 EMA & 15m 20 EMA with Mid EMA & SignalsThis indicator overlays the 5-minute 13 EMA and the 15-minute 20 EMA on any chart timeframe up to 15 minutes, along with a mid EMA (5-minute 36-period) for reference.
Features include:
EMA Cross Detection: Shows bullish and bearish cross arrows when the 5m 13 EMA crosses the 15m 20 EMA.
EMA Fill: Highlights the area between the EMAs in green (bullish) or red (bearish).
Mid EMA Buy/Sell Signals: Generates buy signals when price touches the mid EMA in a bullish stack and sell signals in a bearish stack.
Custom Alerts: Alerts for EMA crosses, EMA stack direction, and mid EMA buy/sell triggers.
Timeframe Safety Warning: Alerts if applied on timeframes higher than 15 minutes.
Ideal For:
Traders who want a locked, non-repainting EMA setup for multi-timeframe analysis and clear entry/exit signals based on mid-range EMA interaction.
Inputs:
Show/Hide arrows for EMA crosses
Show/Hide fill between EMAs
Show/Hide mid EMA line
Show/Hide buy/sell signals
Fill transparency adjustment
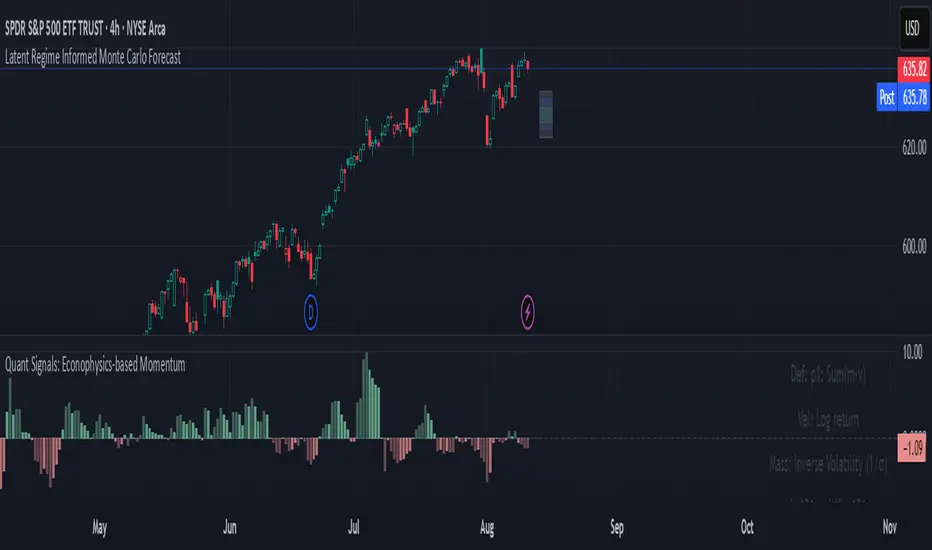
Quant Signals: Econophysics-based MomentumPhysical Momentum Switcher (p0 / p1 / p2 / p3)
This indicator implements a “physical momentum” concept from quantitative finance research, where momentum is defined similarly to physics:
Momentum (p) = Mass × Velocity
Instead of using only the standard cumulative return (classic momentum), it lets you switch between multiple definitions:
p0: Cumulative return over the lookback period (no mass, just price change).
p1: Sum of (mass × velocity) over the lookback period.
p2: Weighted average velocity = (Σ mass×velocity) ÷ (Σ mass).
p3: Sharpe-like momentum = average velocity ÷ volatility (massless).
Velocity can be measured as:
Log return: ln(Pt / Pt-1)
Normal return: (Pt / Pt-1 – 1)
Mass (for p1/p2) can be defined as:
Unit mass (1) — equal weighting, equivalent to traditional momentum.
Turnover proxy — Volume ÷ average volume over k bars.
Value turnover proxy — Dollar volume ÷ average dollar volume.
Inverse volatility — 1 ÷ return volatility over a specified period.
Features:
Switchable momentum definition, velocity type, and mass type.
Adjustable lookback (k) and smoothing period for the signal line.
Optional ±1σ display bands for quick overbought/oversold visual cues.
Alerts for crosses above/below zero or the signal line.
Table display summarizing current settings and values.
Typical uses:
Momentum trading: Buy when PM > 0 (or crosses above the signal), sell/short when PM < 0 (or crosses below).
Contrarian strategies: Reverse the logic when testing mean-reversion effects.
Cross-asset testing: Apply to different instruments to see which PM definition works best.
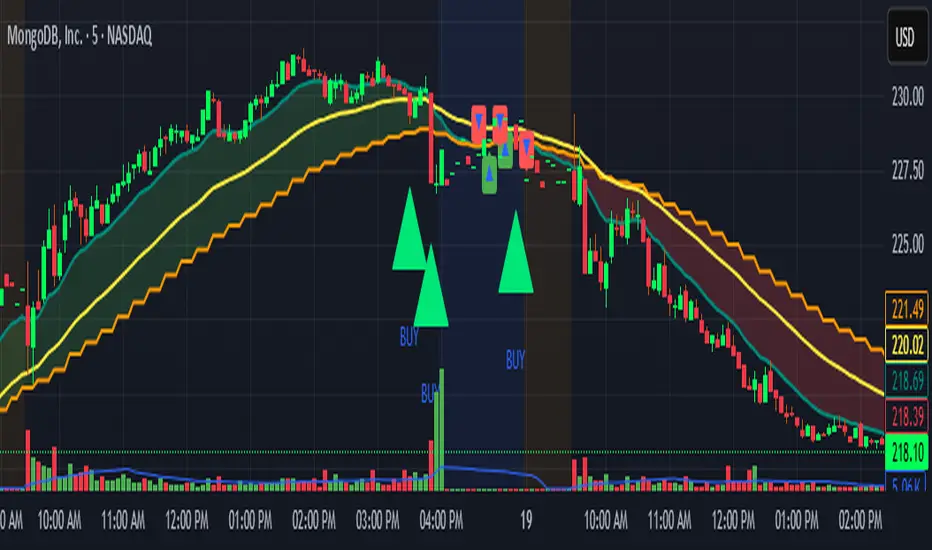
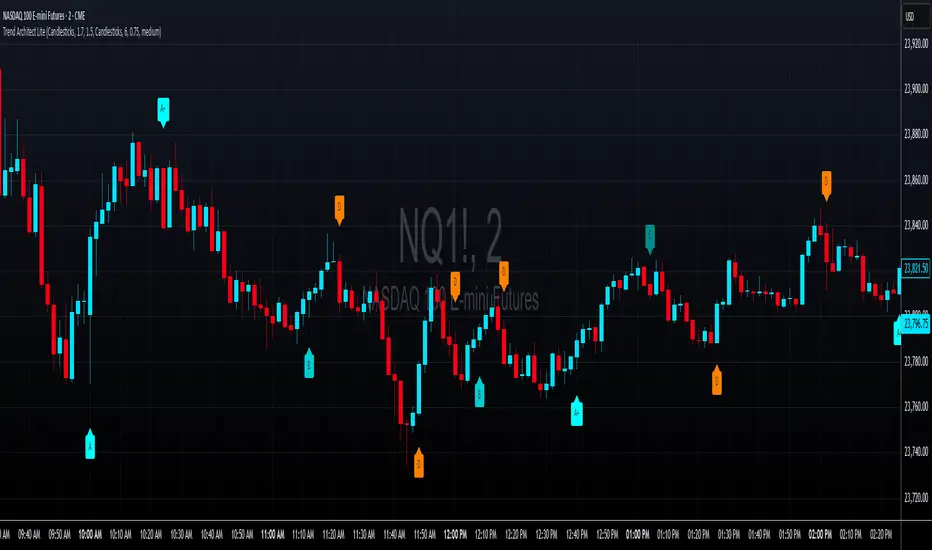
Neural Network Buy and Sell SignalsTrend Architect Suite Lite - Neural Network Buy and Sell Signals
Advanced AI-Powered Signal Scoring
This indicator provides neural network market analysis on buy and sell signals designed for scalpers and day traders who use 30s to 5m charts. Signals are generated based on an ATR system and then filtered and scored using an advanced AI-driven system.
Features
Neural Network Signal Engine
5-Layer Deep Learning analysis combining market structure, momentum, and market state detection
AI-based Letter Grade Scoring (A+ through F) for instant signal quality assessment
Normalized Input Processing with Z-score standardization and outlier clipping
Real-time Signal Evaluation using 5 market dimensions
Advanced Candle Types
Standard Candlesticks - Raw price action
Heikin Ashi - Trend smoothing and noise reduction
Linear Regression - Mathematical trend visualization
Independent Signal vs Display - Calculate signals on one type, display another
Key Settings
Signal Configuration
- Signal Trigger Sensitivity (Default: 1.7) - Controls signal frequency vs quality
- Stop Loss ATR Multiplier (Default: 1.5) - Risk management sizing
- Signal Candle Type (Default: Candlesticks) - Data source for signal calculations
- Display Candle Type (Default: Linear Regression) - Visual candle display
Display Options
- Signal Distance (Default: 1.35 ATR) - Label positioning from price
- Label Size (Default: Medium) - Optimal readability
Trading Applications
Scalping
- Fast pace signal detection with quality filtering
- ATR-based stop management prevents signal overlap
- Neural network attempts to reduces false signals in choppy markets
Day Trading
- Multi-timeframe compatible with adaptation settings
- Clear trend visualization with Linear Regression candles
- Support/resistance integration for better entries/exits
Signal Filtering
- Use A+/A grades for highest probability setups
- B grades for confirmation in trending markets
- C-F grades help identify market uncertainty
Why Choose Trend Architect Lite?
No Lag - Real-time neural network processing
No Repainting - Signals appear and stay fixed
Clean Charts - Focus on price action, not indicators
Smart Filtering - AI reduces noise and false signals
Flexible and customizable - Works across all timeframes and instruments
Compatibility
- All Timeframes - 1m to Monthly charts
- All Instruments - Forex, Crypto, Stocks, Futures, Indices
Risk Disclaimer
This indicator is a tool for technical analysis and should not be used as the sole basis for trading decisions. Past performance does not guarantee future results. Always use proper risk management and never risk more than you can afford to lose.
Breakout Range Signal with Quality Analysis [Dova Lazarus]📌 Breakout Range Signal with Quality Analysis
🎓 Training-focused indicator for breakout logic, SL & TP behavior and signal quality assessment
🔷 PURPOSE
This tool identifies breakout candles from a calculated channel range and visually simulates entries, stop losses, and take profits, providing live and historical performance metrics.
⚙️ MAIN SETTINGS
1️⃣ Channel Setup
channel_length = 10 → how many candles are averaged to form channel boundaries
channel_multiplier = 0.0 → adds expansion above/below the base channel
channel_smoothing_type = SMA → smoothing method for high/low averaging
📊 The channel consists of two moving averages: one from highs, the other from lows. When expanded (via multiplier), it creates a buffer range for breakout validation.
2️⃣ Signal Detection
Body > Channel % = 50 → a breakout candle's body must exceed 150% of the channel width
Signal Mode:
• Weak → every valid breakout candle is highlighted
• Strong → only the first signal in a sequence is shown (helps reduce noise)
🟦 Bullish signals (blue):
• Candle opens inside the channel
• Closes above the channel
• Body is large enough
• Optional: confirms with trend (if enabled)
🟨 Bearish signals (yellow):
• Candle opens inside the channel
• Closes below the channel
• Body is large enough
• Optional: confirms with trend
3️⃣ Trend Filter (optional)
Enabled via checkbox
Uses a higher timeframe MA to filter signals
Bullish signals are allowed only if price is below the trend MA
Bearish signals only if price is above it
⏱️ trend_timeframe = 1D (typically set higher than the chart's timeframe)
🟢 Trend line is plotted if enabled
🎯 ENTRY, STOP LOSS & TAKE PROFIT LOGIC
SL and TP are based on channel width, not fixed pip/tick size:
📍 Entry Price = close of the breakout candle
🛑 Stop Loss:
• Bullish → below the lower channel border (minus offset)
• Bearish → above the upper channel border (plus offset)
🎯 Take Profit:
• Bullish → entry + channel width × profit multiplier
• Bearish → entry − channel width × profit multiplier
You can control:
Profit Target Multiplier (e.g., 1.0 → TP = 1×channel width)
Stop Loss Target Multiplier (e.g., 0.5 → SL = 0.5×channel width)
Signals to Show = how many historical SL/TP setups to display
📈 Lines and labels ("TP", "SL") are drawn on the chart for clarity.
🧪 QUALITY ANALYSIS MODULE
If enabled, the indicator will:
Track each new signal (entry, SL, TP)
Analyze outcomes:
• Win = TP hit before SL
• Loss = SL hit before TP
• Expired = signal unresolved after N bars
Display statistics in a table (top-right corner):
📋 Table fields:
✅ Overall win rate
📈 Bullish win rate
📉 Bearish win rate
🔢 Total signals
🕓 Pending (still active trades)
Maximum bars to wait for outcome is customizable (max_bars_to_analyze).
📐 VISUALIZATION TOOLS
TP / SL lines per signal
Labels “TP” and “SL”
Optional channel lines and trendline for better context
Colored bars for valid signals (blue/yellow)
📌 BEST USE CASES
Understand how breakout signals are formed
Learn SL/TP logic based on dynamic range
Test how volatility affects trade outcomes
Use as a visual simulation of trade behavior over time

Zone Shift [ChartPrime]⯁ OVERVIEW
Zone Shift is a dynamic trend detection tool that uses EMA/HMA-based bands to determine trend shifts and plot key reaction levels. It highlights trend direction through colored candles and marks important retests with visual cues to help traders stay aligned with momentum.
⯁ KEY FEATURES
Dynamic EMA-HMA Band:
Creates a three-line channel using the average of an EMA and HMA for the midline, and expands it using average candle range to form upper and lower bounds. This band visually adapts to market volatility.
float ema = ta.ema(close, length)
float hma = ta.hma(close, length-40)
float dist = ta.sma(high-low, 200)
float mid = math.avg(ema, hma)
float top = mid + dist
float bot = mid - dist
Trend Detection (Band Cross Logic):
Detects an uptrend when the Low crosses above the top band.
Detects a downtrend when the High crosses below the bottom band.
Bars change color to lime for uptrends and blue for downtrends.
Trend Initiation Level:
At the start of a new trend, the indicator locks in the extreme point (low for uptrend, high for downtrend) and plots a dashed horizontal level, serving as a potential retest zone.
Trend Retest Signal:
If price crosses back over the Trend Initiation level in the direction of the trend, a diamond label (⯁) is plotted at the retest point — confirming that price is revisiting a key shift level.
Visual Band Layout:
Midline: Dashed line shows the average of EMA and HMA.
Top/Bottom: Solid lines showing dynamic thresholds above/below the midline.
These help visualize compression, expansion, and possible breakout zones.
Color-Based Candle Plotting:
Candles are recolored in real time according to the current trend, allowing instant visual alignment with the market’s directional bias.
Noise-Filtered Retests:
To avoid repetitive signals, retests are only marked if they occur more than 5 bars after the previous one — filtering out minor fluctuations.
⯁ USAGE
Use colored candles to align trades with the dominant trend.
Treat dashed trendStart levels as important support/resistance zones.
Watch for ⯁ diamond labels as confirmation of retests for continuation or entry.
Use band boundaries to assess trend strength and volatility expansion.
Combine with your existing setups to validate momentum and zone shifts.
⯁ CONCLUSION
Zone Shift helps traders visually capture trend changes and key reaction points with precision. By combining band breakouts with real-time retest signals and trend-colored candles, this tool simplifies the process of reading market structure shifts and identifying high-confluence entry areas.

Step-OMA with SignalsThe Step-OMA with Signals is a sophisticated trend-following indicator that combines Loxx's Optimized Moving Average (OMA) algorithm with an advanced step function to create a highly responsive yet smooth trend detection system. This indicator excels at identifying trend changes early while minimizing false signals through its adaptive filtering mechanism.
Core Algorithm Components
1. Optimized Moving Average (OMA) Foundation
Based on Loxx's advanced OMA implementation
Uses a 6-stage exponential smoothing process
Incorporates adaptive period calculation based on market noise
Employs Jurik-style smoothing techniques for superior signal quality
2. Step Function Integration
Implements a step-based trend detection mechanism
Uses ATR-based dynamic threshold calculation
Maintains trend consistency through threshold memory
Provides clear trend change identification
3. Adaptive Noise Filtering
Automatically adjusts to market volatility
Calculates optimal averaging periods based on price noise
Reduces false signals in choppy market conditions
Speed (Default: 3.0, Range: -1.5 to unlimited)
This is the most critical parameter affecting indicator behavior:
Positive Speed Values (0 to 10.0+):
Creates faster, more responsive signals
Higher values increase sensitivity to recent price action
Negative Speed Values (-1.5 to -0.1):
Produces smoother, more conservative signals
Reduces noise and false breakouts
Creates delayed but more reliable trend confirmations
Adaptive (Default: True)
When enabled: Automatically adjusts averaging period based on market noise
When disabled: Uses fixed length parameter
Recommendation: Keep enabled for most market conditions
Sensitivity Factor (Default: 3.0)
Controls the threshold distance for trend change detection
Lower values: More frequent signals, higher sensitivity
Higher values: Fewer but more reliable signals
Optimal range: 2.0-5.0 depending on market volatility
Step Size Period (Default: 50)
Determines the ATR calculation period for dynamic thresholds
Affects the indicator's adaptation to volatility changes
Lower values: More reactive to recent volatility
Higher values: More stable threshold calculation
For a trading application, Step-OMA is a suitable base filter to complement other types of signaling indicators (oscillators, momentum indicators).
Disclaimer: This indicator is a technical analysis tool and should be used in conjunction with proper risk management and comprehensive market analysis. Past performance does not guarantee future results.
Logarithmic Moving Average (LMA) [QuantAlgo]🟢 Overview
The Logarithmic Moving Average (LMA) uses advanced logarithmic weighting to create a dynamic trend-following indicator that prioritizes recent price action while maintaining statistical significance. Unlike traditional moving averages that use linear or exponential weights, this indicator employs logarithmic decay functions to create a more sophisticated price averaging system that adapts to market volatility and momentum conditions.
The indicator displays a smoothed signal line that oscillates around zero, with positive values indicating bullish momentum and negative values indicating bearish momentum. The signal incorporates trend quality assessment, momentum confirmation, and multiple filtering mechanisms to help traders and investors identify trend continuation and reversal opportunities across different timeframes and asset classes.
🟢 How It Works
The indicator's core innovation lies in its logarithmic weighting system, where weights are calculated using the formula: w = 1.0 / math.pow(math.log(i + steepness), 2) The steepness parameter controls how aggressively recent data is prioritized over historical data, creating a dynamic weight decay that can be fine-tuned for different trading styles. This logarithmic approach provides more nuanced weight distribution compared to exponential moving averages, offering better responsiveness while maintaining stability.
The LMA calculation combines multiple sophisticated components. First, it calculates the logarithmic weighted average of closing prices. Then it measures the slope of this average over a 10-period lookback: lmaSlope = (lma - lma ) / lma * 100 The system also incorporates trend quality assessment using R-squared correlation analysis of log-transformed prices, measuring how well the price data fits a linear trend model over the specified period.
The final signal generation uses the formula: signal = lmaSlope * (0.5 + rSquared * 0.5) which combines the LMA slope with trend quality weighting. When momentum confirmation is enabled, the indicator calculates annualized log-return momentum and applies a multiplier when the momentum direction aligns with the signal direction, strengthening confirmed signals while filtering out weak or counter-trend movements.
🟢 How to Use
1. Signal Interpretation and Threshold Zones
Positive Values (Above Zero): LMA slope indicating bullish momentum with upward price trajectory relative to logarithmic baseline
Negative Values (Below Zero): LMA slope indicating bearish momentum with downward price trajectory relative to logarithmic baseline
Zero Line Crosses: Signal transitions between bullish and bearish regimes, indicating potential trend changes
Long Entry Threshold Zone: Area above positive threshold (default 0.5) indicating confirmed bullish signals suitable for long positions
Short Entry Threshold Zone: Area below negative threshold (default -0.5) indicating confirmed bearish signals suitable for short positions
Extreme Values: Signals exceeding ±1.0 represent strong momentum conditions with higher probability of continuation
2. Momentum Confirmation and Visual Analysis
Signal Color Intensity: Gradient coloring shows signal strength, with brighter colors indicating stronger momentum
Bar Coloring: Optional price bar coloring matches signal direction for quick visual trend identification
Position Labels: Real-time position classification (Bullish/Bearish/Neutral) displayed on the latest bar
Momentum Weight Factor: When short-term log-return momentum aligns with LMA signal direction, the signal receives additional weight confirmation
Trend Quality Component: R-squared values weight the signal strength, with higher correlation indicating more reliable trend conditions
3. Examples: Preconfigured Settings
Default: Universally applicable configuration balanced for medium-term investing and general trading across multiple timeframes and asset classes.
Scalping: Highly responsive setup with shorter period and higher steepness for ultra-short-term trades on 1-15 minute charts, optimized for quick momentum shifts.
Swing Trading: Extended period with moderate steepness and increased smoothing for multi-day positions, designed to filter noise while capturing larger price swings on 1-4 hour and daily charts.
Trend Following: Maximum smoothing with lower steepness for established trend identification, generating fewer but more reliable signals optimal for daily and weekly timeframes.
Mean Reversion: Shorter period with high steepness for counter-trend strategies, more sensitive to extreme moves and reversal opportunities in ranging market conditions.

Stochastic SuperTrend [BigBeluga]🔵 OVERVIEW
A hybrid momentum-trend tool that combines Stochastic RSI with SuperTrend logic to deliver clean directional signals based on momentum turns.
Stochastic SuperTrend is a straightforward yet powerful oscillator overlay designed to highlight turning points in momentum with high clarity. It overlays a SuperTrend-style envelope onto the Stochastic RSI, generating intuitive up/down signals when a momentum shift occurs across the neutral 50 level. Built for traders who appreciate simplicity without sacrificing reliability.
🔵 CONCEPTS
Stochastic RSI: Measures momentum by applying stochastic calculations to the RSI curve instead of raw price.
SuperTrend Bands: Dynamic upper/lower bands are drawn around the smoothed Stoch RSI line using a user-defined multiplier.
Momentum Direction: Trend flips when the smoothed Stoch RSI crosses above/below the calculated bands.
Neutral Bias Filter: Directional arrows only appear when momentum turns above or below the central 50 level—adding confluence.
🔵 FEATURES
Trend Detection on Oscillator: Applies SuperTrend logic directly to the Stoch RSI curve.
Clean Entry Signals:
→ 🢁 arrow printed when trend flips bullish below 50 (bottom reversals).
→ 🢃 arrow printed when trend flips bearish above 50 (top reversals).
Custom Multiplier: Adjust sensitivity of SuperTrend band spacing around the oscillator.
Neutral Zone Highlight: Visual zone between 0–50 (green) and 50–100 (red) for quick momentum polarity reference.
Toggle SuperTrend Line: Option to show/hide the SuperTrend trail on the Stoch RSI.
🔵 HOW TO USE
Use 🢁 signals for potential bottom reversals when momentum flips bullish from oversold regions.
Use 🢃 signals for potential top reversals when momentum flips bearish from overbought areas.
Combine with price-based SuperTrend or support/resistance zones for confluence.
Suitable for scalping, swing trading, or momentum filtering across all timeframes.
🔵 CONCLUSION
Stochastic SuperTrend is a simple yet refined tool that captures clean momentum shifts with directional clarity. Whether you're identifying reversals, filtering entries, or spotting exhaustion in a trend, this oscillator overlay delivers just what you need— no clutter, just clean momentum structure.
