Smart Trend Signal with Bands [wjdtks255]Indicator Description for TradingView
Title: Adaptive Trend Kernel
Description:
The "Adaptive Trend Kernel " is a versatile trend-following and volatility indicator designed to help traders identify dynamic market trends, potential reversals, and price extremes within a channel. Built upon a customized linear regression model, this indicator provides clear visual cues to enhance your trading decisions.
Key Features:
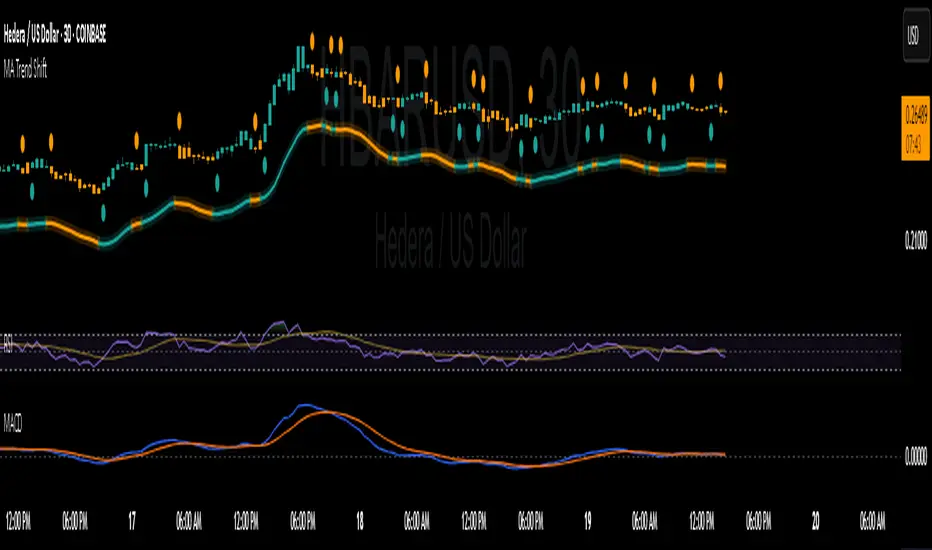
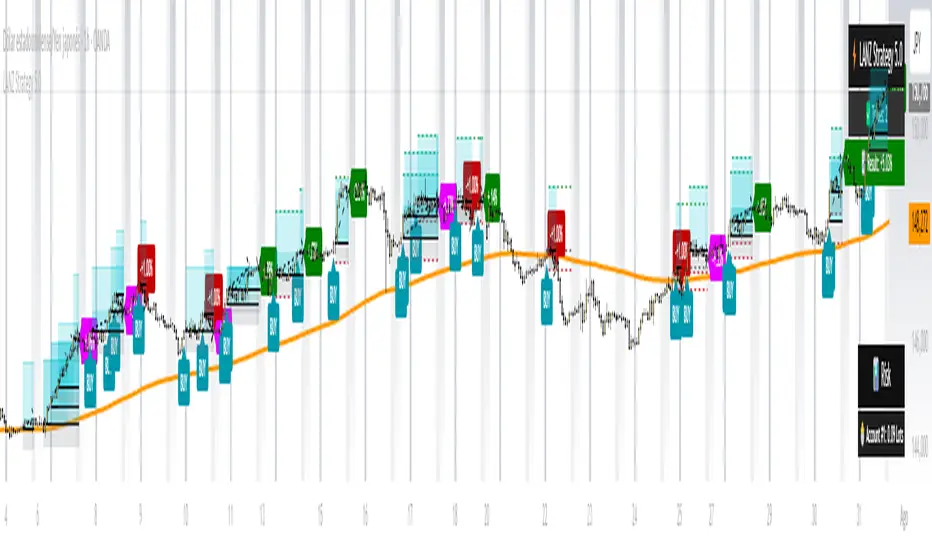
Regression Line: A central dynamic line representing the core trend direction, calculated based on a user-defined "Regression Length."
Regression Bands: Standard deviation-based bands plotted around the Regression Line, which act like a dynamic channel. These bands expand and contract with market volatility, indicating potential overbought/oversold conditions relative to the trend.
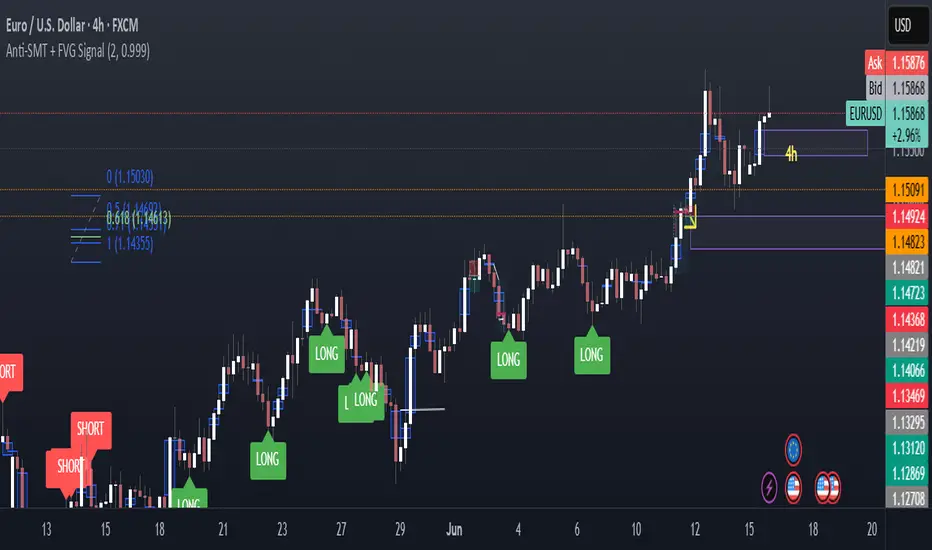
Trend Reversal Signals: Distinct "Up" (green triangle up) and "Down" (red triangle down) signals are generated when the price (close) crosses over or under the Regression Line. These signals suggest potential shifts in the short-term trend direction.
Visual Customization: Highly flexible input options for adjusting line colors, band colors, line width, and panel opacity. Users can toggle the visibility of bands and trend labels to suit their chart preferences.
Panel Label: A subtle "Regression" label is dynamically positioned, offering clear context without cluttering the main chart.
How it Works: The indicator calculates a linear regression line as the adaptive center of the price movement. Standard deviation is then used to create upper and lower bands, encapsulating typical price fluctuations. Signals are fired when price breaks out of the regression line, suggesting a momentum shift in line with the established trend or a potential reversal.
Trading Methods & Strategies
Here are some trading strategies you can apply using the "Adaptive Trend Kernel " indicator:
Trend-Following with Confirmation:
Long Entry: Look for an "Up" signal (green triangle up) when the price is above the Regression Line, especially after a brief retracement towards the line. This confirms that the uptrend is likely resuming.
Short Entry: Look for a "Down" signal (red triangle down) when the price is below the Regression Line, especially after a brief rally towards the line. This confirms that the downtrend is likely resuming.
Exit Strategy: Consider exiting if an opposite signal appears, or if the price closes outside the opposite band, indicating potential overextension or reversal.
Reversal / Counter-Trend Play:
Long Entry (Aggressive): When the price approaches or briefly dips below the Lower Regression Band and then generates an "Up" signal (green triangle up). This could indicate a potential bounce from an oversold condition relative to the trend.
Short Entry (Aggressive): When the price approaches or briefly moves above the Upper Regression Band and then generates a "Down" signal (red triangle down). This could indicate a potential pullback from an overbought condition relative to the trend.
Confirmation: This strategy works best when combined with other reversal confirmation patterns (e.g., bullish/bearish engulfing candlesticks) or divergences in other momentum indicators (like RSI).
Volatility Breakout:
Entry (Long): After a period of low volatility where the Regression Bands are narrow, observe if the price decisively breaks above the Upper Regression Band and an "Up" signal appears. This suggests a strong bullish momentum breakout.
Entry (Short): After a period of low volatility where the Regression Bands are narrow, observe if the price decisively breaks below the Lower Regression Band and a "Down" signal appears. This suggests a strong bearish momentum breakdown.
Management: Volatility breakouts can be swift; use appropriate risk management and profit-taking strategies.
Important Considerations:
Risk Management: Always apply proper stop-loss and take-profit levels. No indicator is infallible.
Timeframe Sensitivity: Adjust the "Regression Length" and "Band Multiplier" according to the asset and timeframe you are trading. Shorter lengths might suit scalping, while longer lengths are better for swing trading.
Confirmation with Other Tools: For higher conviction trades, use this indicator in conjunction with other technical analysis tools such like volume, MACD, or RSI on an oscillator pane.
Backtesting: Always backtest any strategy on historical data to understand its performance characteristics before live trading.
Pine Script® göstergesi