Crypto Chronicles CloudIchimoku Cloud with crypto settings
Best used on longer time frames (24hr, 3d etc.)
"crypto" için komut dosyalarını ara

Crypto Money Bot - Trading Bot for Bitcoin (BTCUSD)This takes my previous script, adds even more logic conditions, and sets up long and short entries in a strategy that can trade.
Default settings with a $5,000 starting balance have shown this bot to get the following results:
Net Profit: $ 10302.70 / 206.05 %
EXAMPLES
LOGIC
This indicator looks for accumulation of buying and selling along with trend flows for oversold and overbought opportunities to align the trade entries. It does not trade all the time, but when it does pull a trade the success rates are higher.
You could choose to pair this with another indicator to do a manual entry, or to manage your stop losses and money management strategy.
PROOF
Check out the reviews on the original indicator that this is built upon (and more logic) is here:
NOTES
You can try this strategy on other charts if you want, it is only tested and supported on BTCUSD. To try it on ETHUSD, change the settings from BTC to ETH. If you get a "resolve_error" it means that specific coin is not supported.
ACCESS
If you'd like to use my custom indicator - send 0.05 BTC to 32Hagdtq7PCR4inF4ZPkCReEjyecm2eNaP then email me at samurai_crypto@protonmail.com with your TradingView username and your transaction ID and I will add you.
Costs are lifetime with full support via email on how to use it.

Crypto Money Index - buy Signals for Bitcoin and MoreAn updated version of my previous script, this one includes buy alerts.
It has been tested with Bitcoin (BTC), Monero (XMR), Ethereum (ETH), Dash (DSH), Bitcoin Cash (BCH), LiteCoin (LTC), and IOTA (IOT).
To use for Futures on BitMex (as shown in examples), you need to use the Override feature and set the prefix. For example, Bitcoin futures on BitMex is XBTZ17 - so you would set the override to true and pair to BTC. For Ethereum futures on BitMex, you would turn the override to true and set the pair to ETH.
For USD based pairs (BTCUSD, ETHUSD) it will update automatically.
Ok, on to examples...
Here is how we can see the Bitcoin Cash pump that happened this week BEFORE it happened by seeing price action in the indicator:
Here is a similar example with DASH:
Here is another (again) example with Monero (XMR):
Lastly, IOTA (IOT) with lots of buying signals and double bottoms to play with... regardless if you got in early and rode a small loss for a bit, it popped as well.
ALERTS
To have an alert, create one on the chart and set it based on Trigger being greater than 0.
ACCESS
If you'd like to use my custom indicator - send 0.01 BTC to 32Hagdtq7PCR4inF4ZPkCReEjyecm2eNaP then email me at samurai_crypto@protonmail.com with your TradingView username and your transaction ID and I will add you.
Costs are lifetime with full support via email on how to use it.

Crypto-Optimized Ichimoku Cloud [Public]Made public and open since I didn't really do anything unique here.
Uses 'Double Crypto' ichimokou settings, and adds a couple new visual features over regular ichimokou.
Made the leading spans' cloud much more visible, and added a new cloud between the base and conversion lines hinting at the trend as well as resistance/support.

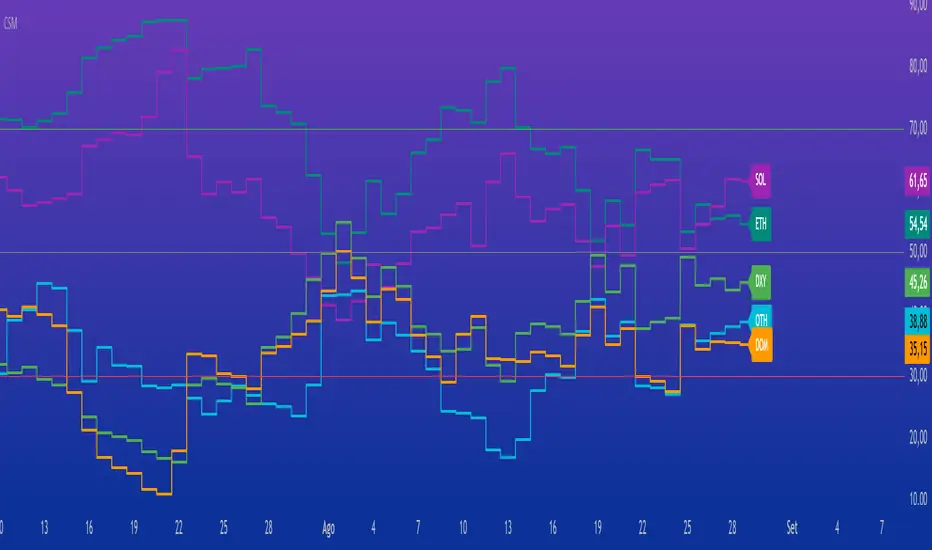
Crypto Strength MatrixOverview
The "Crypto Strength Matrix" is a custom Pine Script v5 indicator designed for cryptocurrency traders to assess the relative strength of major crypto market segments against traditional markets (e.g., the U.S. Dollar Index) and Bitcoin dominance. This indicator plots the strength of Altcoins (excluding ETH and SOL), Ethereum (ETH), Solana (SOL), the Dollar Index (DXY) versus Altcoins, and Bitcoin Dominance (DOM) on a 0-100 scale, using the Relative Strength Index (RSI) methodology. It provides a visual and intuitive way to identify overbought (>70) or oversold (<30) conditions across these assets, helping traders spot potential entry or exit points in the crypto market.
How It Works
The indicator fetches real-time data from various crypto and forex symbols available on TradingView, including:
CRYPTOCAP:TOTAL2 (total altcoin market cap),
CRYPTOCAP:ETH and CRYPTOCAP:SOL (market caps of ETH and SOL),
CRYPTO:ETHUSD and CRYPTO:SOLUSD (ETH and SOL prices),
CRYPTOCAP:BTC.D (Bitcoin dominance),
TVC:DXY (U.S. Dollar Index).
Calculations:
Altcoin Strength (OTH): Measures the RSI of the normalized market cap of all altcoins excluding ETH and SOL (calculated as TOTAL2 - ETH - SOL), relative to the total altcoin market cap. This reflects the strength of smaller altcoins.
ETH Strength: Computes the RSI of ETH/USD price adjusted by the DXY, isolating ETH's performance against the dollar.
SOL Strength: Similar to ETH, calculates the RSI of SOL/USD price adjusted by the DXY, focusing on Solana's strength.
DXY vs Altcoins: Uses the RSI of the DXY divided by the normalized total altcoin market cap, indicating the dollar's strength relative to altcoins.
Bitcoin Dominance (DOM): Directly applies RSI to Bitcoin dominance data, showing BTC's market control.
Each metric is plotted as a line with a unique color (OTH in aqua, ETH in teal, SOL in purple, DXY in green, DOM in orange) and labeled at the end of the chart for easy identification. Horizontal lines at 70 (overbought), 50 (neutral), and 30 (oversold) provide reference levels.
How to Use
Add the Indicator: Apply the "Crypto Strength Matrix" to a cryptocurrency chart (e.g., BTC/USD or ETH/USD) on a daily or 4-hour timeframe for optimal results.
Interpret the Lines:
OTH (Altcoins excluding ETH and SOL): A value above 70 suggests strong momentum in smaller altcoins, while below 30 indicates weakness. Monitor for divergence with ETH and SOL.
ETH and SOL: High values (>70) signal potential overbought conditions for these assets, while low values (<30) may indicate oversold opportunities.
DXY: Rising above 70 may suggest a stronger dollar, potentially pressuring crypto prices, while below 30 could indicate a weakening dollar, favoring crypto.
DOM: A value above 70 reflects strong Bitcoin dominance, often leading to altcoin underperformance, while below 30 may signal altcoin season.
Combine with Price Action: Use the indicator alongside candlestick patterns or volume analysis to confirm trade signals.
Adjust RSI Length: The default RSI length is 14, but you can tweak this input in the indicator settings to suit your trading style (e.g., 7 for shorter-term, 21 for longer-term trends).
Monitor Trends: Look for crossovers between lines (e.g., OTH rising above DXY) or alignment with the 50 neutral line to gauge market shifts.
Tips
Timeframe Selection: Daily charts provide a broad market view, while 4-hour charts offer more frequent signals. Avoid very short timeframes (e.g., 5m) due to noise.
Contextual Awareness: Combine with macroeconomic news (e.g., U.S. dollar strength) and Bitcoin price movements for better decision-making.
Risk Management: Use the indicator as a supplementary tool, not a standalone signal, and always set stop-losses based on your risk tolerance.
This indicator is ideal for crypto traders seeking a comprehensive view of market dynamics without the complexity of multiple charts. Enjoy trading with the "Crypto Strength Matrix"!
BTC Dominance Excluding StablecoinsBTC Dominance Excluding Stablecoins
Description:
The "BTC Dominance Excluding Stablecoins" indicator calculates Bitcoin's dominance as a percentage of the total cryptocurrency market capitalization, excluding the market caps of major stablecoins (USDT and USDC). Unlike the standard BTC.D ticker, which includes stablecoins in the total market cap, this indicator provides a clearer view of Bitcoin’s dominance relative to the "non-stable" crypto market. This can be useful for traders and analysts who want to assess Bitcoin’s strength without the influence of stablecoin market caps, which often skew dominance metrics during periods of high stablecoin usage.
How It Works:
Bitcoin Market Cap: Fetches Bitcoin’s market capitalization using CRYPTOCAP:BTC.
Total Market Cap: Retrieves the total cryptocurrency market cap via CRYPTOCAP:TOTAL.
Stablecoin Adjustment: Subtracts the market caps of USDT (CRYPTOCAP:USDT) and USDC (CRYPTOCAP:USDC) from the total market cap.
Dominance Calculation: Computes Bitcoin’s dominance as (BTC Market Cap / Adjusted Total Market Cap) * 100, where the adjusted total excludes stablecoins.
Output: Plots the resulting dominance percentage as a line chart.
Features:
Displays Bitcoin dominance excluding stablecoins on any timeframe.
Customizable line color and thickness for better visualization.
Provides a more accurate representation of Bitcoin’s market share in the volatile, non-stablecoin crypto ecosystem.
Usage:
Add this indicator to your TradingView chart to compare Bitcoin’s dominance against the broader altcoin market, free from stablecoin distortions. Use it alongside other indicators like BTC.D or price charts to analyze market trends, especially during periods of high stablecoin inflows or outflows.
Notes:
The indicator currently excludes USDT and USDC, the two largest stablecoins by market cap. Additional stablecoins (e.g., DAI, BUSD) can be added by modifying the script if desired.
Data is sourced from TradingView’s CRYPTOCAP symbols, which may have slight delays or variations depending on exchange data feeds.
Best used on daily or higher timeframes for smoother, more reliable results.
Author:
Created by K Du₿
Version:
Pine Script v5

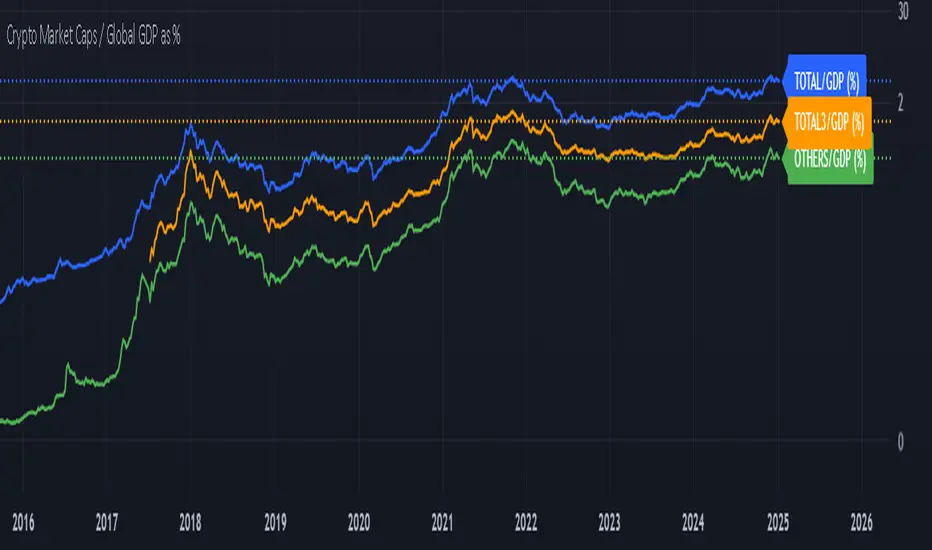
Crypto Market Caps / Global GDP %This indicator compares the total market capitalization of various crypto sectors to the global Gross Domestic Product (GDP), expressed as a percentage. The purpose of this indicator is to provide a visual representation of the relative size of the crypto market compared to the global economy, allowing traders and analysts to understand how the market is growing in relation to the overall economy.
Key Features
Crypto Market Caps -
TOTAL: Represents the total market capitalization of all cryptocurrencies.
TOTAL3: Represents the market capitalization of all cryptocurrencies, excluding Bitcoin and Ethereum.
OTHERS: Represents the market capitalization of all cryptocurrencies excluding the top 10.
Global GDP -
The indicator uses a combination of GDP data from multiple regions across the world, including:
GDP from the EU, North America (NA), and other regions.
GDP data from Asia, Latin America (LATAM), and the Middle East & North Africa (MENA).
Percentage Representation -
The market caps (TOTAL, TOTAL3, OTHERS) are compared to the global GDP, and the result is expressed as a percentage. This allows you to easily see how the size of the cryptocurrency market compares to the entire global economy at any given time.
Plotting and Visualization
The indicator plots the market cap to global GDP ratio for each category (TOTAL, TOTAL3, OTHERS) on the chart.
You can choose which plots to display through user inputs.
The percentage scale makes it easy to compare how much of the global GDP is represented by different parts of the crypto market.
Labels can be added for additional clarity, showing the exact percentage value on the chart.
How to Use
The indicator provides a clear view of the cryptocurrency market's relative size compared to the global economy.
Higher values indicate that the crypto market (or a segment of it) is becoming a larger portion of the global economy.
Lower values suggest the crypto market is still a smaller segment of the global economic activity.
User Inputs
TOTAL/GlobalGDP: Toggle visibility for the total market capitalization of all cryptocurrencies.
TOTAL3/GlobalGDP: Toggle visibility for the market cap of cryptocurrencies excluding Bitcoin and Ethereum.
OTHERS/GlobalGDP: Toggle visibility for the market cap of cryptocurrencies excluding the top 10.
Labels: Enable or disable the display of labels showing the exact percentage values.
Practical Use Cases
Market Sentiment: Gauge the overall market sentiment and potential growth relative to global economic conditions.
Investment Decisions: Help identify when the crypto market is becoming more or less significant in the context of the global economy.
Macro Analysis: Combine this indicator with other macroeconomic indicators to gain deeper insights into the broader economic landscape.
By providing an easy-to-understand percentage representation, this indicator offers valuable insights for anyone interested in tracking the relationship between cryptocurrency market cap and global economic activity.
Crypto Perp Calc v1Advanced Perpetual Position Calculator for TradingView
Description
A comprehensive position sizing and risk management tool designed specifically for perpetual futures trading. This indicator eliminates the confusion of calculating leveraged positions by providing real-time position metrics directly on your chart.
Key Features:
Interactive Price Selection: Click directly on chart to set entry, stop loss, and take profit levels
Accurate Lot Size Calculation: Instantly calculates the exact position size needed for your margin and leverage
Multiple Entry Support: DCA into positions with up to 3 entry points with customizable allocation
Multiple Take Profit Levels: Scale out of positions with up to 3 TP targets
Comprehensive Risk Metrics: Shows dollar P&L, account risk percentage, and liquidation price
Visual Risk/Reward: Color-coded boxes and lines display your trade setup clearly
Real-time Info Table: All critical position data in one organized panel
Perfect for traders using perpetual futures who need precise position sizing with leverage.
---------
How to Use
Quick Start (3 Clicks)
1. Add the indicator to your chart
2. Click three times when prompted:
First click: Set your entry price
Second click: Set your stop loss
Third click: Set your take profit
3. Read the TOTAL LOTS value from the info table (highlighted in yellow)
4. Use this lot size in your exchange when placing the trade
Detailed Setup
Step 1: Configure Your Account
Enter your account balance (total USDT in account)
Set your margin amount (how much USDT to risk on this trade)
Choose your leverage (1x to 125x)
Select Long or Short position
Step 2: Set Price Levels
Main levels use interactive clicking (Entry, SL, TP)
For multiple entries or TPs, use the settings panel to manually input prices and percentages
Step 3: Read the Results
The info table shows:
TOTAL LOTS - The position size to enter on your exchange
Margin Used - Your actual capital at risk
Notional - Total position value (margin × leverage)
Max Risk - Dollar amount you'll lose at stop loss
Total Profit - Dollar amount you'll gain at take profit
R:R Ratio - Risk to reward ratio
Account Risk - Percentage of account at risk
Liquidation - Price where position gets liquidated
Step 4: Advanced Features (Optional)
Multiple Entries (DCA):
Enable "Use Multiple Entries"
Set up to 3 entry prices
Allocate percentage for each (must total 100%)
See individual lot sizes for each entry
Multiple Take Profits:
Enable "Use Multiple TPs"
Set up to 3 TP levels
Allocate percentage to close at each level (must total 100%)
View profit at each target
Visual Elements
Blue lines/labels: Entry points
Red lines/labels: Stop loss
Green lines/labels: Take profit targets
Colored boxes: Visual risk (red) and reward (green) zones
Info table: Can be positioned anywhere on screen
Alerts
Set price alerts for:
Entry zones reached
Stop loss approached
Take profit levels hit
Works with TradingView's alert system
Tips for Best Results
Always verify the lot size matches your intended risk
Check the liquidation price stays far from your stop loss
Monitor the account risk percentage (recommended: keep under 2-3%)
Use the warning indicators if risk exceeds margin
For quick trades, use single entry/TP; for complex strategies, use multiple levels
Example Workflow
Find your trade setup using your analysis
Add this indicator and click to set levels
Check risk metrics in the table
Copy the TOTAL LOTS value
Enter this exact position size on your exchange
Set alerts for key levels if desired
This tool bridges the gap between TradingView charting and exchange execution, ensuring your position sizing is always accurate when trading with leverage.
Disclaimer, this was coded with help of AI, double check calculations if they are off.

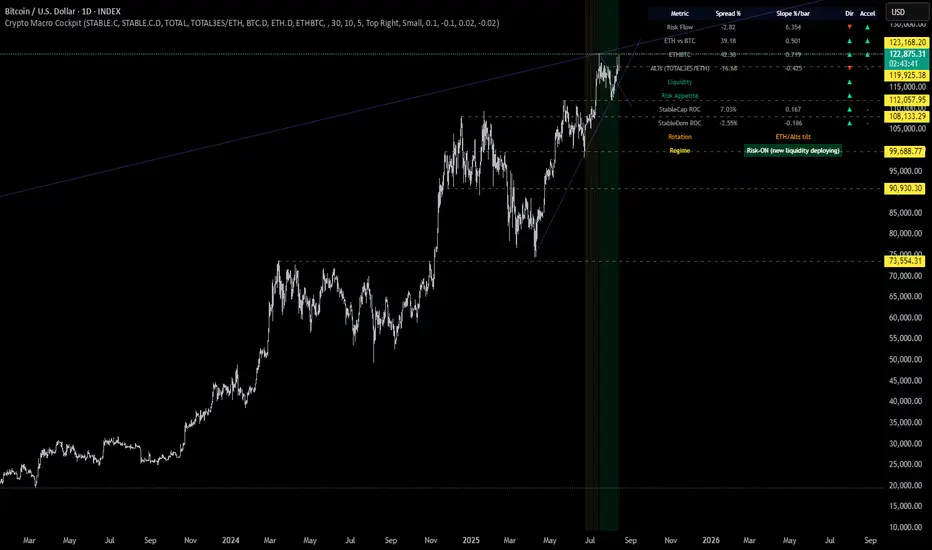
Crypto Macro CockpitCrypto Macro Cockpit — Institutional Liquidity Regime Detection
🔍 Overview
This script introduces a modern macro framework for crypto market regime detection, leveraging newly added stablecoin market data on TradingView. It’s designed to guide traders through the evolving institutional era of crypto — where liquidity, not just price, is king.
🌐 Why This Matters
Historically, traditional proxies like M2 money supply or bond yields were referenced to infer macro liquidity shifts. But with the regulatory green light and institutional embrace of stablecoins, on-chain fiat liquidity is now directly observable.
Stablecoins = The new M2 for crypto.
This script utilizes real-time data from:
📊 CRYPTOCAP:STABLE.C (Total Stablecoin Market Cap)
📊 CRYPTOCAP:STABLE.C.D (Stablecoin Dominance)
to assess dry powder, risk appetite, and macro regime transitions.
📋 How to Read the Crypto Macro Cockpit
This dashboard updates every few bars and is organized into four actionable segments:
1️⃣ Macro Spreads
Metric --> Interpretation
Risk Flow --> Measures capital flow between stablecoins and total crypto market cap. → Green = risk deploying.
ETH vs BTC --> Shift in dominance between ETH and BTC → rotation gauge.
ETHBTC --> Price ratio movement → confirms leadership tilt.
ALTs (TOTAL3ES) --> Momentum in altcoin market, excluding BTC/ETH/stables → key for alt season timing.
2️⃣ Liquidity & Risk Appetite
Metric --> Interpretation
Liquidity --> Directional change in stablecoin cap → more stables = more dry powder.
Risk Appetite --> Inverse of stablecoin dominance → falling dominance = capital rotating into risk.
3️⃣ Stablecoin Context
Metric --> Interpretation
StableCap ROC --> Growth rate of stablecoin market cap → proxy for fiat inflows.
StableDom ROC --> Change in stablecoin dominance → reflects market caution or aggression.
4️⃣ Composite Labels
Label --> Interpretation
Rotation --> Sector tilt (BTC-led vs ETH/Alts)
Regime --> Synthesized macro environment → "Risk-ON", "Caution", "Waiting", or "Risk-OFF"
Background Color --> Optional tint reflecting regime for quick glance validation
All metrics are evaluated with directional arrows (▲/▼/•) and acceleration overlays, using user-defined thresholds scaled by timeframe for precision.
🔔 Built-in Alerts
Predefined, non-repainting alerts include:
Regime transitions
Sector rotations
Confirmed ETH/ALT rotations
Stablecoin market cap spikes
Risk Flow acceleration
You can use these alerts for discretionary trading or automated system triggers.
⚠️ Disclaimer
This script is for educational and informational purposes only. It does not constitute financial advice. Trading cryptocurrencies involves risk, and past performance does not guarantee future results. Always do your own research and manage risk responsibly.
✅ Ready to Use
No configuration needed — just load the script
Works on all timeframes (optimized for 1D)
Thresholds and smoothing are customizable
Table positioning and sizing is user-controlled
If you find this helpful, feel free to ⭐️ favorite or leave feedback. Questions welcome in the comments.
Let’s trade with macro awareness in this new era.
Crypto Risk-Weighted Allocation SuiteCrypto Risk-Weighted Allocation Suite
This indicator is designed to help users explore dynamic portfolio allocation frameworks for the crypto market. It calculates risk-adjusted allocation weights across major crypto sectors and cash based on multi-factor momentum and volatility signals. Best viewed on INDEX:BTCUSD 1D chart. Other charts and timeframes may give mixed signals and incoherent allocations.
🎯 How It Works
This model systematically evaluates the relative strength of:
BTC Dominance (CRYPTOCAP:BTC.D)
Represents Bitcoin’s share of the total crypto market. Rising dominance typically indicates defensive market phases or BTC-led trends.
ETH/BTC Ratio (BINANCE:ETHBTC)
Gauges Ethereum’s relative performance versus Bitcoin. This provides insight into whether ETH is leading risk appetite.
SOL/BTC Ratio (BINANCE:SOLBTC)
Measures Solana’s performance relative to Bitcoin, capturing mid-cap layer-1 strength.
Total Market Cap excluding BTC and ETH (CRYPTOCAP:TOTAL3ES)
Represents Altcoins as a broad category, reflecting appetite for higher-risk assets.
Each of these series is:
✅ Converted to a momentum slope over a configurable lookback period.
✅ Standardized into Z-scores to normalize changes relative to recent behavior.
✅ Smoothed optionally using a Hull Moving Average for cleaner signals.
✅ Divided by ATR-based volatility to create a risk-weighted score.
✅ Scaled to proportionally allocate exposure, applying user-configured minimum and maximum constraints.
🪙 Dynamic Allocation Logic
All signals are normalized to sum to 100% if fully confident.
An overall confidence factor (based on total signal strength) scales the allocation up or down.
Any residual is allocated to cash (unallocated capital) for conservative exposure.
The script automatically avoids “all-in” bias and prevents negative allocations.
📊 Outputs
The indicator displays:
Market Phase Detection (which asset class is currently leading)
Risk Mode (Risk On, Neutral, Risk Off)
Dynamic Allocations for BTC, ETH, SOL, Alts, and Cash
Optional momentum plots for transparency
🧠 Why This Is Unique
Unlike simple dominance indicators or crossovers, this model:
Integrates multiple cross-asset signals (BTC, ETH, SOL, Alts)
Adjusts exposure proportionally to signal strength
Normalizes by volatility, dynamically scaling risk
Includes configurable constraints to reflect your own risk tolerance
Provides a cash fallback allocation when conviction is low
Is entirely non-repainting and based on daily closing data
⚠️ Disclaimer
This script is provided for educational and informational purposes only.
It is not financial advice and should not be relied upon to make investment decisions.
Past performance does not guarantee future results.
Always consult a qualified financial advisor before acting on any information derived from this tool.
🛠 Recommended Use
As a framework to visualize relative momentum and risk-adjusted allocations
For research and backtesting ideas on portfolio allocation across crypto sectors
To help build your own risk management process
This script is not a turnkey strategy and should be customized to fit your goals.
✅ Enjoy exploring dynamic crypto allocations responsibly!

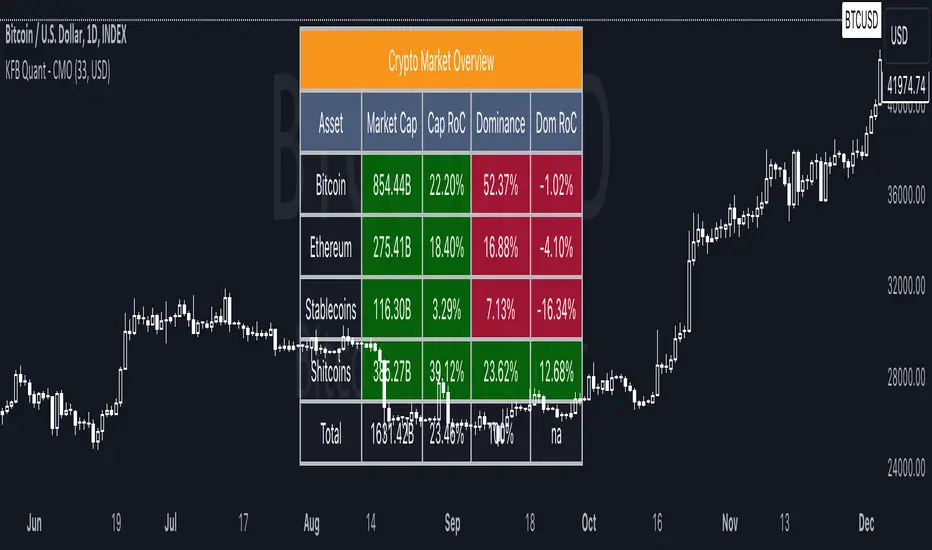
Crypto Market OverviewCrypto Market Overview
The Crypto Market Overview (CMO) indicator is your one-stop tool for keeping tabs on the cryptocurrency market. It provides a comprehensive snapshot of key data and trends, helping you make informed decisions in the fast-paced world of crypto trading. Here's what this indicator offers:
1. Lookback Period Control:
You can customize the lookback period for percentage change calculations, tailoring it to your specific analysis needs.
2. Currency Selection:
Choose your preferred currency to view market data in your desired denomination.
3. Major Market Cap Data:
Real-time information on Bitcoin (BTC) and Ethereum (ETH) market caps.
Total market capitalization data for the entire crypto market.
4. Stablecoin Market Cap Data:
Keep track of stablecoin market caps, including USDT, USDC, DAI, TUSD, and BUSD.
Get a clear picture of the stablecoin segment of the market.
5. Shitcoin Market Cap Data:
An interesting category that represents the market cap of all cryptocurrencies not classified as major or stable.
6. Dominance Data:
Dominance percentages for BTC, ETH, stablecoins and shitcoins.
Total market dominance, allowing you to gauge the influence of major cryptocurrencies.
7. Rate of Change (RoC) Metrics:
Monitor the RoC for market caps and dominance percentages.
Positive or negative trends are clearly highlighted with color-coded indicators.
8. Intuitive Table Layout:
A user-friendly table layout displays all the data.
Key assets such as Bitcoin and Ethereum are listed along with their market caps and dominance.
9. Color Coding:
Upward and downward trends are easily identifiable with color-coded cells.
A white background with bold text ensures readability.
The Crypto Market Overview indicator is an invaluable tool for cryptocurrency traders and enthusiasts, offering a quick and convenient way to stay updated on market dynamics. It's perfect for making data-driven decisions in the ever-changing world of digital assets.
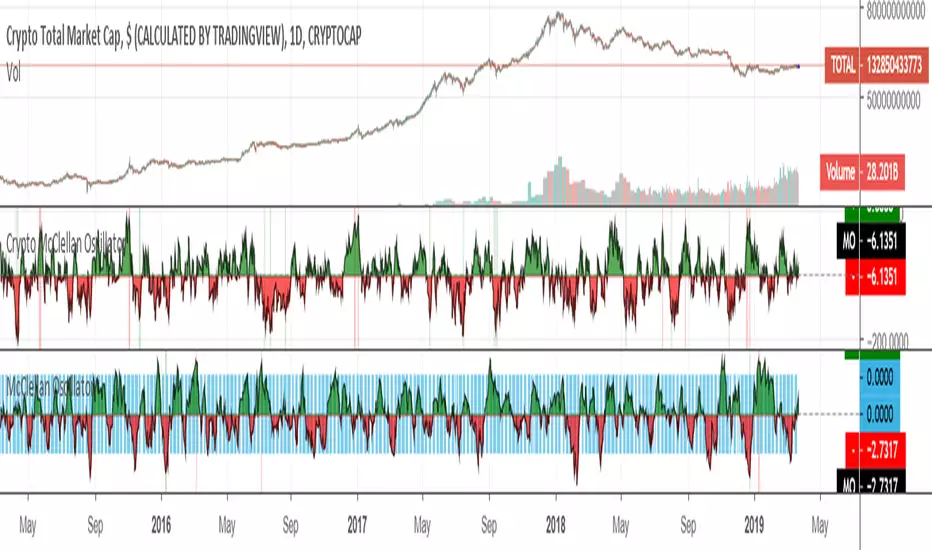
Crypto McClellan OscillatorMcClellan Oscillator for cryptocurrency, taking into account only the top 40 cryptos.
Original code was by LazyBear.
Crypto Compass | QuantEdgeBIntroducing Crypto Compass | QuantEdgeB
Overview
Crypto Compass | QuantEdgeB is a multi-asset market regime indicator that decodes the collective momentum and sentiment of the cryptocurrency space. By computing correlation-adjusted valuation across a basket of major tokens and blending them with the chart’s own momentum pulse, it delivers a real-time “compass” of risk-on/off regimes. Plotted as dual EMAs and color-coded candles, and accompanied by a comprehensive dashboard table, Crypto Compass guides traders through broad market cycles instead of isolated price swings.
Key Features
• Correlation-Adjusted Valuation Aggregation
Computes individual valuation for the top 30 Market Cap tokens plus total-market indices; weights each by its correlation to Bitcoin, then averages.
• Large-Cap-Only Mode
Optionally restricts the basket to the top 10 by market cap for a streamlined “blue-chip” sentiment readout.
• Composite Momentum Blend
Mixes the basket average with the chart’s own valuation to capture both cross-asset and local momentum.
• Dual EMA Overlay & Candle Coloring
Plots 12- and 21-period EMAs colored by the composite valuation gradient; candles are likewise color-filled to reflect regime strength.
• Interactive Dashboard Table
Live “Crypto Compass Dashboard” shows, for each asset:
o Current value & prior bar value
o Rate of Change (direction arrow)
o Duration since last EMA crossover
o Current trend state (“Bullish” / “Bearish”)
• Regime Labels & Risk-On/Off Signal
Translates the composite valuation into four regimes—Contraction, Weak, Recovery, Strong—with a clear risk-on/off indicator banner.
How It Works
1. Data Fetch & Valuation Computation
o Retrieves price and a simple TPI (12 vs 21 EMA cross) for each symbol via request.security.
o Calculates a rolling standard deviation over a lookback (length) for each asset and the chart.
2. Correlation Weighting
o Measures each asset’s correlation to Bitcoin
o Multiplies each asset’s value by its correlation coefficient to emphasize high-beta relationships.
3. Basket Averaging
o Averages the top-N weighted value (10 if “Large Cap Only” is true, else all )
o Blends the final average with the chart’s own valuation
4. Visual & Table Overlays
o EMAs (12, 21) and candles are colored via a gradient tied to zsumad thresholds.
o A table grid at the bottom-right displays per-asset metrics and computes duration since TPI crossovers to flag trend longevity.
5. Regime Mapping
≤ –1.5 ⇒ Contraction (Risk Off)
–1.5 to 0 ⇒ Weak (Risk Off)
0 to 1.5 ⇒ Recovery (Risk On)
1.5 ⇒ Strong (Risk On)
How to Use / Who Should Use It
• Crypto Portfolio Managers seeking a holistic market-wide directional bias before allocating capital.
• Swing & Position Traders looking to confirm if cross-asset strength aligns with their primary coin.
• Systematic Strategy Developers integrating regime filters into algorithmic models.
• Risk-Conscious Allocators wanting an early warning on risk-off contractions vs. risk-on expansions.
Default Settings
• Plot EMA: On
• Value Lookback Length: 90
• BTC Correlation Length: 195
• Large Cap Only: True
Conclusion
Crypto Compass distills complex cross-asset dynamics into a single, actionable gauge. By combining correlation-weighted valuation, blended momentum, and dynamic regime mapping—visualized through color-coded EMAs, candles, and a rich dashboard—it empowers traders to navigate the broader crypto market cycle with clarity and confidence.
🔹 Disclaimer: Past performance is not indicative of future results. No trading strategy can guarantee success in financial markets.
🔹 Strategic Advice: Always backtest, optimize, and align parameters with your trading objectives and risk tolerance before live trading.

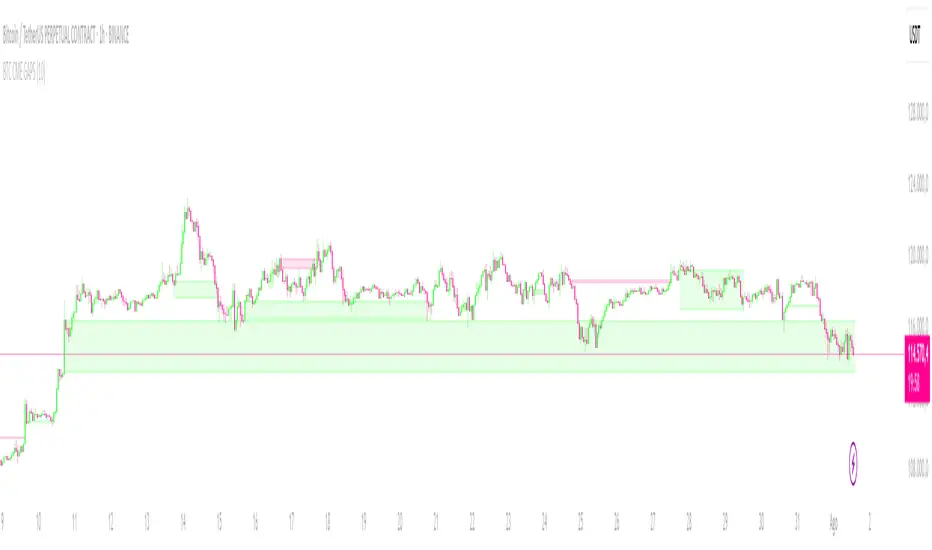
CRYPTO CME GAPS- Can be used in any crypto symbol of any exchange, (not necessarily the CME exchange)
- Displays the CME gaps with the colors green or red depending on the sentiment of the gap
- Extends the gaps displayed until they are filled.
- In the end of the code there are the boolean values 'filled_bull' and 'filled_bear' that can be used to create a strategy script.
Crypto DanR 1.4.2 PC-Roye Edition📜 Crypto DanR 1.4.2 — PC Roye Edition (Open Source)
This indicator combines Smart Money Concepts (SMC), Liquidity Analysis, and Trend Filtering to provide traders with a high-quality tool for intraday and swing trading on assets like XRP/USDT.
✅ What This Script Does
Crypto DanR 1.4.2 integrates the following advanced features:
Break of Structure (BOS) & Change of Character (CHoCH):
Detects key shifts in market structure
Helps confirm trend direction and reversal points
Fair Value Gaps (FVG):
Displays unmitigated liquidity voids using a style inspired by LuxAlgo
Highlights potential retracement zones where smart money may re-enter
Equal Highs / Equal Lows (EQH/EQL):
Marks liquidity zones that institutions often target before reversals
Order Blocks (OB):
Identifies potential institutional demand/supply zones
Option to filter by wick, body, or mitigation logic
Fibonacci Volatility Bands (based on BigBeluga’s logic):
Detects potential price extremes using Fib extensions on volatility
10 Moving Averages in One (inspired by hiimannshu's script):
Supports 10 custom MAs (SMA, EMA, RMA, HMA, VWMA, etc.) with adjustable source and timeframe
Ideal for trend filtering or dynamic support/resistance
Vector Candles (TradersReality / PVSRA):
Color-coded candles showing real-time volume pressure and trend bias
Visual Trade Plan:
Optional overlay for entry, stop-loss, and take-profit planning
Displays risk-to-reward ratio and potential % gain/loss live
🧠 How It Works
The script uses a price-action-first approach, built around concepts from Smart Money Theory. CHoCH and BOS detect structural shifts, while FVGs and OBs help forecast likely reaction zones. The multiple moving averages act as a trend filter to avoid entering against momentum.
This combination allows traders to:
Enter on mitigations or breakouts
Set stops outside liquidity zones
Manage trades visually with dynamic risk/reward levels
📊 Best Use Cases
15m or 1h scalping (ideal)
Swing trading on 4h
Works well on crypto, FX, and indices
🙏 Credits
TradersReality for PVSRA logic via public library
LuxAlgo for FVG inspiration
hiimannshu for 10-in-1 MA logic
BigBeluga for Fibonacci Bands methodology
All reused logic is significantly modified and part of a broader framework.
📌 Notes
Script is open-source to promote transparency and collaboration
Please do not copy-paste and republish without adding meaningful improvements
Feedback and suggestions welcome!

Crypto Narratives Performance [SwissAlgo]Crypto Narratives Performance Index
--------------------------------------------------------
What this indicator is
This script displays a relative performance index that compares the market capitalization trends of various crypto categories (narratives) against a selected 'Base asset' (BTC, ETH, or SOL) over a configurable rolling time window (default: 14-day).
It’s designed to help users observe sector rotation dynamics across the crypto ecosystem — such as whether DeFi is outperforming ETH, or if AI coins are underperforming relative to BTC.
--------------------------------------------------------
What it does
This indicator measures the percentage change in total market cap of a selected crypto sector over a user-defined lookback period, and compares it to the percentage change in market cap of a chosen base asset over the same period. The result is expressed as a ratio and transformed into a z-score, normalized over the last 180 bars. This allows the user to easily identify whether the sector is outperforming or underperforming the base asset in relative terms.
It also includes a smoothed signal line, a performance table, and marked background zones (levels of standard deviations) to help interpret potential extremes in sector outperformance or underperformance.
--------------------------------------------------------
How it works
It retrieves daily market capitalization data for both the selected base asset and sector from TradingView's CRYPTOCAP: data feed.
It computes the percent change in $ market cap over one of the following selectable periods: 1, 3, 7, 14, 30, or 60 days (14-day is the default).
The percentage change of the base is subtracted from the percentage change of the sector, producing a raw relative performance differential.
This differential is then normalized into a Z-Score, using a 180-day rolling mean and standard deviation.
The Z-Score is smoothed using an exponential moving average (EMA), and plotted against a secondary EMA signal line (to track potential performance trend changes).
A visual table compares the performance of all listed sectors against the selected base, ranked and annotated with basic symbols (stars for performance, alerts for underperformance vs. the selected 'Base Asset', i.e. BTC or ETH or SOL).
--------------------------------------------------------
Visual Features
* Color-coded plot line: Turns green, yellow, orange, or red based on zone and momentum.
* Signal line: Gray EMA of the z-score for trend comparison.
* Background fill zones:
±3 = "Extreme" outperform/underperform
±2 to ±3 = "Strong" zone
±1 to ±2 = Mild over/underperformance
±1 to -1 = Neutral performance range
* Dynamic Table:
Displays all sector vs. base performance differences.
Highlights the selected comparison sector.
Uses emojis (⭐/⚠️) for relative status at a glance.
--------------------------------------------------------
Who may benefit
This script may assist:
Crypto analysts tracking capital rotation across narratives.
Swing traders looking to spot momentum trends in crypto sectors.
Portfolio allocators observing which groups are leading or lagging relative to majors (BTC, ETH, SOL).
Developers or researchers evaluating sentiment shifts across categories (e.g., AI tokens rising vs. DeFi).
It is not a buy/sell signal tool — it's a sector/crypto narratives -relative monitor.
--------------------------------------------------------
Key Applications
Detect sector rotation (e.g., when Layer 1s start to outperform ETH, or BTC/SOL).
Monitor if certain categories are experiencing sustained interest or fading momentum.
Compare the strength of emerging narratives like DePIN, RWA, or World Liberty vs. majors.
Identify possible "mean-reversion" setups when a sector is excessively stretched relative to its historical norm.
--------------------------------------------------------
Limitations
Data dependency: All calculations rely on TradingView’s CRYPTOCAP: market cap feeds.
Normalization window: The z-score normalization is static at 180 bars; in choppy markets this may over-smooth or underreact.
Asset inclusion: The sectors reflect predefined index aggregates. Not all coins in a category may be equally weighted or relevant.
Lag: EMA smoothing introduces delay in reactive plotting.
No intra-day support: Works best on daily timeframes, as CRYPTOCAP: feeds are daily-only.
Not predictive: This script reflects past capital flows. It does not forecast future price moves.
--------------------------------------------------------
Customization
Users can adjust the following:
Base asset: BTC, ETH, SOL
Crypto sector (comparison): Choose from 11+ sectors, including DeFi, AI, Memes, Layer 1, etc.
Rolling performance period: Choose between 1–60 days.
Smoothing settings: Length of the EMA for the ratio and signal line.
Show/hide info table: Useful for screen space management.
Special Notes:
Please set the chart timeframe at 1-day in line with CRYPTOCAP data availability.
Please select the dark color scheme to view table and colors properly.
--------------------------------------------------------
Risk Disclaimer
This indicator is for informational and educational purposes only. It does not constitute financial advice, trading advice, or an invitation to engage in any financial strategy. Always conduct your own due diligence before making investment decisions. Use at your own risk.
Market conditions may shift rapidly, and past sector performance is not necessarily indicative of future outcomes. This tool is best used as part of a broader analytical framework, not in isolation.
Protected script: source code is hidden to preserve logic integrity and prevent tampering.
If you need clarification or encounter unexpected behavior with data feeds, please check the TradingView Help Center or post in the "Indicators and Strategies" section of the TradingView community.

Crypto Breadth | AlphaNatt\ Crypto Breadth | AlphaNatt\
A dynamic, visually modern market breadth indicator designed to track the strength of the top 40 cryptocurrencies by measuring how many are trading above their respective 50-day moving averages. Built with precision, branding consistency, and UI enhancements for fast interpretation.
\ 📊 What This Script Does\
* Aggregates the performance of \ 40 major cryptocurrencies\ on Binance
* Calculates a \ breadth score (0.00–1.00)\ based on how many tokens are above their moving averages
* Smooths the breadth with optional averaging
* Displays the result as a \ dynamic, color-coded line\ with aesthetic glow and gradient fill
* Provides automatic \ background zones\ for extreme bullish/bearish conditions
* Includes \ alerts\ for key threshold crossovers
* Highlights current values in an \ information panel\
\ 🧠 How It Works\
* Pulls real-time `close` prices for 40 coins (e.g., XRP, BNB, SOL, DOGE, PEPE, RENDER, etc.)
* Compares each coin's price to its 50-day SMA (adjustable)
* Assigns a binary score:
• 1 if the coin is above its MA
• 0 if it’s below
* Aggregates all results and divides by 40 to produce a normalized \ breadth percentage\
\ 🎨 Visual Design Features\
* Smooth blue-to-pink \ color gradient\ matching the AlphaNatt brand
* Soft \ glow effects\ on the main line for enhanced legibility
* Beautiful \ multi-stop fill gradient\ with 16 transition zones
* Optional \ background shading\ when extreme sentiment is detected:
• Bullish zone if breadth > 80%
• Bearish zone if breadth < 20%
\ ⚙️ User Inputs\
* \ Moving Average Length\ – Number of periods to calculate each coin’s SMA
* \ Smoothing Length\ – Smooths the final breadth value
* \ Show Background Zones\ – Toggle extreme sentiment overlays
* \ Show Gradient Fill\ – Toggle the modern multicolor area fill
\ 🛠️ Utility Table (Top Right)\
* Displays live breadth percentage
* Shows how many coins (e.g., 27/40) are currently above their MA
\ 🔔 Alerts Included\
* \ Breadth crosses above 50%\ → Bullish signal
* \ Breadth crosses below 50%\ → Bearish signal
* \ Breadth > 80%\ → Strong bullish trend
* \ Breadth < 20%\ → Strong bearish trend
\ 📈 Best Used For\
* Gauging overall market strength or weakness
* Timing trend transitions in the crypto market
* Confirming trend-based strategies with broad market support
* Visual dashboard in macro dashboards or strategy overlays
\ ✅ Designed For\
* Swing traders
* Quantitative investors
* Market structure analysts
* Anyone seeking a macro view of crypto performance
Note: Not financial advise

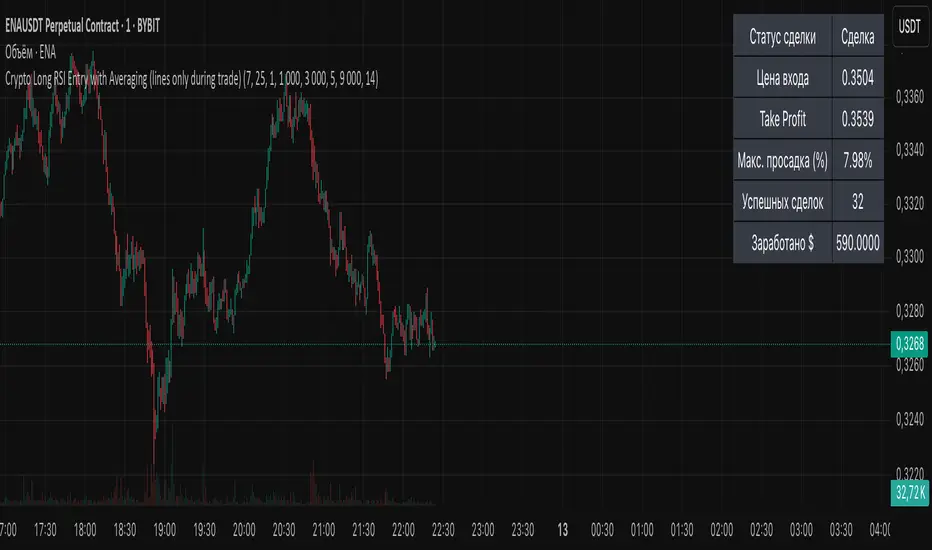
Crypto Long RSI Entry with AveragingIndicator Name:
04 - Crypto Long RSI Entry with Averaging + Info Table + Lines (03 style lines)
Description:
This indicator is designed for crypto trading on the long side only, using RSI-based entry signals combined with a multi-step averaging strategy and a visual information panel. It aims to capture price rebounds from oversold RSI levels and manage position entries with two staged averaging points, optimizing the average entry price and take-profit targets.
Key Features:
RSI-Based Entry: Enters a long position when the RSI crosses above a defined oversold level (default 25), with an optional faster entry if RSI crosses above 20 after being below it.
Two-Stage Averaging: Allows up to two averaging entries at user-defined price drop percentages (default 5% and 14%), increasing position size to improve average entry price.
Dynamic Take Profit: Adjusts take profit targets after each averaging stage, with customizable percentage levels.
Visual Signals: Marks entries, averaging points, and exits on the chart using colored labels and lines for easy tracking.
Info Table: Displays current trade status, averaging stages, total profit, number of wins, and maximum drawdown percentage in a table on the chart.
Graphical Lines: Shows horizontal lines for entry price, take profit, and averaging prices to visually track trade management.
Crypto Portfolio vs BTC – Custom Blend TrackerThis tool tracks the performance of a custom-weighted crypto portfolio (SUI, BTC, SOL, DEEP, DOGE, LOFI, and Other) against BTC. Simply input your start date to anchor performance and compare your basket’s relative strength over time. Ideal for portfolio benchmarking, alt-season tracking, or macro trend validation.
Supports all timeframes. Based on BTC-relative returns (not USD). Open-source and customizable.

Crypto EMA TableCrypto EMA Trend Scanner
A powerful tool for crypto traders to quickly identify trend strength across multiple timeframes
This indicator helps you spot potential trading opportunities by analyzing the EMA (Exponential Moving Average) alignment across four different timeframes. It displays a clean, color-coded table showing which cryptocurrencies are in a strong uptrend.
Key Features:
Multi-Timeframe Analysis: Simultaneously scan 3-minute, 15-minute, 1-hour, and 4-hour charts
Clear Visual Signals: Green cells indicate bullish EMA alignment (EMA 20 > EMA 50 > EMA 200)
Customizable Symbols: Track up to 3 different cryptocurrencies of your choice
Exchange Selection: Compatible with major exchanges (Bybit, Binance, Coinbase, Kraken, KuCoin, FTX)
Flexible Positioning: Place the table anywhere on your chart
How to Use:
Add the indicator to your chart
Select your preferred cryptocurrencies in the settings
Position the table where you want it
Look for green cells indicating EMA lineup.
Use this information to identify potential entry points or confirm your trading bias

NUPL Z-Score | Vistula LabsWhat is NUPL?
NUPL (Net Unrealized Profit/Loss) is a fundamental on-chain metric used to evaluate the profit or loss state of a cryptocurrency's market participants, such as Bitcoin (BTC) and Ethereum (ETH). It compares the current market capitalization—the total value of all coins at their current price—to the realized capitalization, which represents the average price at which all coins were last transacted on-chain.
Market Capitalization: Current price × circulating supply.
Realized Capitalization: The sum of the value of all coins based on the price at their last on-chain movement.
For Bitcoin (BTC):
NUPL = (Market Cap - Realized Cap) / Market Cap * 100
For Ethereum (ETH):
NUPL = (Market Cap - Realized Cap) / Market Cap
A positive NUPL indicates that the market holds unrealized profits, meaning the current value exceeds the price at which coins were last moved. A negative NUPL signals unrealized losses. Extreme NUPL values—high positives or low negatives—can suggest overvaluation (potential market tops) or undervaluation (potential market bottoms), respectively.
How NUPL is Calculated for BTC & ETH
This indicator calculates NUPL using data sourced from Glassnode and CoinMetrics:
For Bitcoin:
Market Cap: GLASSNODE:BTC_MARKETCAP
Realized Cap: COINMETRICS:BTC_MARKETCAPREAL
Formula: ((btc_market_cap - btc_market_cap_real) / btc_market_cap) * 100
For Ethereum:
Market Cap: GLASSNODE:ETH_MARKETCAP
Realized Cap: COINMETRICS:ETH_MARKETCAPREAL
Formula: ((eth_market_cap - eth_market_cap_real) / eth_market_cap) * 100
The indicator then transforms these NUPL values into a Z-Score, which measures how many standard deviations the current NUPL deviates from its historical average. The Z-Score calculation incorporates:
A customizable moving average of NUPL (options: SMA, EMA, DEMA, RMA, WMA, VWMA) over a user-defined length (default: 220 periods).
The standard deviation of NUPL over a specified lookback period (default: 200 periods).
Z-Score Formula:
Z-Score = (Current NUPL - Moving Average of NUPL) / Standard Deviation of NUPL
This normalization allows the indicator to highlight extreme market conditions regardless of the raw NUPL scale.
How This Indicator Can Be Used
Trend Following
The NUPL Z-Score indicator employs a trend-following system with adjustable thresholds to generate trading signals:
Long Signals: Triggered when the Z-Score crosses above the Long Threshold (default: 0.26).
Short Signals: Triggered when the Z-Score crosses below the Short Threshold (default: -0.62).
Visual Representations:
Green up-triangles: Indicate long entry points (plotted below the bar).
Red down-triangles: Indicate short entry points (plotted above the bar).
Color-coded elements:
Candles and Z-Score plot turn teal (#00ffdd) for long positions.
Candles and Z-Score plot turn magenta (#ff00bf) for short positions.
These signals leverage historical NUPL trends to identify potential momentum shifts, aiding traders in timing entries and exits.
Overbought/Oversold Conditions
The indicator flags extreme market states using additional thresholds:
Overbought Threshold (default: 3.0): When the Z-Score exceeds this level, the market may be significantly overvalued, hinting at potential selling pressure. Highlighted with a light magenta background (#ff00bf with 75% transparency).
Oversold Threshold (default: -2.0): When the Z-Score drops below this level, the market may be significantly undervalued, suggesting buying opportunities. Highlighted with a light teal background (#00ffdd with 75% transparency).
These extreme Z-Score levels have historically aligned with major market peaks and troughs, making them useful for medium- to long-term position management.
Customization Options
Traders can tailor the indicator to their preferences:
Cryptocurrency Source: Choose between BTC or ETH.
Moving Average Type: Select from SMA, EMA, DEMA, RMA, WMA, or VWMA.
Moving Average Length: Adjust the period for the NUPL moving average (default: 220).
Z-Score Lookback Period: Set the historical window for Z-Score calculation (default: 200).
Thresholds: Fine-tune values for: Long Threshold (default: 0.26), Short Threshold (default: -0.62), Overbought Threshold (default: 3.0), Oversold Threshold (default: -2.0)
These options enable users to adapt the indicator to various trading strategies and risk profiles.
Alerts
The indicator supports four alert conditions to keep traders informed:
NUPL Long Opportunity: Alerts when a long signal is triggered.
NUPL Short Opportunity: Alerts when a short signal is triggered.
NUPL Overbought Condition: Alerts when the Z-Score exceeds the overbought threshold.
NUPL Oversold Condition: Alerts when the Z-Score falls below the oversold threshold.
These alerts allow traders to monitor key opportunities without constantly watching the chart.
