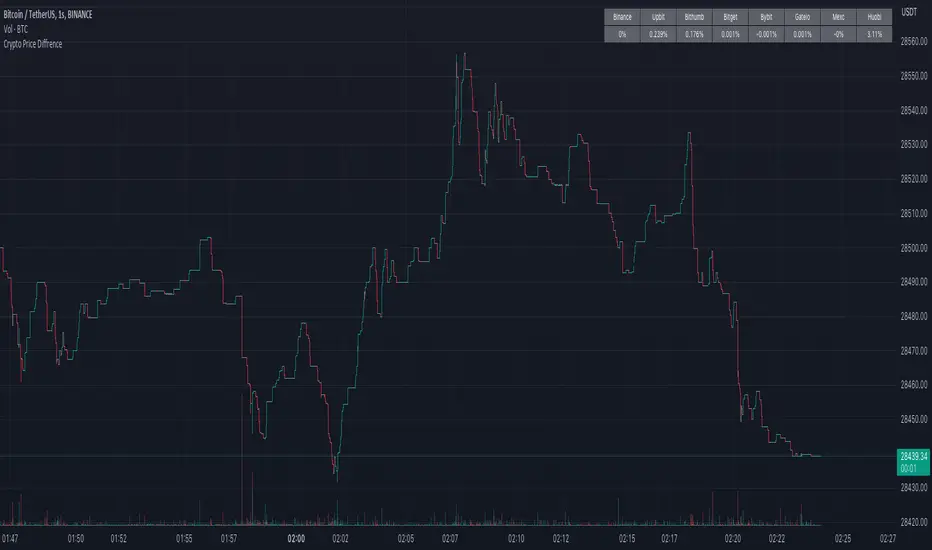
Crypto Price Diffrence
# Compare the price difference between cryptocurrency exchanges of the current cryptocurrency symbol.
# Supports Binance, Bybit, Bitget, Huobi, Mexc, and Gateio.
# The number displayed in the table is a percentage of the price difference, and a "+" indicates that the current exchange is more expensive.
# 현재 보고있는 가상화폐 심볼의 가상화폐 거래소간 가격차이를 비교해줍니다.
# Binance, Bybit, Bitget, Huobi, Mexc, Gateio 를 지원합니다.
# 테이블에 표시되는 수치는 가격차이의 퍼센트이며 +면 현재거래소가 더비싼 상태입니다.
"crypto" için komut dosyalarını ara
Crypto BTC Correlation Scalper Gaps StrategyThis strategy is based on the gaps theory.
In this case we have the BTC futures from CME, which acts in a way similar to stocks, and we can have gaps present between close/open session, and also sometimes between same candle due to huge movements intra candle.
At the same time I have combined this with a daily moving average, to help out a bit with the trend, since we are looking at small timeframe like 1-15/30min .
On top of that we have a reverse option, where long = short and viceversa, which can be used with against BTC pairs .
Rule are simple:
For long, we have a long gap and the close of the correlated candle is above daily sma
For short, we have a short gap and the close of the correlated candle is below daily sma
For exit:
For exit, we take the highest highest values for short entry TP, meaning we get the different from the HH and rest the current open candle distance, and use that distance as a TP.
At the same time for long entry, we take the lowest low value and rest current close of the candle to that value, and we get the TP.
Can also be applied this logic for SL aswell but from the test I have found out that exiting based on a reverse condition(when tp is not being hit), gives better results/dd overall.
If you have any questions, please let me know !

[Crypto] Supertrend - ADX - Reversal Candle* Commission: 0.06% = Binance future fee.
1. ADX INDICATOR: 1h & 4h timeframe have a strong strength for open trade.
- ADX smoothing: 14.
- DI length: 14.
- ADX STRONG > 25.
2. SUPERTREND INDICATOR:
- Long trend when closes candle is above the green line.
- Short trend when closes candle is below the red line.
3. REVERSAL CANDLES DETECT:
- Cancels the Short trend if occurs 5 bullish reversal candles.
- Cancels the Long trend if occurs 5 bearish reversal candles.
- Cancels the Short trend if occurs bullish Engulfing reversal candles.
- Cancels the Long trend if occurs bearish Engulfing reversal candles.
4. OPEN POSITION RULE:
- BUY/LONG: reject to Supertrend at current timeframe.
- SELL/SHORT: reject to Supertrend at current timeframe.
5. Autotrade with Money management: requires Pro, Pro +, Premium Tradingview & Webhook service.
6. Winrate of 129 coin pairs of Binance future
7. DEEP BACKTEST:
- BITCOIN ALL TIME HISTORY INDEX
- ETHEREUM ALL TIME HISTORY INDEX
- LITECOIN BINANCE FUTURE
- BINANCE COIN BINANCE FUTURE
- XRP BINANCE FUTURE

Crypto Force IndexIntroduction
The Crypto Force Index (CFI) indicator helps us understand the current strength and weakness of the price. It is very useful when used on high timeframes for investment purposes and not for short term trading.
To determine the strength and weakness of the price, a level grid based on the RSI indicator is used.
Based on the RSI value, red circles (oversold condition) and green circles (overbought condition) appear under the price candles. The more intense the color of the circles, the more that the current price is in an overbought or oversold condition.
The signal levels are all configurable to adapt the indicator across multiple instruments and markets.
The default configuration have been designed to obtain more accurate signals on Ethereum and Bitcoin, using the weekly timeframe.
Why Crypto Force Index?
The Crypto Force Index (CFI) is the consequence of my study of investments based on the accumulation plan. I wanted to demonstrate that I am improving the returns of the classic DCA ( dollar cost averaging ) and VA ( value averaging ).
After finding my own model of an accumulation plan, I decided to create the Crypto Force Index to help me visually enter the market.
The formulas of the indicator are very simple, but my studies confirm the power of this tool.
How are the signals to be interpreted?
The Crypto Force Index helps us to highlight the overbought and oversold areas, with the use of circles under the price of candles and with a thermometer inserted at the base of the graph, where all the phases of strength and weakness are highlighted.
As soon as the red circles start to appear on the chart, that may be a good time to enter LONG to the market and start accumulating. If the circles are green, we can consider decreasing the current exposure by selling part of your portfolio, or decide to stay flat.
I personally use these signals on the weekly timeframe, to decide to feed my accumulation plan at the beginning of each month.
I hope it can be of help to you! Please help me improve the Crypto Force Index! :)

Crypto Longs & Shorts (Multi Exchange) - InFinitoThis indicator uses data provided by different crypto derivative exchanges to estimate and display the potential Longs and Shorts opened and closed during a determined period. The indicator supports multiple exchanges and coins.
Knowing the the behavior of traders as in how they're positioning can be useful for different things like:
Get a sense of market sentiment
Better anticipating which way liquidity/stop hunts might potentially go.
All data is calculated based off OI data provided by exchanges except for Bitfinex which provides both Longs and Shorts opened and closed
Preset exchanges included are:
Bitfinex
Binance: USDT, USDPERP & BUSD pairs
Bitmex: USDT & USD pairs
Kraken
The indicator is preset to work with BTC but it can be easily changed to any coin by typing it's name (Capitalized) in the Coin Name box

Crypto addict 7 Accurate Buy & Sell indicators
The below indicators are recommended on the daily chart only.
Yellow Diamond - Possible bottom of the market. This diamond will only flash a few times in a cycle on the BTC chart. This is actually one the BEST buying signal
Green Buy – Buy
Red Sell - Sell / take profits
BIG red cross – Possible top and best signal to sell or take profits
BIG green cross – possible bottom and the best signal to buy
Silver Line – 111 MA
The modified 111 moving average is also a very good indicator. The market will test this support/resistance before the 200 moving average.
Purple line – 200 MA
The modified 200 moving average is a very good indicator. You will get a feel if the markets are in a up or down trend and identifying support and resistance areas. A daily candle close above the line is support and markets can move upwards. A daily close below indicate resistance and markets will move downwards
Red line – Confirmed bullish / bearish cycle!!
Green Line - This MA line indicate the bottom of the cycle - your absolute best entry point for the next cycle. This MA got a 10-year accurate record.
Remember that past history does not guarantee future results.

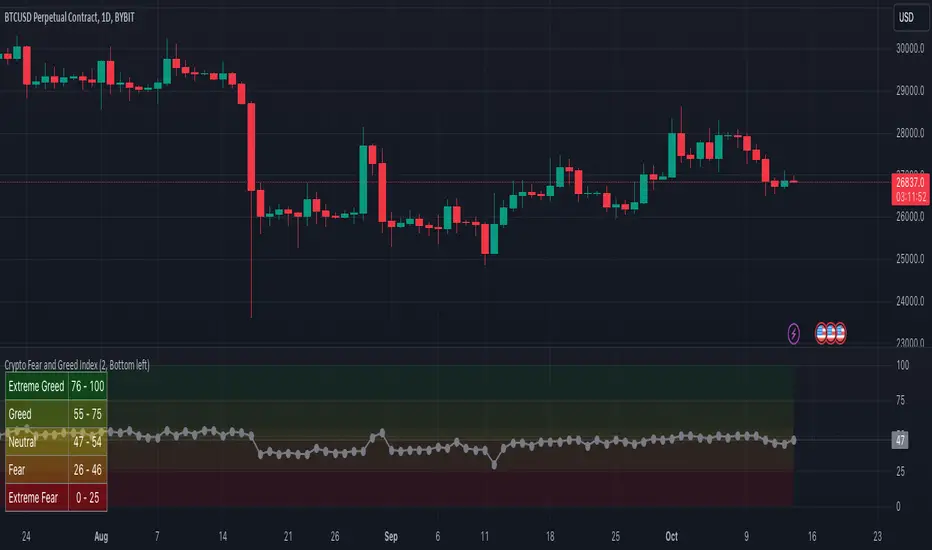
Crypto Fear and Greed IndexWhy Measure Fear and Greed?
The crypto market behaviour is very emotional. People tend to get greedy when the market is rising which results in FOMO (Fear of missing out). Also, people often sell their coins in irrational reaction of seeing red numbers. With our Fear and Greed Index, we try to save you from your own emotional overreactions.
There are two simple assumptions:
Extreme fear can be a sign that investors are too worried. That could be a buying opportunity.
When Investors are getting too greedy, that means the market is due for a correction.
Therefore, we analyse the current sentiment of the Bitcoin market and crunch the numbers into a simple meter from 0 to 100. Zero means "Extreme Fear", while 100 means "Extreme Greed".
Crypto Fear and Greed Index reflects historical data provided by AlternativeMe .
Kurisu Crypto OutliersCrypto assets are heavily reflexive and remain highly correlated to BTC/ETH for the most part; sometimes altcoins act out of sync from this nature and this indicator tries to spot them.
Works by plotting out a correlation matrix of different altcoins w/ BTC and ETH and then displaying relevant outliers with different color schemes.
Also, has pre-defined categories:
- Top coins by MCap
- DeFi
- Layer 1s
- CEX Tokens
- Memecoins
- Metaverse Tokens
You can enter custom fields by clicking the "Custom Symbols" boolean.
Full screen the indicator to view it properly.
The indicator builds on the work of RicardoSantos.

Crypto Spot Market BotHello Friends.
This script is only for long positions.
How does the algorithm work ?
The Relative Momentum Index
Relative Strength İndex
Average Directional Movement İndex
Momentum
When rsi and adx produce signals in the same direction, the rmi indicator confirms the signal. After the Confirmed Signal, the buy-side transaction is entered , the closed according to the % of profit taking and stoploss specified on the algorithm in the entered transaction.
In the spot market, it is possible to make money even in a down trend
All shared charts run within a 1-hour time frame.
Note : The shared backtest results have been shared as of 9/9/2021 by calculating 50% balance and 2 pyramiding methods in an account of 1000 dollars. Keep in mind that this algorithm will want to try to average down in possible worst-case scenarios. 2% - %3take profit levels will provide consecutive gains in the spot market.
How should the adjustments be made?
Value variables should be made according to formula a and formula b values and backtest results. You can increase the frequency of transactions by lowering the adx and rsi values.
Alarm Features ;
Signal Alert
TakeProfit Alert
Stoploss Alert.
Overview :
Backtest Script Link :

Crypto Spot Market Bot | BacktestHello Friends.
This script is only for long positions.
How does the algorithm work ?
The Relative Momentum Index
Relative Strength İndex
Average Directional Movement İndex
Momentum
When rsi and adx produce signals in the same direction, the rmi indicator confirms the signal. After the Confirmed Signal, the buy-side transaction is entered , the closed according to the % of profit taking and stoploss specified on the algorithm in the entered transaction.
In the spot market, it is possible to make money even in a down trend
All shared charts run within a 1-hour time frame.
Note : The shared backtest results have been shared as of 9/9/2021 by calculating 50% balance and 2 pyramiding methods in an account of 1000 dollars. Keep in mind that this algorithm will want to try to average down in possible worst-case scenarios. 2% - %3take profit levels will provide consecutive gains in the spot market.
How should the adjustments be made?
Value variables should be made according to formula a and formula b values and backtest results. You can increase the frequency of transactions by lowering the adx and rsi values.
Overview :

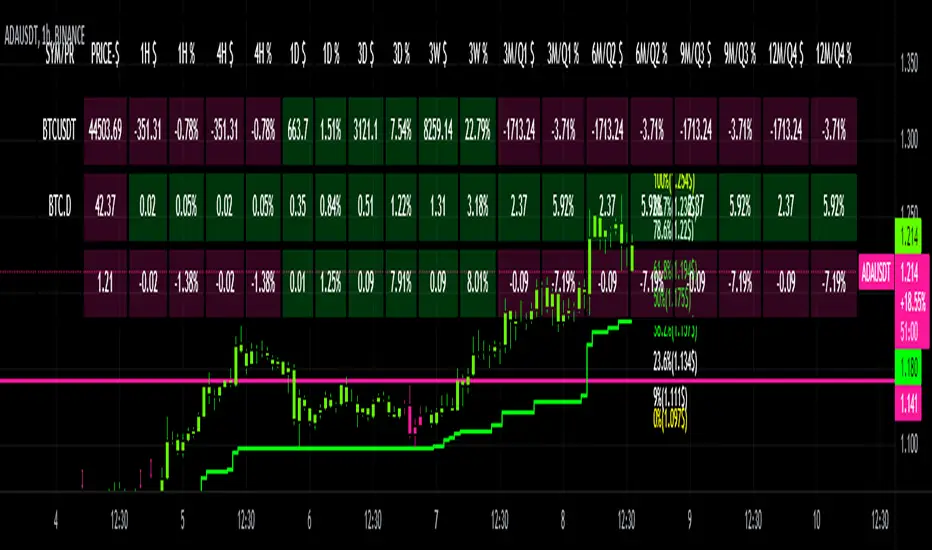
CRYPTO DASHBOARD Gs₿A Simple Crypto Dashboard/Screener which indicates the Price and percentage changes for the Given Period of time i.e for 1 Hr ,4 Hrs, 1 Day, 3 Days, 3 Weeks and 3 - 12 Months. By Default it displays #BTC and its Dominance and current trading pair Price and % changes.
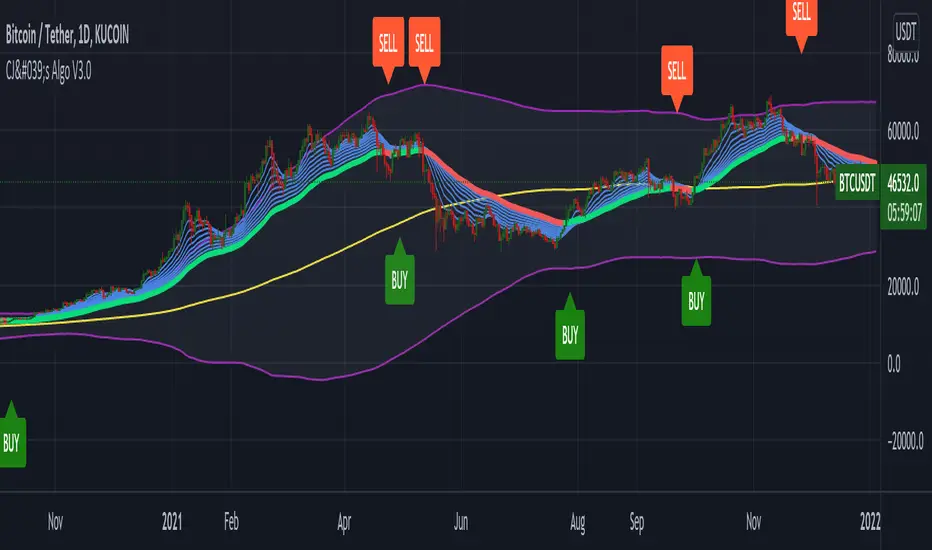
Crypto Jimboo's Algo V3Hey Everyone!
This is the third published version of my algo, Crypto Jimboo's Algo! I am an amateur coder and developer learning each day. This is my attempt at utilizing price action, some market data, and moving averages to make more successful trades. So far, it has proved to be pretty useful. If you are a beginner trader and you are looking for some help on learning how to read charts and understand price action - try this out. I will continue to try to add to it and make it better with time. I have seen success on the 5m, 15m, 1hr, 2hr, 4hr, and daily timeframes to this point. I have left the option of including or not including candlestick indicators/patterns in the settings options of the Algo (it will automatically add the candlestick patterns to the chart until you go into the settings of the indicator and check whatever ones you do not want off). Additionally, I left it so that the colors on the algo can be modified to the user's liking. You can also use the alert dialogue box to set alerts to your computer, email, and phone!
Best of luck and let me know how it works, please!
I have placed my strategy and a snapshot of how my chart looks below.
5m, 15m, 1hr, 2hr, 4hr, and Daily Timeframe Strategy
• For Buy – Ensure the price action is not at the top of the Bollinger Bands (purple lines in the snapshot), the price action is trading above all EMA lines (many blue lines), and check for a green trend catcher (the centerline that turns green and red as the price fluctuates). If the above is true, open a long position.
• For Sell – Ensure the price action is not at the bottom of the Bollinger Bands, the price action is trading below all EMA lines, and check for a red trend catcher. If the above is true, open a short position.
Crypto Volume/Strength ComparatorHello Traders,
Here is an attempt to perform comparative analysis between top cryptos based on strength (oscillator) and volume. Methodology used here is similar to Magic Number formula described in the post : Enhanced Magic Formula for fundamental analysis . But, instead of using fundamentals, we are making use of few technicals to derive similar outcome. Usage of the available stats will not be same as Magic number since we are using technicals.
⬜ Process
▶ Get crypto exchange based on prefix of instrument being used.
▶ For the given exchange, get data for all the tickers available in input fields.
▶ Calculate Oscillator, Momentum based on price for each tickers.
▶ Calculate Oscillator, Momentum based on volume for each tickers.
▶ Calculate Volatility for each tickers.
▶ Rank Price-Oscillator, Price-Momentum, Volume-Oscillator, Volume-Momentum, Volatility for each tickers.
▶ Calculate combined rank by adding up individual ranks.
▶ Calculate movement of rankings from bar to bar
▶ Sort tickers based on rank and populate them on table. Display direction of rankings.
⬜ Components
Display components are as follows:
⬜ Settings
Settings are pretty simple and straightforward
⬜ Calculations
▶ Oscillators : High values of oscillators are considered as ideal as the process is intended towards finding trend.
▶ Momentum : Momentum is calculated on the basis of Squeeze Momentum Indicator by @LazyBear.
▶ Volatility : Volatility is calculated on the basis of Williams Vix Fix by @ChrisMoody. Here too since we are in trend following mode, lower vix fix is considered ideal.
⬜ Few Notes
Tickers will show data only if selected exchange has them. Some tickers are not available in all exchanges. In that case, it will show NAN. This is kind of unavoidable as we need to have fixed size arrays for any calculations.
Indicator works only on crypto tickers which has valid exchange.
Tickers move through the rankings in real time. Background of all stats are based on gradient from green to red.
Tickers on top may not always have better long opportunity or tickers at bottom may not always be optimal for shorting. We need to consider how long the instrument may stay in the position or how fast it is moving in opposite direction. Hence, directions of the ranking movement are also shown on the table.

Crypto Scannner for Traffic Lights StrategyI allways try to make trading easier. Developing Scripts for a quick backtest and improvement of a strategy, getting alerts for entry and exit a position. Loading data to a spreadsheet is also important and takes time.
In this case finding good parameters in different markets or assets to enter in a position, is a bit exhausting. It is something you have to do everyday, and sometimes in different moments of the day.
So I manage to develop a Screener, to take a quick look at specific hours, and tell if I have a buy or sell condition in an specific asset. Obviously this is not an alert to make a trade instantaneusly, but this help you filter a lot of information in matters of seconds. Then open those specific charts and make a better analisys.
A few weeks ago, I published a scrpipt called "Traffic Lights Strategy", that uses 4 emas to get a buy or a sell condition.
It is easy to understand and use, but if you don´t want to missed some opportunities, and don't want to be look at the screen in all the time looking for them, I have here a simple solution.
This script works plotting 2 labels. The first one plots all the assets in which the condition is true (fastema > medema > slowema > filterema or fastema < medema < slowema < filterema)
The second one plots the assets were the condition is true only if happened up to 5 candles back, so you can be in time to enter a trade.
You can take the script and customize it for a different strategy or assets. I coded like this because I backtested this strategy in this specific assets, and statistics suggest that it might be profitable.
I hope this works for you. In other time I'll try to code a script for the others strategies I published.

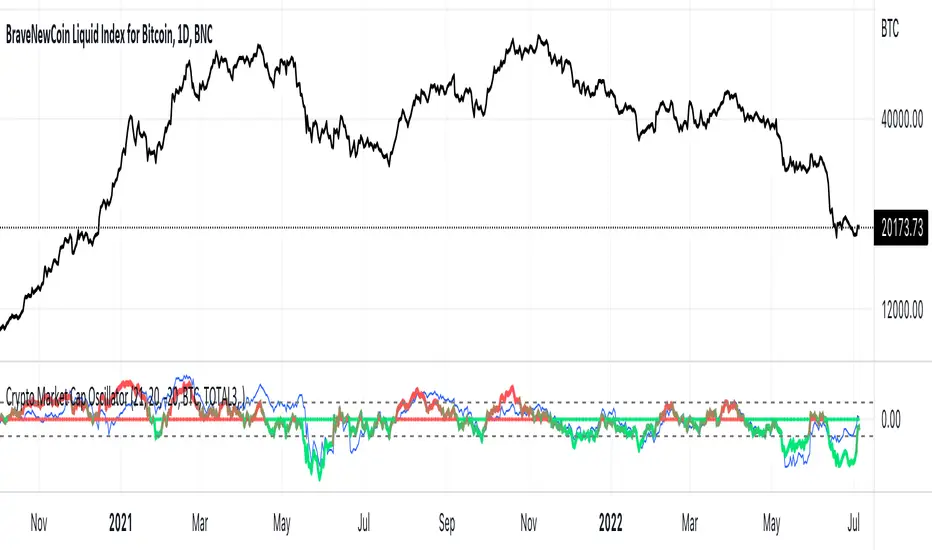
Crypto Market Cap Oscillatorthis oscillator gives helps you to select the right buy or sell moment based on the market cap of the token of your choice
It is based on a base 100 oscillator
Black plot is BTC marketcap
Gray plot is total ALT marketcap
Coloured is based on the coin of your choice
The greener the plot, the best buy opportunity
The more red the plot, the best sell opportunity
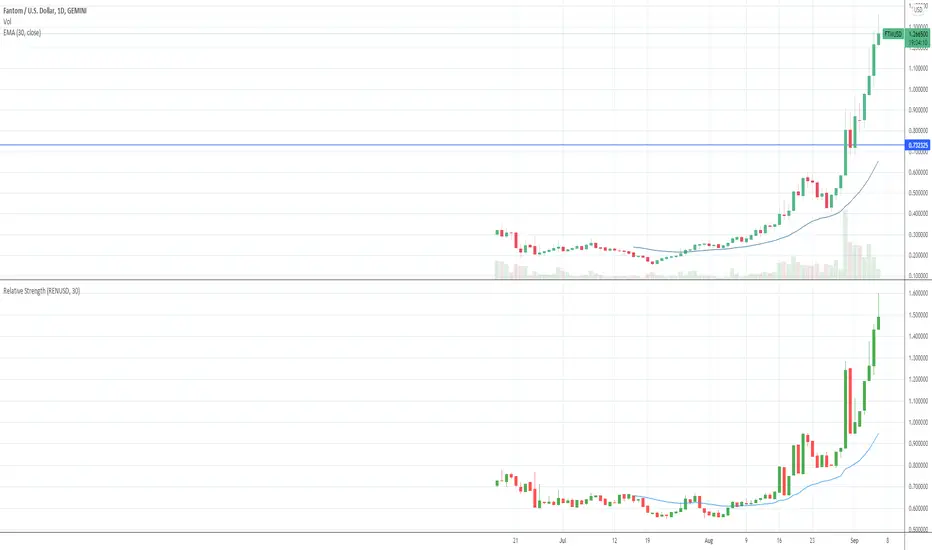
Crypto Relative StrengthIndicator meant for crypto markets. Computes the relative strength of the current ticker against a target ticker and plots a candlestick chart. Also, plots an exponential moving average of the relative strength.
Crypto Total Market Cap, Exclude Tether, (USD)Total cryptocurrency market capitalization without tether, with alerts for chosen value thresholds.
The rationale is that tether is a printed supply stable coin with a fixed value; there is no need to include its value in a combined market cap. It's debatable if that's true, but that doesn't explain what this indicator is.
The second part of this indicator is highlighted when the aforementioned adjusted market cap is above or below certain values. They are round numbers; a psychological factor. A psyop, if you will.
Options to configure are the lower and upper bound and colors. The alerts must be manually turned on, as usual.

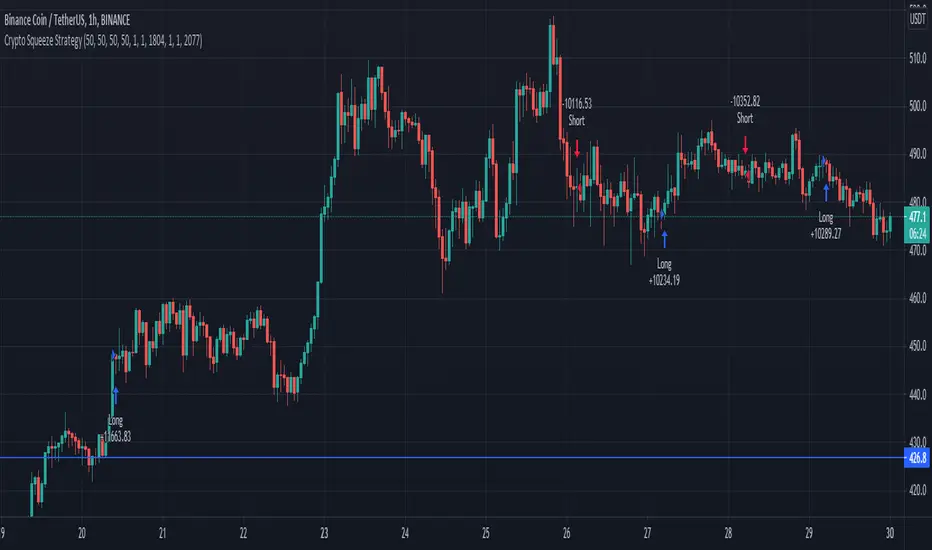
Crypto Squeeze StrategyThis strategy was inspired by two famous Trading View contributors. Shout out to Lazy Bear and Crypto Face!
The strategy includes a similar replication of the blue wave, and MFI indicator. The point of the strategy is to buy when the blue wave crosses up the zero value, and the MFI is greater than zero value. This indicates that there is strong bullish momentum and money flowing into the market.
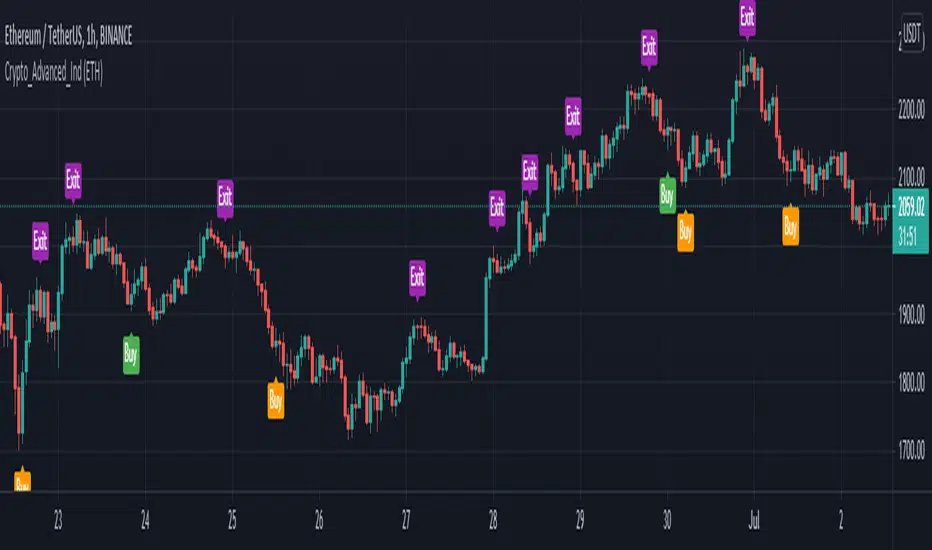
Crypto Advanced Trading IndicatorThe Crypto Indicator gives you a true picture of the market entry points, after a scan it does every period (after every candlestick closes) . It is pretty straightforward in its use with clear visual representation of the entry and exit points provided by the indicator.
This allows you to make improved entry and exit points and accommodates many trading styles, systems, and strategies.
It will work along most TradingView indicators and the timeframes we recommend you using it in are the 1H and sometimes the 4H chart.
The specific components of the indicator are:
Methodology:
The indicator uses a MACD oscillator to determine the local trend direction and to give buy & exit signals when its conditions are met.
An optional TradingView indicator, exponential moving average cross (EMA cross), can be used to filter out 'false' signals.
The calculation of the entry points are drawn from specific different prices for every one of the coins hardcoded in the script, and the filter function in the indicator settings, allows the user to change those prices based on the coin he is currently watching, based on the specific coin it is chosen in the filter.
Persistent variables are used for buy and exit prices, enabling color-coding of the signals (profitable or not).
Features:
Color coded labels - Buy, Exit = purple
Two types of entries - Bull Buy = green, Bear Buy = orange
Coin filter
Buy signal alerts
Remarks:
In our experience and therefore recommendation, the values used for each crypto coin work best on the 1-Hour timeframe. We encourage everyone to experiment, but the best results we had, were on this specific timeframe or higher.
Using the indicator on non-standard charts (Heikin Ashi, Renko etc.) can produce unrealistic results.
- Thanks to John Aslanis and Alexandros Temelkou the idealists and creators of this indicator.
Use the link below to watch a tutorial video, request a trial, or purchase for access:
Crypto EMA Trend Reversal StrategyThis is an EMA crossover strategy which involves 5 EMAs to trigger trades. The strategy has two take profit settings and uses a stop loss.
TP1 and SL are based on ATR and TP2 is an EMA crossover.
The strategy goes both long and short and the default settings work particularly well as a scalping strategy for ETHUSDT on the 5M time frame.
I have also created another version with tweaked settings for scalping LINKUSDT on the 5M with very similar results.
There is an option to add a volume condition parameter within the script on lines 26-28 which can be added to the end of lines 34-35 in the following format: and vol_cond
I personally don't currently use the volume condition parameter.

Crypto RSI Oscillator [marksc]This is my main indicator of pricing trend reversals.
It consists of two main indicators:
1. The green/red oscillator shows a general rising (green) or falling (red) price trend over a smoothed average of a number of periods (length).
2. The yellow "OverUnder Line" shows the Relative Strength Index adjusted price trend in real time.
How to use it:
- You will need to adjust the Overbought and Underbought (green and red) horizontal lines such that the yellow line rarely peaks past them. This will depend on historical data and the time-scale you're using. So if you configure it on a 15minute timescale and then switch to hourly the lines will need-readjusted. This is because the yellow line's movement is "Relative" to a number of periods of time in the timescale.
Predicting Pricing Reversals:
Adjust the Overbought and Underbought lines such that, in the past, the yellow line has rarely peaked over or under them.
When the yellow line peaks over or under one of the Over/Underbought lines again the price will likely make a strong reversal.
(Conversely, if the yellow line is not peaking but staying mostly flat or only slightly angled then the pricing trend is likely to continue.)
Predicting "Pump and Dumps":
If the price makes a sharp reversal while the yellow line was far from the over/underbought lines (ie. the yellow line was near the center), this indicates that a larger purchase or sale than has happened in a long time just happened. In most cases the price will quickly correct back to where it was because this sharp price reversal was was abnormal over the length*period used in the RSI calculation.

Crypto momentum strategyThis strategy is based on LazyBear's Squeeze Momentum indicator. It analyzes when the trend in the momentum is shifting, locating the peaks and the valleys, and takes those as sell and buy signals respectively. This is a long strategy, so it also takes into consideration the 50 period Exponential Moving Average to identify upward trends. If the closing price of the candle is above the 50EMA, and the slope of the 50EMA is trending upwards, then the buy signal is executed. If these conditions are not met, the buy signal is ignored.
This strategy works well with crypto trading on the day/week charts.
It has a profit ratio of 4:1 on average, and roughly half of the trades are profitable.

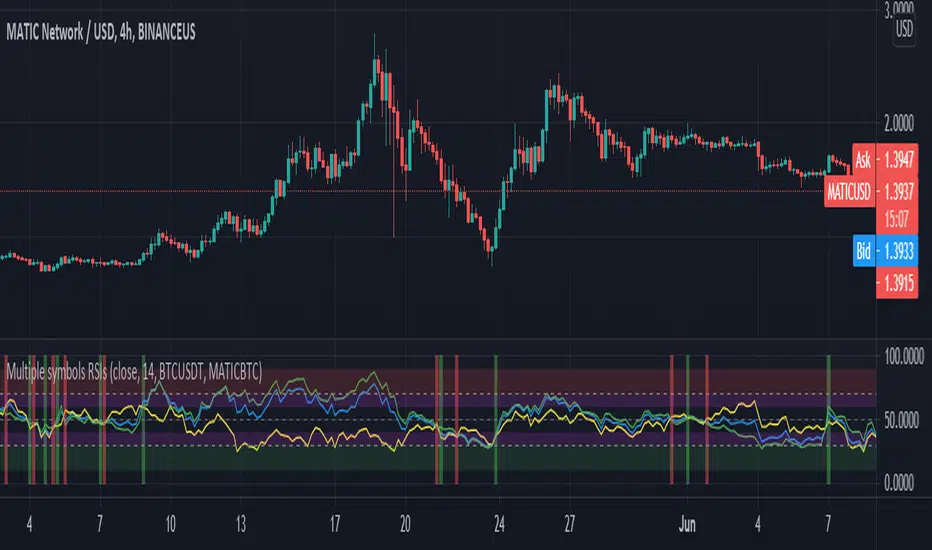
Crypto Tripple RSIGives an ability to compare 3 RSIs:
current altcoin + BTC (e.g. ADABTC) - green by default
current pair (e.g. ADAUSDT) - blue by default
BTC (e.g. BTCUSDT) - yellow by default
It helps to understand the cause of price change - whether BTC provokes price change or not. Also it shows performance of an altcoin - the bigger gaps between RSIs, the stronger (RSI of BTC is on the bottom)/ weaker (RSI of BTC is on the top) altcoin is.