Cryptohopper ATRThe Cryptohopper ATR analyses the volatility of the asset. When the market is rather ranging, the volatility remains low and the ATR line decreases . However, when the market starts moving quickly in one direction, doesn’t matter if it’s up or down, the ATR will start rising.
It can be a very good indicator to spot when the big investors are entering the market to buy or sell.
We have added a moving average of the ATR line to generate signals. In this way, when volume starts flooding the market and the volatility peaks, the ATR line will rise above its moving average. Likewise, when the volatility falls and the market ranges, the ATR line will fall below its moving average.
Last but not least , unlike with other indicators, the ATR does not generate buy or sell signals since it measures the volatility of the market. Therefore, the price can be going up or down.
Then, how can you use this indicator in your automated strategy? It can be described as a volatility filter . When the ATR line goes above the moving average, the market is more volatile and the price is moving, then the ATR will let another indicator(s) to give a buy or sell signal. However, when the volatility is low and the price is ranging, the ATR is below its moving average, and it won’t let another indicator(s) to give any buy or signal.
Therefore, it filters out trades when the market volatility is low and the price doesn’t move much and let your strategy trade when the market is volatile and the price is trending.
--
As you can see in the chart, when the ATR line (orange line) is below the blue line, the price is not volatile and it is likely to be ranging. On the other hand, when the ATR line is above the blue one, the volatility of the market is increasing, which means that the price is initiating a new trade and there will be more trading opportunities.
"crypto" için komut dosyalarını ara

Cryptohopper OBVCryptohopper is an automated trading platform where you can automate your strategy based on technical indicators and candlestick patterns. OBV is one the indicators that you can automate with Cryptohopper.
How can you automate it? OBV gives a Buy signal when the OBV value crosses up its moving average (default: EMA) and a Sell signal when it crosses down its moving average.
If you include volume analyses in your trading strategy, automating OBV will give buy signals whenever volume and price are rising altogether.
Start automating your trading in Cryptohopper.com
--CRYPTOHOPPER--

Crypto Trading Helper - by @cryptomrdavisI was looking for a strategy on TradingView that can send me signals when i have to buy or sell.
The most strategys/indicators that i found where only paid once, so i decided to create my own.
Now, a few weeks later i can share it with you and this one is completely FREE.
Features:
Buy / sell signals
Take profit - default 5%, 10% & 15%
Fibonacci included
Set alerts (buy/sell, tp1, tp2 & tp3)
more to come
For now i recommend to use it on higher timeframes.
Happy trading!
Regards,
CryptoMrDavis
*** use this tool on your own risk ***
--------------------------------------------------------------------------------------------------------
BTC: 1AxLVKpgYjMtQtcRmeuFbhQNVKWKmJ5EZy
ETH: 0x7b825fa752b9926D3E8397cDb1d9E5473D074646
XLM GAXUQJSW55C7MAC4GI26NZUGIKSHFDVFRFKZCXPLMPY4HCADSDT55XK6
BCH: qz57n04ud6mn42u00aymqkku8tfh0lk4jv9c28mjvv
--------------------------------------------------------------------------------------------------------

Crypto Scalper by CryptoTradeSignalsThe Crypto Scalper Signal makes day trading easier. This signal automatically identifies when to “buy” and “sell” your crypto, allowing you to advantage of the volatility in the market to make profits.

Crypto Scalper by CryptoTradingSignalsThe Crypto Scalper Signal makes day trading easier. This signal automatically identifies when to “buy” and “sell” your crypto, allowing you to advantage of the volatility in the market to make profits.

Crypto Bottom Signal by CryptoTradeSignalsIdentify the bottom of the market with this trading signal. When used in combination with the “Crypto Scalper Signal”, identifying the best points to “buy in” now becomes possible.

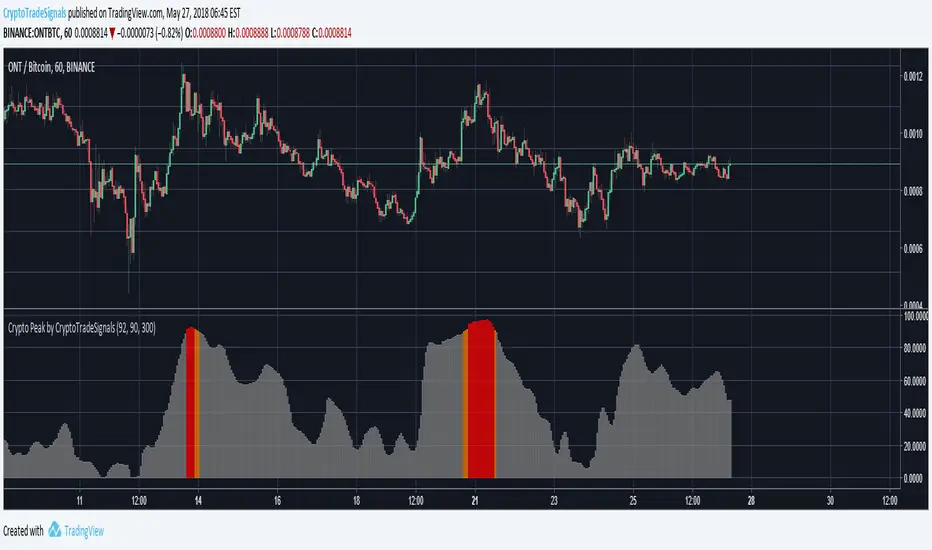
Crypto Peak by CryptoTradeSignalsRelease Notes:
1. AUTOMATED ALERTS: Staring at your phone all day? Get "Crypto Peak" alerts via email or via SMS (requires TradingView PRO Subscription).
2. CRYPTO PEAK SIGNAL: Not sure if a crypto has reached it’s “high point”? Identify the top of the market with this trading signal. When used in combination with the “Crypto Bottom Signal”, identifying the best points to “buy in” now becomes possible.
>>Get access to our Crypto Trading Indicators by visiting our website (please go to my main profile page or check the my signature)<<
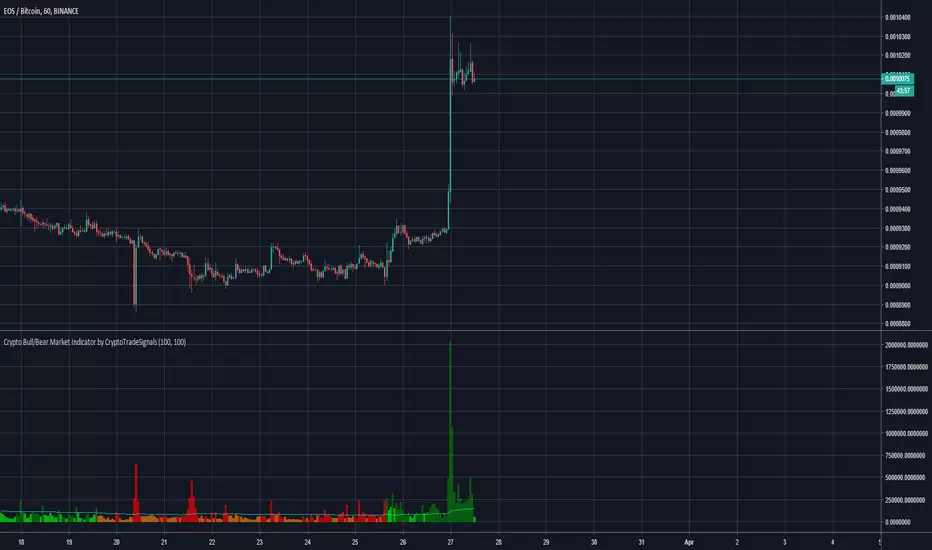
Crypto Bull/Bear Market Indicator by CryptoTradeSignalsHave you ever struggled to identify the sentiment of the crypto market?
With the "Crypto Bull/Bear Market Indicator by CryptoTradeSIgnals" you can easily determine whether markets are “bullish” or “bearish".
Features
Combines price and volume algorithms to easily identify market sell offs or strong buying activity.
Synergises with with Crypto Peak and Crypto Bottom indicators to better identify ENTRY and EXIT points for your trades.
Complete REWRITE of the pre-existing Crypto Bull/Bear Signal which provides better visual cues to understand market activity.
>>Get access to our Crypto Trading Indicators by visiting our website (please go to my main profile page or check the my signature)<<
Crypto Performance Index1. The Crypto Performance Index (CPI) estimates the price appreciation of a crypto asset relative to the overall crypto market performance. The indicator is calculated using a Sharpe Ratio principle enhanced with time-domain normalization and cumulative parametrization.
2. The CPI is based on the idea that the performance of an asset should be evaluated not only in terms of its absolute price movement, but also in terms of its risk-adjusted returns compared to the broader market. The Sharpe Ratio, which takes into account both the asset's return and its volatility, is a commonly used measure of risk-adjusted performance.
3. The CPI takes the Sharpe Ratio principle further by incorporating a time-domain normalization technique that adjusts for differences in volatility across different time periods. The cumulative parametrization ensures that the CPI considers the overall performance of the asset over a specified period of time.
4. To use the indicator, select a timeframe and set the standard deviation period (default is 20). The CPI line can be compared against various market benchmarks, including the total crypto market cap (white line), altcoins total market cap (blue line), low-cap altcoins (without ETH), and Bitcoin.
5. An upward slope of the CPI line indicates strong price performance of an asset, with a relatively high chance for the asset to continue growing faster than the market in the future. Conversely, a downward slope of the CPI line indicates weak price performance of an asset, with a relatively high chance for the asset to depreciate in price with respect to the rest of the market in the future.
6. Overall, the CPI provides a comprehensive measure of an asset's price performance, taking into account both its absolute return and its risk-adjusted return relative to the broader market. This makes it a valuable tool for investors looking to evaluate the performance of their crypto holdings and make informed decisions about buying, selling, or holding assets.

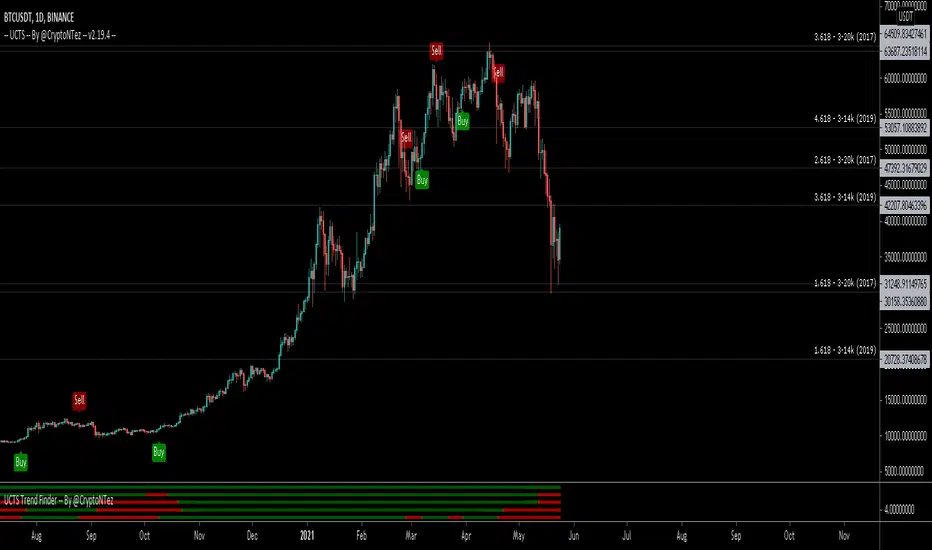
UCTS Trend Finder -- By @CryptoNTezUCTS Trend Finder is an additional feature of the well known UCTS Indicator
Easy and profitable strategy optimized for Crypto.
This script will plot green or red colors based on the UCTS Signals on different timeframes.
The script is optimized to catch trend movements as soon as possible and maximize profitability.
If you want access send me a PM on Tradingview or a DM in twitter @CryptoNTez.
Best regards and happy trading.
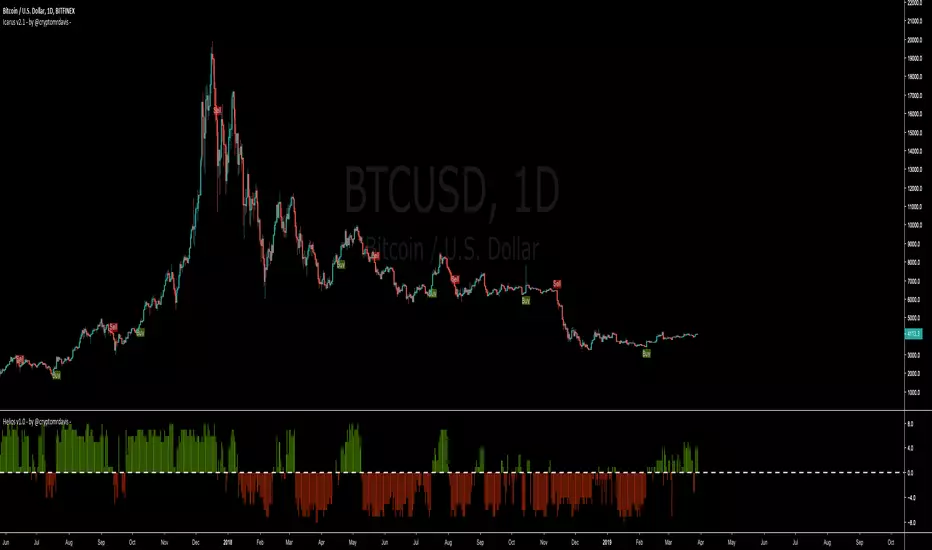
Helios v1.0 - by @cryptomrdavis -1.0
This is another indicator for you guys. From different indicators its get the signals and combines them into one.
Green marks an uptrend and red an downtrend.
Happy trading
+++ use this tool on your own risk. i'm not responsible for your loses. DYOR +++
____________________________________________________________________________
BTC: 1GVRDK3HHr9CKM5SF2CGpCNXFuavB3L4j9
ETH: 0x7b825fa752b9926D3E8397cDb1d9E5473D074646
XMR: 41zL2SQS7zyZmwXKng2TeUWsMi5vMmkgSdDCjULUTvM6ichwm1E2ZDEYGt56zk9ghoM9bekhjycSwa8amtTcB2JiUet5jtg
NEO: AXja5xPDhczfm2ujHyBfpkQAAnMsXsazmb
TRX: THi1L1v2wHJxmQg6Wk9TgkKLcP6x2oMAwf
ZEC: zcZzFkRx95cp7MtuW8wLhC5zz5RYF9QkT2uPPmhZZHc6ppXepHGgCSeAS1rtD6WFdqsM5p1gZm2gfirnrnviucsdP4aCpqU
XLM: GAXUQJSW55C7MAC4GI26NZUGIKSHFDVFRFKZCXPLMPY4HCADSDT55XK6
WAVES: 3PCMkNpMHxSraTCkwV1ENcBKa9sXbVCGjQX
BCH: qz57n04ud6mn42u00aymqkku8tfh0lk4jv9c28mjvv
tippin.me
____________________________________________________________________________

Icarus v2 [STRATEGY] - by @cryptomrdavis -This is the strategy version from the Icarus v2 indicator
Happy trading
+++ use this tool on your own risk. i'm not responsible for your loses. DYOR +++
____________________________________________________________________________
BTC: 1GVRDK3HHr9CKM5SF2CGpCNXFuavB3L4j9
ETH: 0x7b825fa752b9926D3E8397cDb1d9E5473D074646
XLM: GAXUQJSW55C7MAC4GI26NZUGIKSHFDVFRFKZCXPLMPY4HCADSDT55XK6
BCH: qz57n04ud6mn42u00aymqkku8tfh0lk4jv9c28mjvv
tippin.me
____________________________________________________________________________

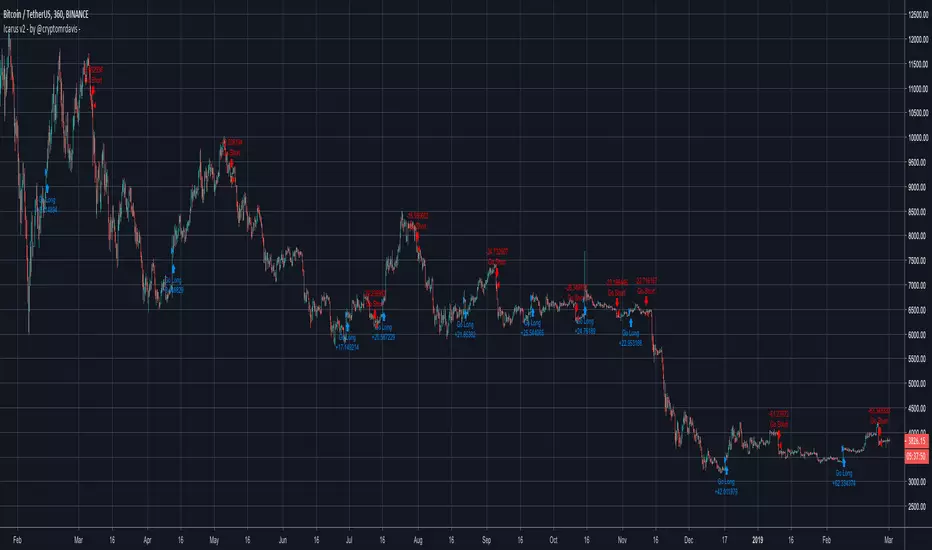
Icarus v2 - by @cryptomrdavis -This is the second version of this indicator. Now you have the ability to find the perfect settings for your asset. Just play around with those settings and if you find good ones, don't hesitate to share it with us.
Buy / Sell Signals will be plotted only once until the signal for open/close appears.
Reduce the noise with the ADX settings but there is still more room for better signals.
Catches most of the biggest moves quick but in the sideways they are still to much noise. Need to improve that. If you have some ideas just get at me.
Hope this tool is useful for you guys
Happy trading
+++ use this tool on your own risk. i'm not responsible for your loses. DYOR +++
____________________________________________________________________________
BTC: 1GVRDK3HHr9CKM5SF2CGpCNXFuavB3L4j9
ETH: 0x7b825fa752b9926D3E8397cDb1d9E5473D074646
XLM: GAXUQJSW55C7MAC4GI26NZUGIKSHFDVFRFKZCXPLMPY4HCADSDT55XK6
BCH: qz57n04ud6mn42u00aymqkku8tfh0lk4jv9c28mjvv
tippin.me
____________________________________________________________________________
Icarus - by @cryptomrdavis -this indicator plots green and red triangles under or above a bar to show you, when you should buy or sell.
if you use it with the crypto trading helper you can find better entry or exit points.
try it out and let me know what you think. there is no repaint , plots only on candle close.
will improve this script with single buy & sell signals and add some alerts. don't know why its not working on this script with just one entry position..

Trend Direction v1 - by @cryptomrdavis -This little script helps you to get the right trend. It use two RSI - 1. current chart 2. total market cap.
Simple to use:
Blue line cross the orange line = bullish
Orange line cross the blue line = bearish
You can trade it that way or you wait for the bullish cross and sell it, when the line cross under 70 (or higher, depends on which levels you set).
Combine it with the Crypto Trading Helper to find better long or short positions.
This script doesn't plot any lines or buy signals.
Happy trading!
Regards,
CryptoMrDavis
*** use this tool on your own risk ***
--------------------------------------------------------------------------------------------------------
BTC: 1AxLVKpgYjMtQtcRmeuFbhQNVKWKmJ5EZy
ETH: 0x7b825fa752b9926D3E8397cDb1d9E5473D074646
XLM GAXUQJSW55C7MAC4GI26NZUGIKSHFDVFRFKZCXPLMPY4HCADSDT55XK6
BCH: qz57n04ud6mn42u00aymqkku8tfh0lk4jv9c28mjvv
--------------------------------------------------------------------------------------------------------

-- Ultimate Crypto Trading Strategy -- Backtesting version** This is the backtesting (strategy) version of the ~ Ultimate Crypto Trading Strategy ~ script in TradingView. **
~ Ultimate Crypto Trading Strategy ~
֎ Trading system script on @tradingview that brings the easiest approach to trading with a high profitability rate
֎ Optimized for crypto markets, to catch trend movements as soon as possible and maximize profitability
֎ Sell & Buy alerts, Safeguard mode, Take Profits alerts, auto resistance-support and always adding new features!
֎ Customizable settings.
֎ Users Discord community for learning, sharing and direct support
֎ Ultimate Crypto Trading Strategy Tutorial Video: www.youtube.com www.youtube.com
֎ Safeguard feature (match multiple timeframes signals) explained: youtu.be youtu.be
If you’d like to test the trading script in TradingView, I can give you access to a 10 days trial.
Please send me a message in tradingview and I’ll activate it right away.
Thank you!

Munich -- By @CryptoNTezMunich is a new tool for Crypto and other markets that brings the easiest approach to trading with a high profitability rate
Trend direction of the market plus other indicators that allow the script to print different signals with top accuracy
Munich will handle Short and Long signals plus signals of where to close them.
Optimized for crypto markets, to catch trend movements as soon as possible and maximize profitability
The Script does not repaint (just in case you wonder...) and access to it will be available in my website CryptoNTez.com

-- Ultimate Crypto Trading Strategy -- By @CryptoNTez -- Ultimate EMA Cross Strategy. Easy and profitable strategy optimized for Crypto.
This script will signal Long and Exit signals on different timeframes based on different indicators using HA candles
The script is optimized to catch trend movements as soon as possible and maximize profitability.
Check the Strategy tester results. 92% Profitable on BTC Daily scale...
If you want access send me a PM on Tradingview or a DM in twitter @CryptoNTez.
Best regards and happy trading.

Crypto Fox Alert of Ann Strategy No RepaintHello traders
This is (( sirolf's ANN Indicator)) i updated it to (( No Repaint Version )) and it still have very good results
The new in strategy : -
1 - The Indicatoris no repaint now in any time frame
2- Now Indicatorhave two time frames which make you control strategy in entry and exit positions and you can change it as you want .
3- I recommended so much working in 5 min time frame and 15 min time frame to get the best results
but in the same time the Indicator is working in all time frames this just my advice for traders
4- I recommend so much using take profit and stop loss to avoid huge movements in markets
Notes.
--This Indicator Never Ever Repaint so it based on no repaint parameters.
--When using this alert you must notice this points :
1 - when you but the alert in the chart you will get this message :
( this indicator may be repaint ) and this for using time frame but this normal and dont worry of that
the indicator will never repaint .
2 - ( BUY) this the choice for enter long position .
3 - ( SELL) this the second choice you can use it to enter short position or exit long position .
4 - ( per bar close ) you must always use this option in alert conditions page .

Crypto Fox ANN Strategy No RepaintHello traders
This is (( sirolf's ANN Strategy )) i updated it to (( No Repaint Version )) and it still have very good results
The new in strategy : -
1 - The strategy is no repaint now in any time frame
2- Now Strategy have two time frames which make you control strategy in entry and exit positions and you can change it as you want .
3 - Added Back Test range to check Back test results
4 - Strategy is working in 10 % of equity and you can change it as you want .
5- I recommended so much working in 5 min time frame and 15 min time frame to get the best results
but in the same time the strategy is working in all time frames this just my advice for traders
6- I recommend so much using take profit and stop loss to avoid huge movements in markets

CRYPTOOOFOX (Scalping System)---DESCRIPTION---
How Strategy Work :
--This strategy is for scalping and also using confirmation when higher > highest time frame .
--The main indicator in this strategy is built on movement high and low so this indicator is belong to
the chart price and movement and you can make profit in any chart as you want
--Strategy is working on higher time frame so i use two high time frames .
the higher is ( 8 H ) and the highest is ( Daily ) Time frame .
-- When the higher time frame cross over the Daily time frame( the Highest ) this mean
the TREND and the PRICE also going UP this strategy is going to start working between the high and low buy in low .
-- When the higher time frame cross under Daily time frame( the Highest ) this mean the TREND and
the PRICE also going down and it will sell in high ( close position ) .
--Strategy is working only in Long position i am not recommend to use it in short positions .
--THIS IS NO REPAINT STRATEGY .
--This strategy is working in 10 % of equity and you can change it as you want .
--I recommend so mush to use 5 min time frame for low draw down
--I recommend so mush to use take profit and stop loss although the low draw down but some time
the market have a huge movements .
--This strategy have setting of movement for every chart and every price and movement so i will
comment the settings for every chart in forex and crypto and also stock markets

Crypto Signals - by @cryptomrdavis - [BETA]Working on some new algorithms to get the best results while trading. For now the signals are solid but there is still to much noise - need to reduce it.
When the noise is gone, this will be a very simple but effective indicator.
More examples
