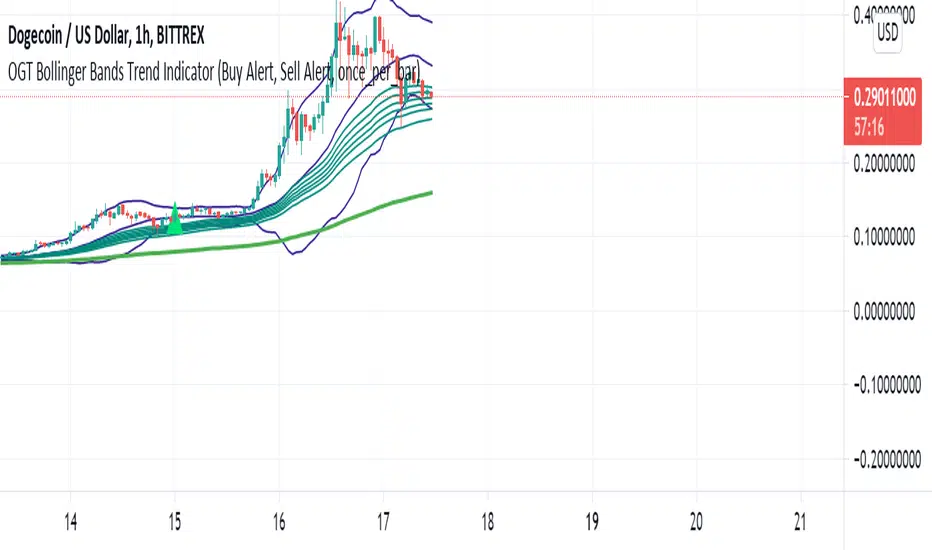
OGT Bollinger Bands Trend IndicatorWhat Is The OGT Bollinger Bands Trend Indicator?
This indicator is a pullback trend trading indicator which uses the following indicators:
- 200 EMA - Long Term Trend Direction
- 30, 35, 40, 45, 50, 60 EMAs - Shorter Term Trend Direction
- Bollinger Bands - Pullback / Entry Signal
How Are Signals Generated?
Buy
- Price above the 200 EMA
- Price touches lower BB with shorter term EMAs all aligned (not crossed)
- Indicator waits for price to close above midpoint BB with shorter term EMAs all still aligned (not crossed)
Sell
- Price below the 200 EMA
- Price touches upper BB with shorter term EMAs all aligned (not crossed)
- Indicator waits for price to close above midpoint BB with shorter term EMAs all still aligned (not crossed)
Alerts function built in, input settings customisable to show/not show indicators and change colours.
Komut dosyalarını "bollingerband" için ara
Beacon - Anthony Crudele's IndicatorBeacon uses the current volatility of the market based on your trading time frame to determine support and resistance levels, whether a trend is intact or ready to revert back in the range. One of the most difficult things I went through as a trader was determining whether we are in a trend day or if we are in grind up or grind down mode. I created Beacon to give me a simple look at the market to determine what type of environment we are in. I use Bollinger Bands (3 standard deviation) to determine the volatility cycle. Once the BB make peaks I took my Fibonacci Retracement tool and did a retracement from the peak high of the BB to the peak low. I use 70%, 50% and 30% for my support and resistance levels. I use those levels because I tested pretty much every percent level and those percentages averaged the highest performance on all tick charts and time charts. You can use Beacon on whatever time frame or tick chart you are trading on and it will determine that specific volatility cycle.

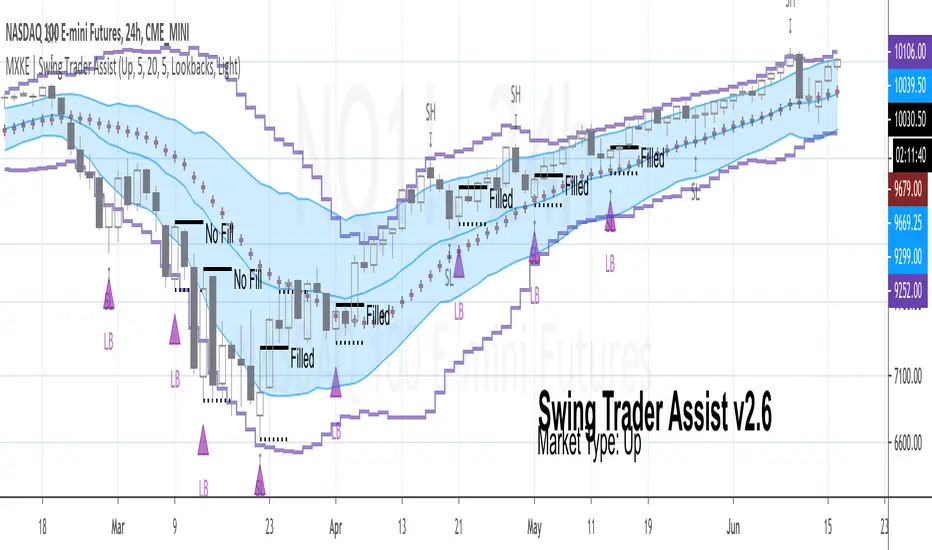
MXKE | Swing Trader AssistIntroduction
Swing Trader Assist indicator is designed to assist in the systematic identification of Hammers & Lookback signals within Uptrending markets, Stars & Lookback signals within Downtrending markets, and Mean Reversion signals within Sideways markets. The trader must first identify a strong market trend, then apply the indicator. Application of the indicator to weak trends will render equally weak signals. Application of the indicator to strong trends will render equally strong signals. Identification of strong trends is the responsibility of the individual trader and is instrumental to the successful deployment of this indicator and accompanying trading plan.
*Please comment below to request access*
*Please share with me on Twitter your usage and/or ideas for improvement so that I may improve this indicator in the future*
Market Types
Uptrend: Higher highs + Higher lows
Downtrend: Lower highs + Lower lows
Sideways: Higher highs + Lower lows (Expanding Range) or Lower highs + Higher lows (Narrowing Range)
Position Sizing
1R = .25%-2% of total nominal capital dependent upon timeframe and risk appetite
Order Types
Entry: Buy Stop 1 tick above High of “Up” Signal Bars; Sell Stop 1 tick below Low of “Down” Signal Bars
Stop: Bar Close <= 1 tick below Low of “Up” Signal Bar; Bar Close >= 1 tick above High of “Down” Signal Bar
Profit Target: 1.5R distance from “Up” or “Down” fill level with the option to trail stop on each new swing high/low; Bollinger Band Midline minimum 1.5R distance from “Sideways” fill level with option to trail stop on continuation to the opposite end of the range (opposite Bollinger Band)
Trading Plan
❑ Market Type is clearly identifiable as Up, Down or Sideways
❑ Swing Trader Assist indicator is set to the corresponding Market Type: Up, Down or Sideways
❑ Position size is no more than .25%-2% of total nominal capital (based on distance from Signal Bar fill level to Signal Bar stop level as 1R)
❑ Distance from Signal Bar fill level to potential Profit Target is minimum 1.5R
❑ On Hammer or Star fill: close position into trend extension at 1.5R+ or adjust trailing stop on each new swing high/low
❑ On Mean Reversion fill: close position at midline or adjust trailing stop on each continuation to opposite end of range
Usage Notes
The indicator will display developing signals intrabar and it is therefore suggested to wait until bar close to act on any signals. “Autodetect” setting under “Market Type” is currently in beta mode. While it is designed to reveal only relevant signals within strong trends based on a series of EMAs, this setting has not been extensively tested. Use with caution.
The indicator is not meant to be a mechanical trading system. It is designed to assist the trader in objectively and systematically identifying signal bars during the execution of the below swing trading plan. It is up to the trader to determine if overall price action warrants acting upon the signal bars or not.
Case Studies


MasterPiece (by LittleJoo) v1.0Bu komut yalnız ve yalnızca , XBT-USD (Bitmex : Bitcoin USD Perpetual Inverse Swap Contrat) Grafiği , 15 Dakikalık zaman diliminde çalışmaktadır. Farklı zaman dilimi için değerlerin değiştirilmesi gerekmektedir. Indikatörüm geliştirme aşamasındadır. Bu yalnız deneme amaçlı paylaşılmış sürümüdür. Güncellemeye ve paylaşmaya devam edeceğim.
Indikatörlerle trade büyük risk içerir. Ben bunu grafiklerimi onaylamak veya stop belirlemek için kullanıyorum. Denemek istiyor iseniz , ya küçük miktarla ile işlem açın yada tradingview paper trade bölümünde deneyin.
Indikatörün doğru sinyalleri yanlış sinyallerinden fazladır. Yani yanlış sinyalleri de olabilir. Kullanımı sonucunda edeceğiniz maddi zararlardan sorumlu değilim.

Calendar's Bollinger BandsHI guys, I'm Calendar
I made my 2nd indicator for my followers.
This indicator made by merging 2 Bollinger Bands.(SDV =1, 2)

Bollinger Band Open Gap Alert V1This is the bare bones of what I'm trying to achieve through pine script. The purpose of the script is to:
1. On a 15m chart, calculate and plot upper & lower Bollinger bands and simple moving average of 20 periods. (DONE)
2. On a new day, when the first 15m candle of a session forms, I want to check if a) the low of the new candle is outside the upper Bollinger band (also known as an open gap up) or b) if the high of the candle is the outside the lower Bollinger band (also known as open gap down). In other words, I want to know if the Bollinger Bands are not touching the new candle's wicks/shadows. (DONE)
3. Alert me if the above happens. (DONE)
4. Run the indicator through an entire watch list. I'm not sure if that's possible, yet. (HELP)
For the above job, this is what I could come up with. I need guidance for the last step . And any suggestions for corrections or improvements would be greatly appreciated!
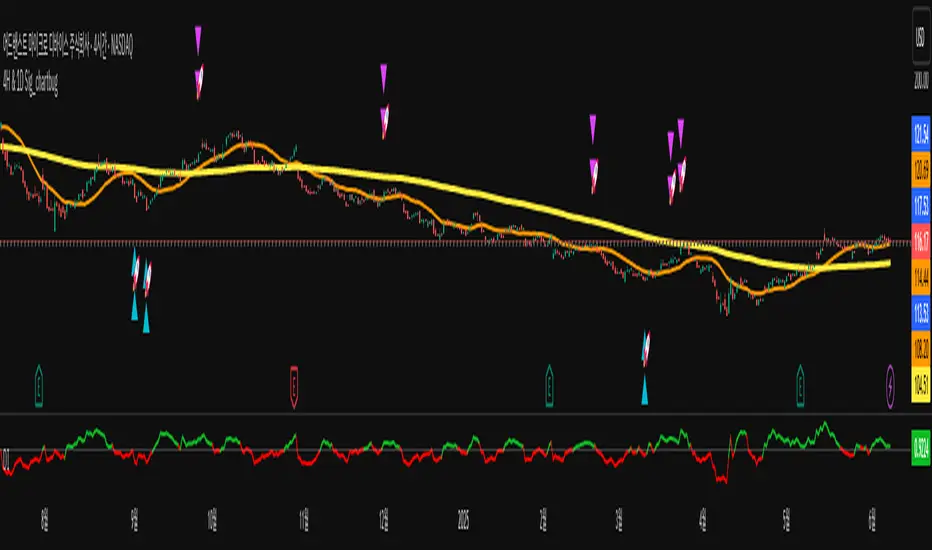
4H & 1D Sig_chartbugRohmoohyun is alive
Auxiliary Indicator for Buy/Sell Signals Using Bollinger Bands and Moving Averages.
Recommended for NASDAQ, Gold, Oil, BTC, Stocks on 4-hour or higher timeframes.
For Ethereum, Ripple, and other volatile altcoins, it is advisable to also check the daily chart.
Indicator Idea: This strategy utilizes two types of indicators: Bollinger Bands as a volatility (or momentum) indicator, and Moving Averages as a trend indicator. A triangle signal is generated in zones where the Bollinger Bands converge (squeeze). After a candle closes, a Rocket icon will appear, at which point a trading strategy can be devised based on the prevailing trend indicated by the Moving Averages.
Indicator Feature: When used on timeframes of 4 hours or higher, this indicator is extremely powerful for establishing trading criteria, especially when combined with trend analysis and support/resistance zones.
Basic Trading Method: Enter a position at the Rocket icon + Immediately set a stop-loss (e.g., at the previous low/high, a maximum loss threshold like 2% of capital, or at a level planned for a second entry to average down) + Take partial profit (e.g., 50%) at your desired TP level, then move the stop-loss to your entry price (break-even) and hold the remainder of the position.
Recommended Timeframes: 5-minute, 4-hour, 1-day.
Trading Strategy
Pullback Trading / Trend Reversal Trading.
Instrument Selection (Commodities & Indices, Crypto, NASDAQ-listed Stocks).
Understand Instrument Characteristics (The three categories behave differently, so backtesting before use is essential).
a) Bullish Alignment (Price > 20MA > 200MA)
: Focus primarily on long (buy) positions.
: If attempting a counter-trend (short) trade, do so only with multiple confirmations, such as RSI/Disparity divergence and a major resistance zone. Use a tight stop-loss.
b) Bearish Alignment (Price < 20MA < 200MA)
: The opposite of the above; focus on short (sell) positions.
c) During a Bullish Trend, Price is Between MAs (200MA < Price < 20MA)
: This indicates either a consolidation phase within an uptrend or a potential early sign of a reversal to a downtrend. Consider both possibilities.
: A possible approach is to allocate capital with a 60% bias to long positions and a 40% bias to short positions (unlike in full bullish/bearish alignments where counter-trend trading has a poor risk/reward ratio).
: If it turns out to be a reversal point, you can enter a position at the very beginning of a new trend, allowing for a longer ride.
: It's recommended to take partial profits rather than closing the entire position. For instance, close half and move the stop-loss to your entry price to eliminate risk while keeping profit potential open.
d) During a Bearish Trend, Price is Between MAs (200MA > Price > 20MA)
: The opposite of the above.
Instrument-Specific Characteristics
Commodities & Indices (NASDAQ, Oil, Gold)
: The indicator was primarily developed and tested on NASDAQ and Gold, so it tends to work well with them.
: However, NASDAQ often exhibits strong, one-way trends, so a trend-following approach is highly recommended.
: Gold and Oil tend to have significant reversals from key support/resistance zones.
Crypto
: These assets are extremely volatile, so use this indicator with caution and skill.
: It performs reasonably well with BTC. For anything from Ethereum downwards, the price action can be chaotic, so it's crucial to use the daily chart and other confirming factors.
: Instead of frequent day trading, focus on long-term positions, reduce the number of trades, and aim for entries with a good average price.
NASDAQ-listed Stocks
: Recommended for a long-term, accumulation-style investment approach.
: Use the indicator not as a signal that "it will pump immediately!" but rather as a sign that "this is a decent entry point to build a position."
: Alternatively, it can be used for more active swing trading (buy, sell, repeat).
Important Disclaimers
This is an auxiliary indicator, as the name implies. Do not trust it blindly.
When entering a position, immediately set your stop-loss or have a plan for a single additional entry (max one recommended).
Always use it in conjunction with other forms of analysis.
Track your performance (win rate, risk/reward ratio) based on this strategy.
Continuously refine and improve your approach.
Premarket & Previous Day High/LowLines for Premarket High Low as well as Previous Day High and Low. Also adds Bollinger Bands. Colors the Bollinger Bands depending wether the Close is above or below PMH or PML

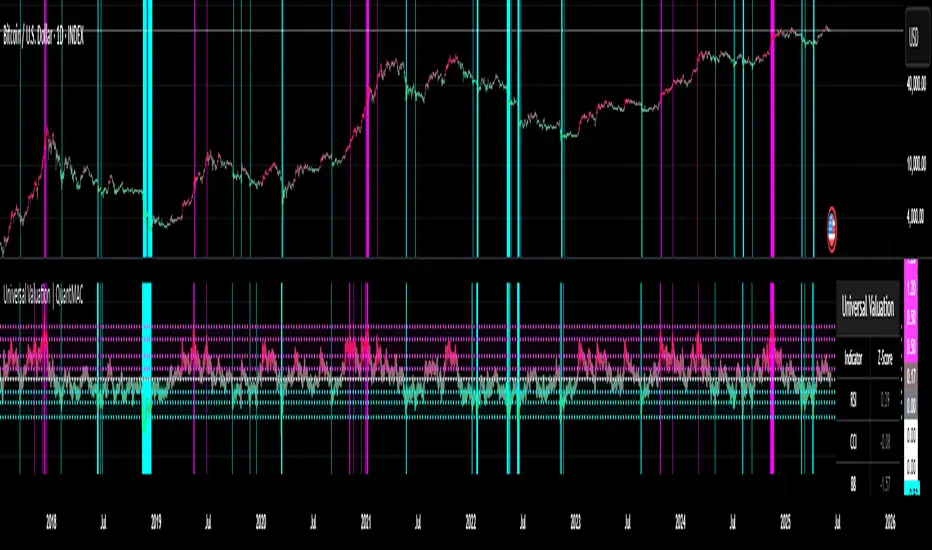
Universal Valuation | QuantMAC🎯 Universal Valuation | QuantMAC
🚀 Professional-Grade Valuation Engine with 14+ Technical Components
The Universal Valuation indicator is a sophisticated composite analysis tool that combines multiple technical indicators, statistical measures, and risk ratios to provide a comprehensive assessment of asset valuation across all market conditions and timeframes.
📊 Core Architecture & Methodology
🔬 Z-Score Normalization System
Each component is normalized using statistical Z-scores, which measure how many standard deviations a value is from its historical mean. This standardization allows different indicators to be combined meaningfully:
Positive Z-scores indicate values above historical average (potentially overvalued)
Negative Z-scores indicate values below historical average (potentially undervalued)
Individual lookback periods for each component ensure optimal sensitivity
Real-time statistical calculations with dynamic standard deviation adjustments
📈 Composite Scoring Algorithm
The final valuation score is calculated as the weighted average of all enabled components, providing a unified view of market conditions while maintaining granular control over individual inputs.
🛠️ Technical Components Breakdown
📊 Momentum & Oscillator Components
🎯 RSI (Relative Strength Index)
Function: Measures price momentum and overbought/oversold conditions
Default Settings: 21-period RSI with 150-period Z-score normalization
Analysis: Values above 70 (traditional) become positive Z-scores, indicating potential overvaluation
Edge: Z-score normalization adapts to changing market volatility unlike fixed thresholds
🌊 CCI (Commodity Channel Index)
Function: Identifies cyclical price patterns and extreme price levels
Default Settings: 30-period CCI with 150-period Z-score normalization
Analysis: Measures price deviation from statistical mean using typical price (HLC/3)
Edge: Excellent for identifying price extremes in trending and ranging markets
🔵 Chande Momentum Oscillator
Function: Advanced momentum indicator using sum of gains vs. sum of losses
Default Settings: 50-period calculation with 50-period Z-score normalization
Analysis: Formula: 100 * (Sum_Gains - Sum_Losses) / (Sum_Gains + Sum_Losses)
Edge: Less prone to whipsaws compared to RSI, better momentum persistence detection
🎭 IMI (Intraday Momentum Index)
Function: Combines RSI concept with intraday price action analysis
Default Settings: 100-period calculation with 150-period Z-score normalization
Analysis: Uses gains/losses based on close vs. open rather than close-to-close
Edge: Captures intraday sentiment and gap behavior effectively
📈 Price Action & Trend Components
📊 Bollinger Bands Position
Function: Measures price position relative to volatility-adjusted bands
Default Settings: 30-period bands with 50-period Z-score normalization
Analysis: (Price - SMA) / (2 * Standard_Deviation) normalized to Z-score
Edge: Adapts to volatility changes, providing context-aware overbought/oversold levels
💹 Price Z-Score
Function: Direct statistical analysis of price deviation from historical mean
Default Settings: 150-period lookback for Z-score calculation
Analysis: Pure price momentum without indicator lag or smoothing
Edge: Unfiltered price analysis, excellent for mean reversion strategies
📊 Disparity Index
Function: Measures percentage deviation of price from its moving average
Default Settings: 10-period SMA with 150-period Z-score normalization
Analysis: 100 * (Price - SMA) / SMA, then normalized to Z-score
Edge: Highly sensitive to short-term price deviations, excellent for timing entries
🎯 TEMA (Triple Exponential Moving Average)
Function: Advanced moving average with reduced lag and improved responsiveness
Default Settings: 10-period TEMA with 150-period Z-score normalization
Analysis: Triple-smoothed EMA that maintains trend-following capability with less noise
Edge: Superior trend identification with minimal lag compared to traditional MAs
📊 Volume & Market Structure Components
📈 VWAP (Volume Weighted Average Price)
Function: Incorporates volume into price analysis for institutional perspective
Default Settings: Standard VWAP with 300-period Z-score normalization
Analysis: Compares current price to volume-weighted institutional benchmark
Edge: Reveals institutional sentiment and identifies fair value zones
⚡ Intraday Momentum
Function: Measures session-based momentum using open-to-close movement
Default Settings: (Close - Open) / Open * 100 with 250-period Z-score normalization
Analysis: Captures daily sentiment and gap behavior in percentage terms
Edge: Excellent for intraday trading and gap analysis strategies
🎲 Advanced Statistical Components
🌊 Hurst Exponent (Optional)
Function: Measures market efficiency and trend persistence characteristics
Default Settings: 100-period calculation with 200-period Z-score normalization
Analysis: Values > 0.5 indicate trending markets, < 0.5 indicate mean-reverting markets
Edge: Identifies market regime changes and optimal strategy selection
Note: Computationally intensive, disabled by default for performance
📊 Risk-Adjusted Performance Ratios
⚡ Sharpe Ratio
Function: Risk-adjusted return measurement using total volatility
Default Settings: 400-period calculation with 120-period Z-score normalization
Analysis: (Return - Risk_Free_Rate) / Standard_Deviation of returns
Edge: Identifies periods of superior risk-adjusted performance
🎯 Sortino Ratio
Function: Risk-adjusted return using only downside deviation (superior to Sharpe)
Default Settings: 400-period calculation with 120-period Z-score normalization
Analysis: (Return - Risk_Free_Rate) / Downside_Deviation
Edge: More accurate risk assessment as it ignores upside volatility
🌟 Omega Ratio
Function: Advanced risk measure comparing gains above threshold to losses below
Default Settings: 400-period calculation with 200-period Z-score normalization
Analysis: Sum_of_Gains_Above_Threshold / Sum_of_Losses_Below_Threshold
Edge: Captures full return distribution, not just mean and variance
🎨 Visualization & Interface
🌈 Dual Color Schemes
Bright Mode: Vibrant colors for clear daylight visibility
Dark Mode: Muted tones for low-light trading environments
Adaptive Gradients: Color intensity scales with Z-score magnitude
Background Highlighting: Optional panel and chart background coloring for extreme conditions
📊 Comprehensive Data Table
Real-time Z-scores for each enabled component
Composite score with gradient coloring
Valuation phase classification (6 distinct levels)
Toggle individual components on/off for custom analysis
🎯 Valuation Phase Classifications
📈 Systematic Valuation Levels
Extremely Undervalued: Z-score ≤ -2.0 (Exceptional buying opportunity)
Strongly Undervalued: Z-score ≤ -1.3 (Strong buying signal)
Moderately Undervalued: Z-score < -0.65 (Potential buying opportunity)
Fairly Valued: Z-score -0.65 to 0.5 (Neutral zone)
Slightly Overvalued: Z-score 0.5 to 1.2 (Caution zone)
Moderately Overvalued: Z-score 1.2 to 2.0 (Potential selling zone)
Strongly Overvalued: Z-score ≥ 2.0 (Strong selling signal)
🌍 Universal Asset Compatibility
✅ Equity Markets - Individual stocks, ETFs, indices, sector rotation analysis
✅ Cryptocurrency - Bitcoin, altcoins, DeFi tokens, NFT projects
8H
12H
4H
🚀 Key Strategic Advantages
🔬 Scientific Approach
Unlike traditional indicators that use fixed thresholds, the Universal Valuation employs dynamic statistical normalization that adapts to changing market conditions and volatility regimes.
⚡ Multi-Dimensional Analysis
Combines momentum, trend, volume, and risk-adjusted metrics to provide a 360-degree view of market valuation, reducing false signals and improving decision accuracy.
🎯 Customizable Framework
Enable or disable individual components to create custom valuation models tailored to specific assets, strategies, or market conditions.
📊 Institutional-Grade Metrics
Incorporates sophisticated risk ratios (Sharpe, Sortino, Omega) typically used by hedge funds and institutional investors.
💡 Professional Trading Applications
🎯 Mean Reversion Strategies
Identify extreme valuation levels for contrarian entries
Use composite Z-score thresholds for systematic signal generation
Combine with volume analysis for confirmation
📈 Trend Following Enhancement
Avoid trend entries during overvalued conditions
Use undervalued readings to add to existing positions
Time trend continuation trades with valuation support
🔄 Portfolio Management
Asset allocation based on relative valuation scores
Risk management using integrated Sharpe/Sortino ratios
Sector rotation timing using cross-asset comparison
⚡High-Frequency Applications
Intraday momentum component for scalping strategies
VWAP analysis for institutional order flow
Real-time composite scoring for algorithmic systems
🛠️ Configuration Best Practices
📊 Conservative Setup (Long-term)
Enable all components except Hurst Exponent
Use longer Z-score periods (200+) for stability
Focus on -1.3/+2.0 thresholds for major signals
⚡ Aggressive Setup (Short-term)
Emphasize momentum components (RSI, CCI, Chande)
Shorter Z-score periods (50-100) for responsiveness
Use -0.65/+1.2 thresholds for frequent signals
🎯 Risk-Focused Setup
Prioritize Sharpe, Sortino, and Omega ratios
Enable VWAP and price components
Use conservative thresholds with position sizing guidance
---
🏆 Professional Multi-Asset Valuation System
The Universal Valuation indicator represents a quantum leap in technical analysis sophistication, combining academic rigor with practical trading applications. By normalizing diverse technical components through statistical Z-scores, it provides objective, data-driven valuation assessments that adapt to any market condition.
---
📝 Disclaimer: This indicator is for educational and informational purposes only. The statistical models and risk ratios do not guarantee future performance. Always conduct thorough analysis and implement proper risk management practices.
Bollinger Bands Oscillator | QuantMAC📊 Bollinger Bands Oscillator | QuantMAC
🎯 Overview
The Bollinger Bands Oscillator is a sophisticated technical analysis tool that combines the power of traditional Bollinger Bands with an oscillator-based approach for enhanced signal generation. This indicator transforms the classic Bollinger Bands into a percentage-based oscillator, providing clearer entry and exit signals for both trending and ranging markets.
🔧 Key Features
Dual Trading Modes : Choose between Long/Short or Long/Cash strategies
Advanced BB% Calculation : Enhanced Bollinger Band percentage with customizable multipliers
Comprehensive Metrics : Built-in performance analytics including Sharpe Ratio, Sortino Ratio, and Profit Factor
Visual Color Coding : Dynamic bar coloring and 9 different color schemes for optimal chart visibility
Date Range Filtering : Backtest specific time periods with customizable start dates
Real-time Signal Generation : Clear long and short entry signals with threshold customization
Advanced Risk Management : Half Kelly criterion calculation for optimal position sizing
📈 How It Works
The indicator operates by calculating a modified Bollinger Band percentage that oscillates between values, typically ranging from 0 to 100+. When the BB% crosses above the Long Threshold (default: 83), it generates a bullish signal. Conversely, when it crosses below the Short Threshold (default: 55), it produces a bearish signal.
Core Calculation Process:
Calculate the moving average basis using the specified Base Length (default: 40 periods)
Determine standard deviation using a separate SD Length (default: 27 periods)
Create upper and lower bands using the SD Multiplier (default: 2.6)
Convert to percentage oscillator with BB% Multiplier (default: 100)
Generate signals based on threshold crossovers
⚙️ Customizable Parameters
BMD Settings:
Base Length : Controls the moving average period (default: 40)
Standard Deviation Length : Determines volatility calculation period (default: 27)
SD Multiplier : Adjusts band width sensitivity (default: 2.6)
BB% Multiplier : Scales the oscillator values (default: 100)
Source : Choose price source (close, open, high, low, etc.)
Signal Thresholds:
Long Threshold : Entry level for bullish positions (default: 83)
Short Threshold : Entry level for bearish positions (default: 55)
🎨 Visual Elements
Main Chart Overlay:
Bollinger Bands : Upper and lower bands with customizable colors and transparency
Middle Line : Basis line displayed as subtle dots
Band Fill : Colored area between bands for easy visualization
Bar Coloring : Candles change color based on current signal state
Separate Oscillator Pane:
BB% Line : Main oscillator line with dynamic coloring
Threshold Lines : Horizontal lines marking entry/exit levels
Color Coding : Line colors change based on bullish/bearish state
📊 Performance Metrics
The indicator includes a comprehensive metrics table displaying:
Net Profit % : Total return percentage
Max Drawdown % : Maximum peak-to-trough decline
Win Rate % : Percentage of profitable trades
Profit Factor : Ratio of gross profit to gross loss
Sharpe Ratio : Risk-adjusted return measure
Sortino Ratio : Downside risk-adjusted return
Omega Ratio : Probability-weighted ratio of gains vs losses
Half Kelly % : Optimal position sizing recommendation
Total Trades : Number of completed transactions
🎯 Trading Strategies
Long/Short Mode: 🔄
The indicator alternates between long and short positions based on threshold crossovers. This mode is ideal for traders who can profit from both rising and falling markets.
Long/Cash Mode: 💰
This conservative approach only takes long positions, moving to cash during bearish signals. Perfect for traders in accounts that don't allow short selling or those preferring a buy-and-hold approach with strategic exits.
🚀 Getting Started
Add the indicator to your chart
Choose your preferred Trading Mode (Long/Short or Long/Cash)
Adjust the Base Length and SD Length to match your trading timeframe
Fine-tune the Long Threshold and Short Threshold based on your risk tolerance
Select your preferred color scheme from 9 available options
Enable the metrics table to monitor performance in real-time
💡 Pro Tips
Lower thresholds (e.g., Long: 75, Short: 60) generate more frequent but potentially less reliable signals
Higher thresholds (e.g., Long: 90, Short: 45) produce fewer but potentially higher-quality signals
Shorter base lengths make the indicator more responsive to recent price action
Longer base lengths smooth out noise but may lag market turns
Use the Half Kelly % metric to guide position sizing decisions
⚠️ Important Disclaimers
Past performance is not indicative of future results . This indicator is a technical analysis tool designed to assist in trading decisions but should not be used as the sole basis for investment choices.
Key Risk Considerations:
Market Conditions : No indicator works perfectly in all market environments
Backtesting Bias : Historical performance may not reflect future market behavior
Risk Management : Always use proper position sizing and stop-loss orders
Multiple Confirmations : Consider using additional indicators and analysis methods
📚 Educational Value
This indicator serves as an excellent learning tool for understanding:
Bollinger Band mechanics and interpretation
Oscillator-based trading strategies
Performance metrics and risk assessment
Position sizing using Kelly Criterion principles
The relationship between volatility and price movement
🔔 Updates and Support
The Bollinger Bands Oscillator | QuantMAC is regularly updated to ensure compatibility with TradingView's latest features. The code is thoroughly commented for educational purposes and transparency.
Remember: Trading involves substantial risk of loss and is not suitable for all investors. The value of investments may go down as well as up, and you may not get back the amount you invested. Always conduct your own research and consider seeking advice from a qualified financial advisor.

Mitsos4 RSI + BB + Dispersion + Trendlines + VIX Fix Mitsos4 RSI + BB + Dispersion + Trendlines + VIX Fix
This powerful custom indicator combines two analytical tools into one view:
RSI-based Bollinger Bands with Dispersion and the Vix Fix volatility spike detector.
It is designed for traders who want early volatility signals and precision RSI insights, all in a single pane.
🧩 What's Included:
✅ 1. RSI + BB (EMA) + Dispersion
RSI-Based Bollinger Bands: Tracks the RSI with Bollinger Bands using an EMA as the basis.
Dispersion Zone: A buffer zone around the moving average band for more sensitive overbought/oversold detection.
Dynamic RSI Coloring:
🟢 Green: RSI breaks above the dispersion zone.
🔴 Red: RSI breaks below the dispersion zone.
🟡 Yellow: RSI inside the zone (neutral).
Trendlines at RSI levels: 40 (green), 50 (yellow), 60 (red).
Alerts when RSI crosses dispersion zones.
✅ 2. CM_Williams_Vix_Fix
Designed to simulate VIX-like volatility spikes on non-VIX instruments.
Detects potential market bottoms by measuring price deviation from recent highs.
Includes:
Bollinger Band range on WVF.
Percentile high/low zones to detect significant volatility moves.
Histogram plot of WVF for quick visual alerts.
Color-coded spikes (green when above upper thresholds).
⚙️ User Controls:
Adjustable RSI, Bollinger Band, and dispersion settings.
Toggle options for:
Viewing high/low VIX percentiles.
Showing standard deviation bands for WVF.
Custom trendline display levels at RSI key areas.
📌 Best Use Cases:
Detect early market reversals and volatility spikes.
Combine RSI strength with volatility-based bottom signals.
Layer dispersion-based logic on top of classic RSI strategies.

MACD + RSI + EMA + BB + ATR Day Trading StrategyEntry Conditions and Signals
The strategy implements a multi-layered filtering approach to entry conditions, requiring alignment across technical indicators, timeframes, and market conditions .
Long Entry Requirements
Trend Filter: Fast EMA (9) must be above Slow EMA (21), price must be above Fast EMA, and higher timeframe must confirm uptrend
MACD Signal: MACD line crosses above signal line, indicating increasing bullish momentum
RSI Condition: RSI below 70 (not overbought) but above 40 (showing momentum)
Volume & Volatility: Current volume exceeds 1.2x 20-period average and ATR shows sufficient market movement
Time Filter: Trading occurs during optimal hours (9:30-11:30 AM ET) when market volatility is typically highest
Exit Strategies
The strategy employs multiple exit mechanisms to adapt to changing market conditions and protect profits :
Stop Loss Management
Initial Stop: Placed at 2.0x ATR from entry price, adapting to current market volatility
Trailing Stop: 1.5x ATR trailing stop that moves up (for longs) or down (for shorts) as price moves favorably
Time-Based Exits: All positions closed by end of trading day (4:00 PM ET) to avoid overnight risk
Best Practices for Implementation
Settings
Chart Setup: 5-minute timeframe for execution with 15-minute chart for trend confirmation
Session Times: Focus on 9:30-11:30 AM ET trading for highest volatility and opportunity

Dual Stochastic Enhanced (with Presets giua64)Script Title: Dual Stochastic Enhanced (with Presets giua64)
Overview:
This indicator enhances the traditional Dual Stochastic strategy, aiming to provide more filtered and potentially reliable trading signals. By integrating dynamic overbought/oversold levels via Bollinger Bands on the slow stochastic, a trend filter based on a moving average, momentum confirmation via RSI, and user-friendly selectable presets, "Dual Stochastic Enhanced" seeks to offer a more robust approach to identifying potential entry points.
Key Features:
Dual Stochastics: Utilizes a slow stochastic (configurable, e.g., 14 periods) as a context filter and a fast stochastic (configurable, e.g., 5 periods) as a signal trigger.
Bollinger Bands on Slow Stochastic: Instead of fixed overbought/oversold levels (80/20), Bollinger Bands are applied to the %K line of the slow stochastic. This creates dynamic zones that adapt to the stochastic's own volatility.
Trend Filter: A moving average (configurable type and length, e.g., EMA 100 as seen in the example chart for general context) on the price helps filter signals, allowing only trades aligned with the prevailing trend.
RSI Confirmation: An RSI oscillator (configurable length, e.g., 14 periods) is used to confirm momentum. Signals require the RSI to cross certain thresholds to validate the strength of the move.
User Presets: Includes presets for "Scalping," "Intraday," and "Swing trading," which quickly set all key parameters to suit different styles and timeframes. A "Custom" option is also available for full manual configuration.
Clear Visual Signals: Long (green) and Short (red) arrows appear on the chart when all entry conditions are met.
Active Zone Highlighting: The background of the indicator panel changes color (green or red) when "active zone" conditions (a combination of stochastics, trend, and RSI) are favorable.
Information Panel: A table in the top-right corner of the indicator panel displays the current status of the selected preset, trend filter, RSI value, and stochastic levels.
Signal Logic:
A LONG signal is generated when:
The fast stochastic %K crosses above its %D line.
The slow stochastic %K line is below its lower Bollinger Band (dynamic oversold condition).
The fast stochastic %K line is also in a low area (e.g., <25) to confirm the trigger is not premature.
The closing price is above the trend moving average (uptrend).
The RSI is above its long confirmation level (e.g., >40), indicating sufficient bullish momentum.
A SHORT signal is generated when:
The fast stochastic %K crosses below its %D line.
The slow stochastic %K line is above its upper Bollinger Band (dynamic overbought condition).
The fast stochastic %K line is also in a high area (e.g., >75).
The closing price is below the trend moving average (downtrend).
The RSI is below its short confirmation level (e.g., <60), indicating sufficient bearish momentum.
How to Use:
Select a Preset suitable for your trading style and the timeframe you are analyzing (e.g., Scalping for M1-M15, Intraday for M5-H1, Swing for H4-D1).
Alternatively, choose "Custom" and manually adjust all parameters (stochastic lengths, smoothing, Bollinger Bands, Moving Average, RSI, confirmation thresholds).
Observe the Information Panel for a quick understanding of the current conditions.
Evaluate the arrow signals, always considering the broader market context, price action, and any other confluences (supports/resistances, chart patterns).
The background highlighting can help quickly identify periods where conditions are aligned for potential trades.
Disclaimer:
This script is provided for educational and informational purposes only. Trading involves significant risk, and past performance is not indicative of future results. Always thoroughly test any strategy or indicator on historical data and on a demo account before risking real capital. The author assumes no responsibility for any losses incurred from the use of this script.
Author: giua64

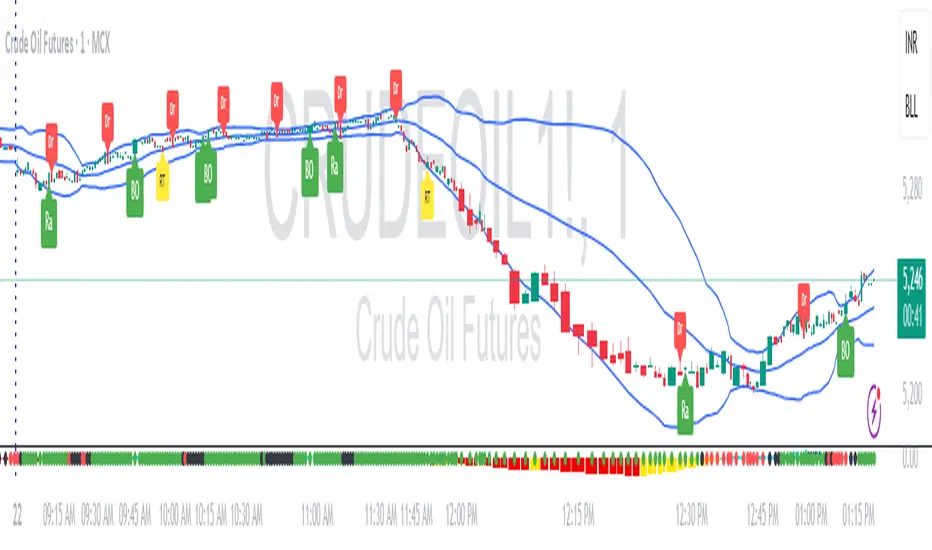
RDBRB Strategy with Filters + Cooldowns + LabelsRDBRB Strategy with Filters + Cooldowns
This script implements the RDBRB (Rally-Drop-Base-Retest-Breakout) strategy, a classic price action setup designed to identify structured trade opportunities using volume, volatility bands, and trend alignment. It’s ideal for traders looking for clean, rule-based entries across any timeframe.
🧠 Core Components
Rally & Drop Detection
Identifies short-term momentum shifts using moving average crossovers:
✅ Ra = Rally (bullish crossover)
🔻 Dr = Drop (bearish crossunder)
Base Formation
A statistical base is defined using a moving average with a standard deviation envelope (Upper/Lower BB). This forms the foundation for breakout or retest setups.
Retest Zone (RT)
When price returns to the lower band (but stays below the base), it suggests a potential re-accumulation or reaction zone before a breakout.
Breakout Confirmation (BO)
A breakout is validated when:
Price crosses above the upper band
Volume exceeds the 20-bar average by a threshold multiplier
RSI is above a bullish momentum level
Price is trending above the longer-term EMA
⏱️ Smart Cooldown Logic
Each signal (Rally, Drop, Retest, Breakout) has an independent cooldown timer to prevent multiple triggers within a short range, filtering out noise and duplicate signals:
Customizable cooldown periods via input settings
Ensures signals are meaningful and not clustered
💡 Visual Markers
All signals are shown as small, color-coded labels:
Ra : Green label below bar
Dr : Red label above bar
RT : Yellow label below bar
BO : Green breakout label below bar
Bands and base are plotted for structure reference.
🛠️ Customizable Settings
Cooldown periods for each signal type
MA lengths, volume and RSI thresholds
Trend filter and base calculation inputs
This script is ideal for price action traders who want a clean, structured method to trade consolidations and trend continuations while avoiding over-signaling. Use it on any timeframe and combine with higher-timeframe confirmation for best results.
Breakout Core | by Solid#SignalsBreakout Core | by SolidSignals
General Overview
Breakout Core is an advanced breakout trading strategy designed for Bitcoin (BTC). Optimized for the unique market dynamics following the launch of BlackRock’s Spot ETFs in January 2024, it adapts to Bitcoin’s post-ETF volatility patterns. The strategy’s core strength lies in its low drawdown, achieved through a proprietary time-based signal-filtering algorithm that sets it apart from traditional breakout strategies. Breakout Core offers traders a reliable tool for navigating Bitcoin’s evolving market with reduced risk and enhanced precision.
Mechanisms
Breakout Core combines well-known indicators BB, EMAs, MAs with custom-tuned parameters to improve signal accuracy. Its unique feature is a proprietary time-filter algorithm that prioritizes high-probability breakout signals during specific high-volatility trading hours, derived from market analysis post-ETF launch. This algorithm minimizes false positives, particularly in volatile conditions, by integrating time-based volatility patterns with price action. The result is a robust strategy that optimizes entry and exit points for Bitcoin trading.
Objectives
Breakout Core aims to provide steady returns with controlled risk by targeting Bitcoin’s breakout patterns in the post-ETF market. Its low drawdown, achieved through extensive optimization and proprietary logic, makes it suitable for leverage trading (e.g., 3–5x leverage), balancing growth with capital protection. Tailored for BTC, the strategy equips traders with a precise tool to navigate Bitcoin’s transformed market dynamics.
Backtesting and Parameter Notes
Backtesting was performed using a $10,000 USDT account, risking up to 10% of equity per trade, including 0.06% commission fees and 2-tick slippage, aligned with standard exchange conditions. The strategy report details backtesting results from the launch of BlackRock’s Spot ETFs. These settings are the script’s defaults, ensuring transparency. Traders are encouraged to verify results using TradingView’s Deep Backtest feature to adapt to current market conditions.
Please note: Past performance does not guarantee future results.
Chart and Usage
The chart is clean and intuitive, displaying only Breakout Core’s buy and sell signals for easy interpretation. Parameters are pre-optimized for immediate use, with adjustable Take Profit (TP) and Stop Loss (SL) levels. Traders should validate custom settings via TradingView’s backtesting tools to ensure market compatibility. An integrated Alarm Panel supports API connectivity, providing clear Entry/Exit commands for Long and Short positions, enabling seamless automated trading workflows.
Originality Statement
Breakout Core is an original strategy developed by SolidSignals, leveraging standard indicators (Bollinger Bands, EMAs, MAs) combined with a proprietary time-filter algorithm. No third-party or open-source code is used, ensuring full compliance with TradingView’s originality requirements. The time-filter mechanism, based on post-ETF volatility analysis, distinguishes this strategy from conventional breakout approaches.
Important Disclaimer
Market conditions evolve continuously, and past performance is not indicative of future results. Traders are responsible for validating the strategy’s settings and performance under current market conditions before use.

ABC Market stage judgmentABC Stage Judgment Indicators · Introduction
Core ideology
The market situation is divided into three stages:
Zone B (Low Volatility Accumulation): Extremely low volatility, no trend, institutions accumulate chips.
Zone A (oscillation zone): The volatility has rebounded but there is no unilateral trend, suitable for short-term high selling and low buying.
Zone C (Trend Explosion): The volatility has significantly expanded and the trend is strong, making it profitable to follow the position.
Core Indicators
Volatility measurement
Bollinger Bands Width (BBWidth): 20 cycle moving average ± 2 σ bandwidth, reflecting relative volatility compression/release;
ATR (Average True Volatility): measures the absolute intensity of price volatility.
Trend Strength
ADX (Average Trend Index): measures the strength of a trend (without distinguishing direction),
ADX<20 → No trend (Zone B/A)
ADX>25 → Significant trend (Zone C)
Stage division logic
Zone B: Both BWidth and ATR are less than the set multiple of their respective historical means, and ADX is less than the threshold → "quiet bottoming out";
Zone C: ADX>threshold, and BBWidth or ATR>set multiple of their respective historical means, trading volume amplification → "trend takeoff";
Zone A: Time periods that do not belong to B/C are all classified as oscillation zones.
Optional enhanced filtering
Direction confirmation (+DI/- DI): avoid going against the trend;
Multi cycle verification (4H): in line with the trend of large-scale;
Momentum filtering (ROC/MACD/RSI): ensuring kinetic energy support;
ATR slope: Confirm the release of fluctuations;
Breakthrough Confirmation: Enter only after the breakthrough is confirmed at the closing level.
These filters are turned off by default and can be selected with one click for different scenarios such as "high-level oscillation", "low-level bottoming", "planting trees in the middle", etc.
usage
Multi cycle switching: Built in "5-minute/1-hour" two main cycles for free switching;
Visualization: The background color and labels display the current Zone at a glance;
Alarm: Stage switching automatically triggers an Alert, which can be pushed through mobile phones/Telegram.

BK AK-9I am incredibly proud to introduce my fourth indicator to the TradingView community:
BK AK-9 — a next-level momentum-volatility hybrid, built for traders who demand precision.
🔥 Why “AK-9”? The Meaning Behind the Name
This indicator is deeply personal to me.
The “AK” in the name represents the initials of my mentor — the man whose guidance shaped my journey in trading, discipline, and strategy.
His wisdom is woven into every line of code, every design choice, and every purpose behind this tool.
The “9” holds its own powerful meaning:
9 is the number of completion and breakthrough — the moment where preparation meets opportunity.
The AK-9 weapon itself is a suppressed variant of the legendary AK platform, built for stealth, precision, and maximum impact in close-quarters combat.
It’s quiet, adaptive, and deadly effective — just like this indicator cuts through market noise, adapts to volatility, and pinpoints moments of maximum opportunity.
✨ About the BK AK-9 Indicator
The BK AK-9 is not just an oscillator.
It’s a multi-layered trading weapon combining:
✅ RSI → Stochastic → Bollinger Bands on Stoch RSI → momentum measured inside volatility.
✅ Dynamic or Static Background Flash → when extremes hit, you get instant visual alerts.
✅ Color-coded %K zones →
🔴 Red: oversold
🟢 Green: overbought
🔵 Blue: neutral
✅ Volatility-adaptive bands → instead of relying on static levels, the bands expand and contract dynamically using standard deviation.
🛡️ Why This Indicator Matters
Pinpoints exhaustion zones statistically, not emotionally.
Confirms breakouts with volatility evidence, not just price action.
Filters noise and helps you wait for high-probability setups.
Gives you visual edge with color-coded momentum and background flash.
Perfect for:
🔹 Breakout traders confirming momentum surges.
🔹 Mean-reversion traders catching exhaustion pivots.
🔹 Swing traders using multi-layered momentum analysis.
🔹 Momentum traders hunting volatility-backed entries.
💥 How to Use BK AK-9
Breakout Confirmation → when Stoch RSI breaks above upper Bollinger Band (green zone, flash ON), ride the trend.
Mean Reversion Trades → when Stoch RSI drops below lower Bollinger Band (red zone, flash ON), look for reversals.
Noise Filtering → stay patient inside the blue zone, wait for extremes.
Advanced Sync → align it with Gann levels, harmonic patterns, Fibonacci clusters, or Elliott waves for maximum edge.
🙏 Final Thoughts
This isn’t just another tool — it’s a weapon in your trading arsenal.
🔹 Dedicated to my mentor, A.K., whose wisdom and legacy guide my work.
🔹 Designed around the number 9, the number of completion, transition, and breakthrough.
🔹 Built to help traders act with precision, discipline, and clarity.
But above all, I give praise and glory to Gd — the true source of wisdom, insight, and success.
Markets will test your patience and your skill, but faith tests your soul. Through every challenge, every victory, and every setback, Gd remains the constant.
This tool is simply another way to use the gifts He has given — to help others rise.
⚡ Stay Ready, Stay Sharp
The markets are a battlefield. But with the right tools, the right strategy, and the right mindset — you will always stay 10 steps ahead.
🔥 Stay locked. Stay loaded. Trade with precision. 🔥
Gd bless, and may He guide us all to wisdom and success. 🙏

External Signals Strategy Tester v5External Signals Strategy Tester v5 – User Guide (English)
1. Purpose
This Pine Script strategy is a universal back‑tester that lets you plug in any external buy/sell series (for example, another indicator, webhook feed, or higher‑time‑frame condition) and evaluate a rich set of money‑management rules around it – with a single click on/off workflow for every module.
2. Core Workflow
Feed signals
Buy Signal / Sell Signal inputs accept any series (price, boolean, output of request.security(), etc.).
A crossover above 0 is treated as “signal fired”.
Date filter
Start Date / End Date restricts the test window so you can exclude unwanted history.
Trade engine
Optional Long / Short enable toggles.
Choose whether opposite signals simply close the trade or reverse it (flip direction in one transaction).
Risk modules – all opt‑in via check‑boxes
Classic % block – fixed % Take‑Profit / Stop‑Loss / Break‑Even.
Fibonacci Bollinger Bands (FBB) module
Draws dynamic VWMA/HMA/SMA/EMA/DEMA/TEMA mid‑line with ATR‑scaled Fibonacci envelopes.
Every line can be used for stops, trailing, or multi‑target exits.
Separate LONG and SHORT sub‑modules
Each has its own SL plus three Take‑Profits (TP1‑TP3).
Per TP you set line, position‑percentage to close, and an optional trailing flag.
Executed TP/SLs deactivate themselves so they cannot refire.
Trailing behaviour
If Trail is checked, the selected line is re‑evaluated once per bar; the order is amended via strategy.exit().
3. Inputs Overview
Group Parameter Notes
Trade Settings Enable Long / Enable Short Master switches
Close on Opposite / Reverse Position How to react to a counter‑signal
Risk % Use TP / SL / BE + their % Traditional fixed‑distance management
Fibo Bands FIBO LEVELS ENABLE + visual style/length Turn indicator overlay on/off
FBB LONG SL / TP1‑TP3 Enable, Line, %, Trail Rules applied only while a long is open
FBB SHORT SL / TP1‑TP3 Enable, Line, %, Trail Rules applied only while a short is open
Line choices: Basis, 0.236, 0.382, 0.5, 0.618, 0.764, 1.0 – long rules use lower bands, short rules use upper bands automatically.
4. Algorithm Details
Position open
On the very first bar after entry, the script checks the direction and activates the corresponding LONG or SHORT module, deactivating the other.
Order management loop (every bar)
FBB Stop‑Loss: placed/updated at chosen band; if trailing, follows the new value.
TP1‑TP3: each active target updates its limit price to the selected band (or holds static if trailing is off).
The classic % block runs in parallel; its exits have priority because they call strategy.close_all().
Exit handling
When any strategy.exit() fires, the script reads exit_id and flips the *_Active flag so that order will not be recreated.
A Stop‑Loss (SL) also disables all remaining TPs for that leg.
5. Typical Use Cases
Scenario Suggested Setup
Scalping longs into VWAP‐reversion Enable LONG TP1 @ 0.382 (30 %), TP2 @ 0.618 (40 %), SL @ 0.236 + trailing
Fade shorts during news spikes Enable SHORT SL @ 1.0 (no trail) and SHORT TP1,2,3 on consecutive lowers with small size‑outs
Classic trend‑follow Use only classic % TP/SL block and disable FBB modules
6. Hints & Tips
Signal quality matters – this script manages exits, it does not generate entries.
Keep TV time zone in mind when picking start/end dates.
For portfolio‑style testing allocate smaller default_qty_value than 100 % or use strategy.percent_of_equity sizing.
You can combine FBB exits with fixed‑% ones for layered management.
7. Limitations / Safety
No pyramiding; the script holds max one position at a time.
All calculations are bar‑close; intra‑bar touches may differ from real‑time execution.
The indicator overlay is optional, so you can run visual‑clean tests by unchecking FIBO LEVELS ENABLE.

Dskyz (DAFE) Adaptive Regime - Quant Machine ProDskyz (DAFE) Adaptive Regime - Quant Machine Pro:
Buckle up for the Dskyz (DAFE) Adaptive Regime - Quant Machine Pro, is a strategy that’s your ultimate edge for conquering futures markets like ES, MES, NQ, and MNQ. This isn’t just another script—it’s a quant-grade powerhouse, crafted with precision to adapt to market regimes, deliver multi-factor signals, and protect your capital with futures-tuned risk management. With its shimmering DAFE visuals, dual dashboards, and glowing watermark, it turns your charts into a cyberpunk command center, making trading as thrilling as it is profitable.
Unlike generic scripts clogging up the space, the Adaptive Regime is a DAFE original, built from the ground up to tackle the chaos of futures trading. It identifies market regimes (Trending, Range, Volatile, Quiet) using ADX, Bollinger Bands, and HTF indicators, then fires trades based on a weighted scoring system that blends candlestick patterns, RSI, MACD, and more. Add in dynamic stops, trailing exits, and a 5% drawdown circuit breaker, and you’ve got a system that’s as safe as it is aggressive. Whether you’re a newbie or a prop desk pro, this strat’s your ticket to outsmarting the markets. Let’s break down every detail and see why it’s a must-have.
Why Traders Need This Strategy
Futures markets are a gauntlet—fast moves, volatility spikes (like the April 28, 2025 NQ 1k-point drop), and institutional traps that punish the unprepared. Meanwhile, platforms are flooded with low-effort scripts that recycle old ideas with zero innovation. The Adaptive Regime stands tall, offering:
Adaptive Intelligence: Detects market regimes (Trending, Range, Volatile, Quiet) to optimize signals, unlike one-size-fits-all scripts.
Multi-Factor Precision: Combines candlestick patterns, MA trends, RSI, MACD, volume, and HTF confirmation for high-probability trades.
Futures-Optimized Risk: Calculates position sizes based on $ risk (default: $300), with ATR or fixed stops/TPs tailored for ES/MES.
Bulletproof Safety: 5% daily drawdown circuit breaker and trailing stops keep your account intact, even in chaos.
DAFE Visual Mastery: Pulsing Bollinger Band fills, dynamic SL/TP lines, and dual dashboards (metrics + position) make signals crystal-clear and charts a work of art.
Original Craftsmanship: A DAFE creation, built with community passion, not a rehashed clone of generic code.
Traders need this because it’s a complete, adaptive system that blends quant smarts, user-friendly design, and DAFE flair. It’s your edge to trade with confidence, cut through market noise, and leave the copycats in the dust.
Strategy Components
1. Market Regime Detection
The strategy’s brain is its ability to classify market conditions into five regimes, ensuring signals match the environment.
How It Works:
Trending (Regime 1): ADX > 20, fast/slow EMA spread > 0.3x ATR, HTF RSI > 50 or MACD bullish (htf_trend_bull/bear).
Range (Regime 2): ADX < 25, price range < 3% of close, no HTF trend.
Volatile (Regime 3): BB width > 1.5x avg, ATR > 1.2x avg, HTF RSI overbought/oversold.
Quiet (Regime 4): BB width < 0.8x avg, ATR < 0.9x avg.
Other (Regime 5): Default for unclear conditions.
Indicators: ADX (14), BB width (20), ATR (14, 50-bar SMA), HTF RSI (14, daily default), HTF MACD (12,26,9).
Why It’s Brilliant:
Regime detection adapts signals to market context, boosting win rates in trending or volatile conditions.
HTF RSI/MACD add a big-picture filter, rare in basic scripts.
Visualized via gradient background (green for Trending, orange for Range, red for Volatile, gray for Quiet, navy for Other).
2. Multi-Factor Signal Scoring
Entries are driven by a weighted scoring system that combines candlestick patterns, trend, momentum, and volume for robust signals.
Candlestick Patterns:
Bullish: Engulfing (0.5), hammer (0.4 in Range, 0.2 else), morning star (0.2), piercing (0.2), double bottom (0.3 in Volatile, 0.15 else). Must be near support (low ≤ 1.01x 20-bar low) with volume spike (>1.5x 20-bar avg).
Bearish: Engulfing (0.5), shooting star (0.4 in Range, 0.2 else), evening star (0.2), dark cloud (0.2), double top (0.3 in Volatile, 0.15 else). Must be near resistance (high ≥ 0.99x 20-bar high) with volume spike.
Logic: Patterns are weighted higher in specific regimes (e.g., hammer in Range, double bottom in Volatile).
Additional Factors:
Trend: Fast EMA (20) > slow EMA (50) + 0.5x ATR (trend_bull, +0.2); opposite for trend_bear.
RSI: RSI (14) < 30 (rsi_bull, +0.15); > 70 (rsi_bear, +0.15).
MACD: MACD line > signal (12,26,9, macd_bull, +0.15); opposite for macd_bear.
Volume: ATR > 1.2x 50-bar avg (vol_expansion, +0.1).
HTF Confirmation: HTF RSI < 70 and MACD bullish (htf_bull_confirm, +0.2); RSI > 30 and MACD bearish (htf_bear_confirm, +0.2).
Scoring:
bull_score = sum of bullish factors; bear_score = sum of bearish. Entry requires score ≥ 1.0.
Example: Bullish engulfing (0.5) + trend_bull (0.2) + rsi_bull (0.15) + htf_bull_confirm (0.2) = 1.05, triggers long.
Why It’s Brilliant:
Multi-factor scoring ensures signals are confirmed by multiple market dynamics, reducing false positives.
Regime-specific weights make patterns more relevant (e.g., hammers shine in Range markets).
HTF confirmation aligns with the big picture, a quant edge over simplistic scripts.
3. Futures-Tuned Risk Management
The risk system is built for futures, calculating position sizes based on $ risk and offering flexible stops/TPs.
Position Sizing:
Logic: Risk per trade (default: $300) ÷ (stop distance in points * point value) = contracts, capped at max_contracts (default: 5). Point value = tick value (e.g., $12.5 for ES) * ticks per point (4) * contract multiplier (1 for ES, 0.1 for MES).
Example: $300 risk, 8-point stop, ES ($50/point) → 0.75 contracts, rounded to 1.
Impact: Precise sizing prevents over-leverage, critical for micro contracts like MES.
Stops and Take-Profits:
Fixed: Default stop = 8 points, TP = 16 points (2:1 reward/risk).
ATR-Based: Stop = 1.5x ATR (default), TP = 3x ATR, enabled via use_atr_for_stops.
Logic: Stops set at swing low/high ± stop distance; TPs at 2x stop distance from entry.
Impact: ATR stops adapt to volatility, while fixed stops suit stable markets.
Trailing Stops:
Logic: Activates at 50% of TP distance. Trails at close ± 1.5x ATR (atr_multiplier). Longs: max(trail_stop_long, close - ATR * 1.5); shorts: min(trail_stop_short, close + ATR * 1.5).
Impact: Locks in profits during trends, a game-changer in volatile sessions.
Circuit Breaker:
Logic: Pauses trading if daily drawdown > 5% (daily_drawdown = (max_equity - equity) / max_equity).
Impact: Protects capital during black swan events (e.g., April 27, 2025 ES slippage).
Why It’s Brilliant:
Futures-specific inputs (tick value, multiplier) make it plug-and-play for ES/MES.
Trailing stops and circuit breaker add pro-level safety, rare in off-the-shelf scripts.
Flexible stops (ATR or fixed) suit different trading styles.
4. Trade Entry and Exit Logic
Entries and exits are precise, driven by bull_score/bear_score and protected by drawdown checks.
Entry Conditions:
Long: bull_score ≥ 1.0, no position (position_size <= 0), drawdown < 5% (not pause_trading). Calculates contracts, sets stop at swing low - stop points, TP at 2x stop distance.
Short: bear_score ≥ 1.0, position_size >= 0, drawdown < 5%. Stop at swing high + stop points, TP at 2x stop distance.
Logic: Tracks entry_regime for PNL arrays. Closes opposite positions before entering.
Exit Conditions:
Stop-Loss/Take-Profit: Hits stop or TP (strategy.exit).
Trailing Stop: Activates at 50% TP, trails by ATR * 1.5.
Emergency Exit: Closes if price breaches stop (close < long_stop_price or close > short_stop_price).
Reset: Clears stop/TP prices when flat (position_size = 0).
Why It’s Brilliant:
Score-based entries ensure multi-factor confirmation, filtering out weak signals.
Trailing stops maximize profits in trends, unlike static exits in basic scripts.
Emergency exits add an extra safety layer, critical for futures volatility.
5. DAFE Visuals
The visuals are pure DAFE magic, blending function with cyberpunk flair to make signals intuitive and charts stunning.
Shimmering Bollinger Band Fill:
Display: BB basis (20, white), upper/lower (green/red, 45% transparent). Fill pulses (30–50 alpha) by regime, with glow (60–95 alpha) near bands (close ≥ 0.995x upper or ≤ 1.005x lower).
Purpose: Highlights volatility and key levels with a futuristic glow.
Visuals make complex regimes and signals instantly clear, even for newbies.
Pulsing effects and regime-specific colors add a DAFE signature, setting it apart from generic scripts.
BB glow emphasizes tradeable levels, enhancing decision-making.
Chart Background (Regime Heatmap):
Green — Trending Market: Strong, sustained price movement in one direction. The market is in a trend phase—momentum follows through.
Orange — Range-Bound: Market is consolidating or moving sideways, with no clear up/down trend. Great for mean reversion setups.
Red — Volatile Regime: High volatility, heightened risk, and larger/faster price swings—trade with caution.
Gray — Quiet/Low Volatility: Market is calm and inactive, with small moves—often poor conditions for most strategies.
Navy — Other/Neutral: Regime is uncertain or mixed; signals may be less reliable.
Bollinger Bands Glow (Dynamic Fill):
Neon Red Glow — Warning!: Price is near or breaking above the upper band; momentum is overstretched, watch for overbought conditions or reversals.
Bright Green Glow — Opportunity!: Price is near or breaking below the lower band; market could be oversold, prime for bounce or reversal.
Trend Green Fill — Trending Regime: Fills between bands with green when the market is trending, showing clear momentum.
Gold/Yellow Fill — Range Regime: Fills with gold/aqua in range conditions, showing the market is sideways/oscillating.
Magenta/Red Fill — Volatility Spike: Fills with vivid magenta/red during highly volatile regimes.
Blue Fill — Neutral/Quiet: A soft blue glow for other or uncertain market states.
Moving Averages:
Display: Blue fast EMA (20), red slow EMA (50), 2px.
Purpose: Shows trend direction, with trend_dir requiring ATR-scaled spread.
Dynamic SL/TP Lines:
Display: Pulsing colors (red SL, green TP for Trending; yellow/orange for Range, etc.), 3px, with pulse_alpha for shimmer.
Purpose: Tracks stops/TPs in real-time, color-coded by regime.
6. Dual Dashboards
Two dashboards deliver real-time insights, making the strat a quant command center.
Bottom-Left Metrics Dashboard (2x13):
Metrics: Mode (Active/Paused), trend (Bullish/Bearish/Neutral), ATR, ATR avg, volume spike (YES/NO), RSI (value + Oversold/Overbought/Neutral), HTF RSI, HTF trend, last signal (Buy/Sell/None), regime, bull score.
Display: Black (29% transparent), purple title, color-coded (green for bullish, red for bearish).
Purpose: Consolidates market context and signal strength.
Top-Right Position Dashboard (2x7):
Metrics: Regime, position side (Long/Short/None), position PNL ($), SL, TP, daily PNL ($).
Display: Black (29% transparent), purple title, color-coded (lime for Long, red for Short).
Purpose: Tracks live trades and profitability.
Why It’s Brilliant:
Dual dashboards cover market context and trade status, a rare feature.
Color-coding and concise metrics guide beginners (e.g., green “Buy” = go).
Real-time PNL and SL/TP visibility empower disciplined trading.
7. Performance Tracking
Logic: Arrays (regime_pnl_long/short, regime_win/loss_long/short) track PNL and win/loss by regime (1–5). Updated on trade close (barstate.isconfirmed).
Purpose: Prepares for future adaptive thresholds (e.g., adjust bull_score min based on regime performance).
Why It’s Brilliant: Lays the groundwork for self-optimizing logic, a quant edge over static scripts.
Key Features
Regime-Adaptive: Optimizes signals for Trending, Range, Volatile, Quiet markets.
Futures-Optimized: Precise sizing for ES/MES with tick-based risk inputs.
Multi-Factor Signals: Candlestick patterns, RSI, MACD, and HTF confirmation for robust entries.
Dynamic Exits: ATR/fixed stops, 2:1 TPs, and trailing stops maximize profits.
Safe and Smart: 5% drawdown breaker and emergency exits protect capital.
DAFE Visuals: Shimmering BB fill, pulsing SL/TP, and dual dashboards.
Backtest-Ready: Fixed qty and tick calc for accurate historical testing.
How to Use
Add to Chart: Load on a 5min ES/MES chart in TradingView.
Configure Inputs: Set instrument (ES/MES), tick value ($12.5/$1.25), multiplier (1/0.1), risk ($300 default). Enable ATR stops for volatility.
Monitor Dashboards: Bottom-left for regime/signals, top-right for position/PNL.
Backtest: Run in strategy tester to compare regimes.
Live Trade: Connect to Tradovate or similar. Watch for slippage (e.g., April 27, 2025 ES issues).
Replay Test: Try April 28, 2025 NQ drop to see regime shifts and stops.
Disclaimer
Trading futures involves significant risk of loss and is not suitable for all investors. Past performance does not guarantee future results. Backtest results may differ from live trading due to slippage, fees, or market conditions. Use this strategy at your own risk, and consult a financial advisor before trading. Dskyz (DAFE) Trading Systems is not responsible for any losses incurred.
Backtesting:
Frame: 2023-09-20 - 2025-04-29
Slippage: 3
Fee Typical Range (per side, per contract)
CME Exchange $1.14 – $1.20
Clearing $0.10 – $0.30
NFA Regulatory $0.02
Firm/Broker Commis. $0.25 – $0.80 (retail prop)
TOTAL $1.60 – $2.30 per side
Round Turn: (enter+exit) = $3.20 – $4.60 per contract
Final Notes
The Dskyz (DAFE) Adaptive Regime - Quant Machine Pro is more than a strategy—it’s a revolution. Crafted with DAFE’s signature precision, it rises above generic scripts with adaptive regimes, quant-grade signals, and visuals that make trading a thrill. Whether you’re scalping MES or swinging ES, this system empowers you to navigate markets with confidence and style. Join the DAFE crew, light up your charts, and let’s dominate the futures game!
(This publishing will most likely be taken down do to some miscellaneous rule about properly displaying charting symbols, or whatever. Once I've identified what part of the publishing they want to pick on, I'll adjust and repost.)
Use it with discipline. Use it with clarity. Trade smarter.
**I will continue to release incredible strategies and indicators until I turn this into a brand or until someone offers me a contract.
Created by Dskyz, powered by DAFE Trading Systems. Trade smart, trade bold.

Polygot Moving AveragesDescription
This is essentially a source merger of Bollinger Bands by Trading View and Simple Moving Averages by stoxxinbox. My additions and subtractions are minimal. There is the BB MA, which I default at 5d, and the other 4 averages are the standard 21, 50, 100, 200, day moving averages. I default the averaging method to WMA (Weighted Moving Average). The method of averaging can be changed as also can the lengths of the inputs to match user preferences. This is what I wanted for an indicator and didn't find.
Usage
The same as you would use any other BB or MA indicator. The benefit of this one is that it has 4 MAs, one MA with the Bollinger Bands attached, and the colours adjusted to be easy on the eyes when using high contrast themes, to be discernible yet sit quietly in the background with lines and candle sticks everywhere shouting for attention. I use it as a base first indicator which I can hide easily (imagine hiding five MA indicators individually constantly) when the more serious indicators come into play.