Komut dosyalarını "bollingerband" için ara

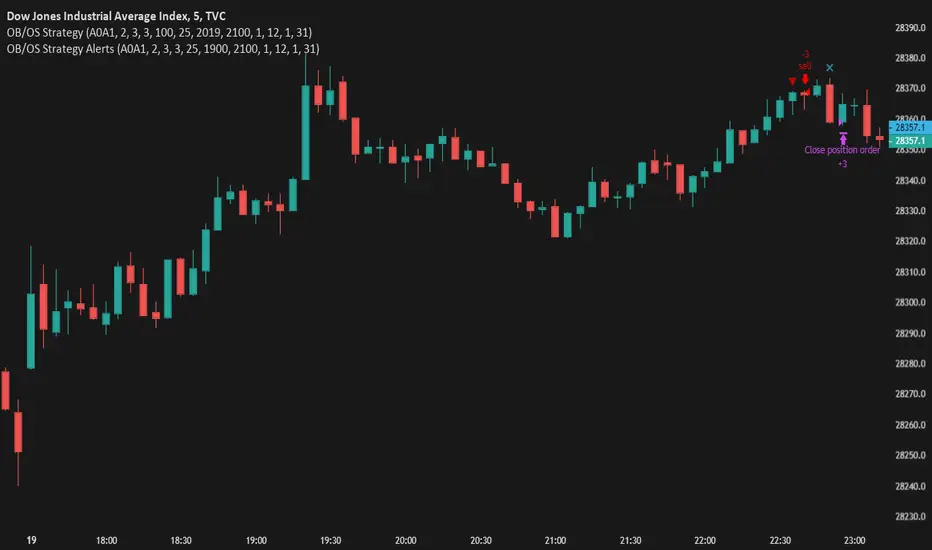
Brandon BollSecond day at Pinescript and I am attempting to tweak the Bollinger Bands directed strategy to send alerts to Zignaly in order to automate long buy/sells.
I've left in the short script though for completeness.
The buy and sell instructions work perfectly but I don't know how to do a cancel order alert (as included in the original strategy)

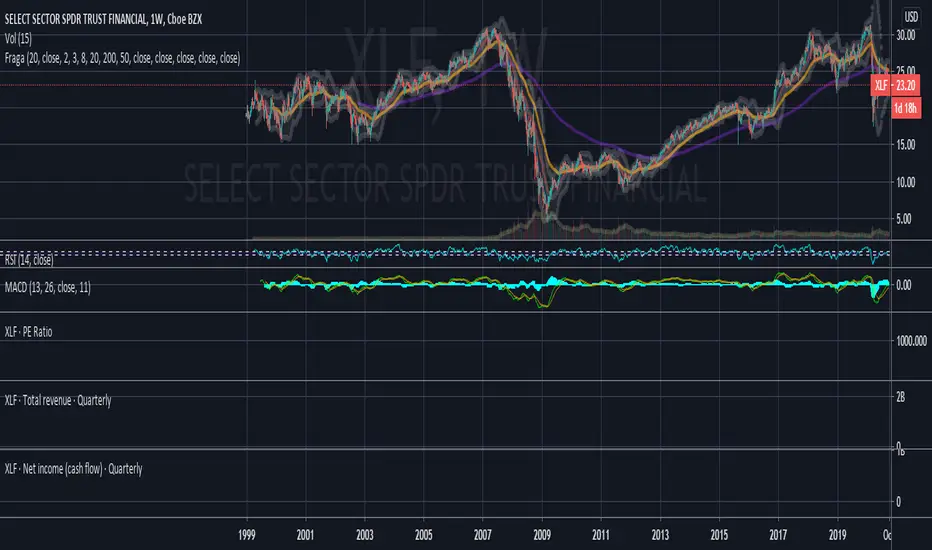
Didi+EMA200+Bollinger Bands-FRAGAHelps those are using Basic Account / limited indicators
by Will Fraga
@traderzonebr
MBY_Support Your Trading2HI
This is Yong.
This indicator based on moving average and MACD + others
and Just for invite only.

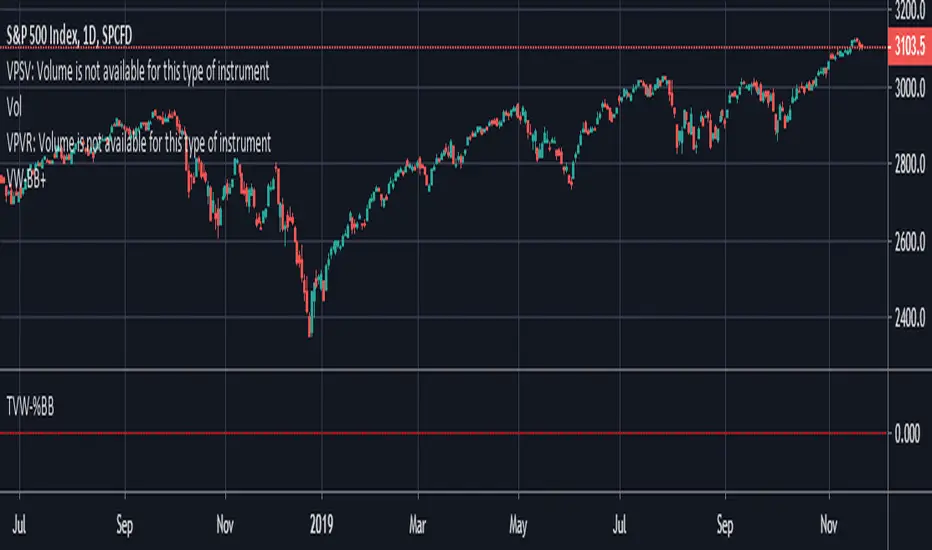
Volume Weighted Bollinger (Final, cleaned up visuals)Volume-weighted bollinger (normal stats application of weighting mean) with cleaned up visualization. Shaded area represents1sd-2sd move size for trailing 20 period average on timeframe for individual candles.
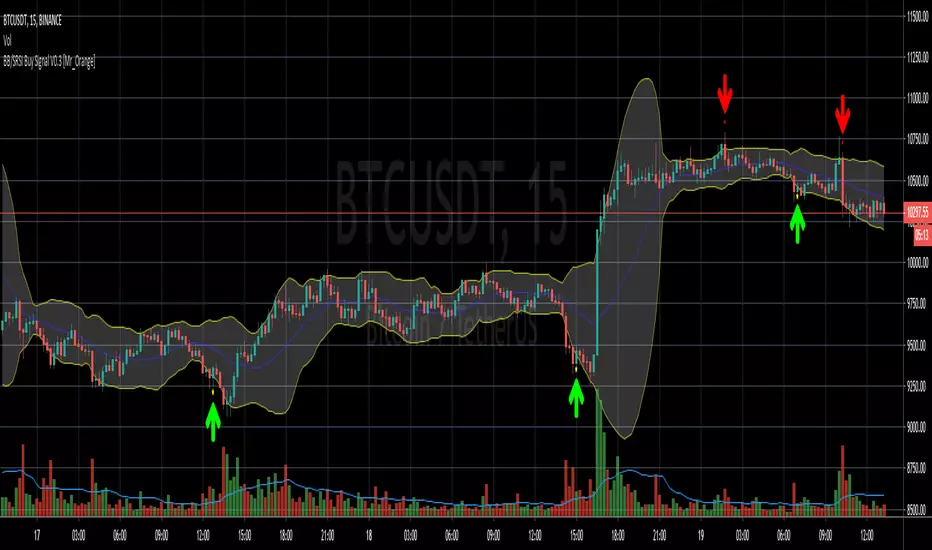
Bollinger Bands/Stoch RSI Buy Signal V0.1 [Mr_Orange]
This my second published script, so if there are tips or questions, please let me know.
The goal of the script is to recognise a reversal pattern from bearish to bullish sentiment on a 3m and 5m timeframe. I want my trade entries to be "mechanically chosen" and not emotionally. I have not yet found a Bollinger and Stochastic RSI indicator which did what I wanted it to do, I've yet to find one of those, so I decided to study pine scripts and make one myself that works the way I want, and because I've written it myself, I understand how it works.
It is purely designed for lower timeframes and normal candles, please do not use it Heikin or Renko. Other timeframes I have not studied. At the moment I only included a Buy alert. I have not yet decided on a Sell signal/alert.
Thanks for checking it out! If you think it is worth something:
- BTC: 1NrG3Sy2VW8u4wWHucj1CQjKQ6hXYwbSyX

Waddah Attar Explosion V2 [SHK]Hey everyone
I have modified Waddah Attar Explosion indicator to work in low price markets like crypto as well as any other market. So now the DeadZone line is based on ATR instead of a fixed number. Nothing more changed and all credits goes to it's MT4 developer and LazyBear (Main Script Link) .
Hope you enjoy!
Read the main description below...
- - - - - - - - - - - - - - - - - - - - - - - - - - - - - - - - - - - - - - -
This is a port of a famous MT4 indicator. This indicator uses MACD/BB to track trend direction and strength. Author suggests using this indicator on 30mins.
Explanation from the indicator developer:
"Various components of the indicator are:
Dead Zone Line: Works as a filter for weak signals. Do not trade when the red or green histogram is below it.
Histograms:
- Red histogram shows the current down trend.
- Green histogram shows the current up trend.
- Sienna line shows the explosion in price up or down.
Signal for ENTER_BUY: All the following conditions must be met.
- Green histo is raising.
- Green histo above Explosion line.
- Explosion line raising.
- Both green histo and Explosion line above DeadZone line.
Signal for EXIT_BUY: Exit when green histo crosses below Explosion line.
Signal for ENTER_SELL: All the following conditions must be met.
- Red histo is raising.
- Red histo above Explosion line.
- Explosion line raising.
- Both red histo and Explosion line above DeadZone line.
Signal for EXIT_SELL: Exit when red histo crosses below Explosion line.
All of the parameters are configurable via options page. You may have to tune it for your instrument.

Noro's Connors modified - with arrows and alertsThis is a study for providing alerts to this strategy
Bollinger Bands + Moving AveragesBollinger Bands + 3 MAs(EMA)
Exponential Moving Averages (EMA) 13, 62 & 200 (default values)
Bollingers Band (BB) 20 (default value)
Values can be amended based on your trading strategy.


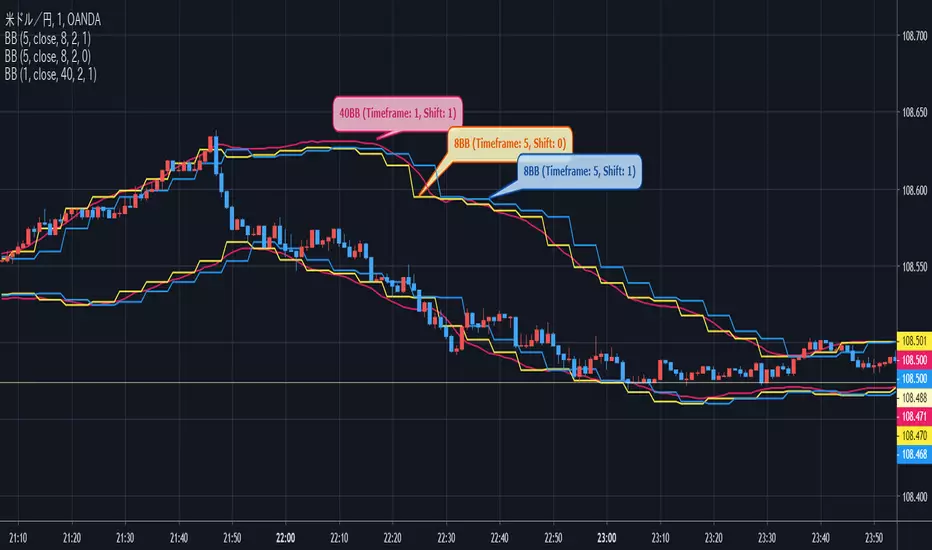
Multi-TF Avg BBandsMULTI-TF AVERAGE BBANDS - with signals (BETA)
Overall, it shows where the price has support and resistance, when it's breaking through, and when its relatively low/high based on the magic of standard deviation.
created by gamazama. send me a shout if u find this useful, or if you create something cool with it.
%BB: The price's position in the boilinger band is converted to a range from 0-1. The midpoint is at 0.5
Description of parameters
"BB:Window Length" is the standard BB size of 20 candles.
The indicator plots up to 7 different %BB's on different timescales
They are calculated independently of the timescale you are viewing eg 12h, 3d, 30m will be the same output
You can enter 7 timescales, eg. if you want to plot a range of bbands of the 12h up to 3d graphs, enter values between 0.5 and 3 (days) - you can also select 0 to disable and use less timescales, or select hours or minutes
Take note if you eg. double the main multiplier to 40, it is the same as doubling all your timescales
You can turn the transparency of the 7 x %BB's to 100 to hide them, their average is plotted as a thick cyan line
"Variance" is a measure of how much the 7 BB's agree, and changes colour based on the thresholds used for the strategy
---- TO START FROM SCRATCH ----
- set all except one to ZERO (0), set to 0, and everything after to 0.
Turn ON and right click -> move the indicator to a new pane - this will show you the internal workings of the indicator.
Then there is a few standard settings
"Source Smoothing Amount" applies a basic small sma on the price.
It should be turned down when viewing candles with less information, like 1D or more.
Standard BBands use an SMA, there one uses a blend between VWMA or SMA
Volume Weight settings, the same as SMA at 0, and the same as VWMA at 1
BB^2 is a bband drawn around the average %BB. Adjust the to change its window length
The BB^2 changes color when price moves up or down
Now its time to look at the parameters which affect the buy/sell signals
turn on "show signal range" - you see some red lines
buy and sell each have 4 settings
min/max variance will affect the brigtness of the signal range
range adjust will move the range up/down
mix BB^2 blends between a straight line (0) and BB^2's top or bottom (1)
a threshold of "variance" and "h/l points" is available to generate weaker signals.
these thresholds can be increased to show more weak signals
ONCE YOU ARE HAPPY WITH THE SIGNALS being generated, you can turn OFF , and move it back to the price pane
the indicator then draws a bband around the price to maps some info into the chart:
fills a colour between 0.5 & the mid BB^2 and converts relative to the price chart
draws a line in the middle of the midband.
controls how much these lines diverge from the price - adjust it to reduce noise
converts the signal range (red lines) to be relative to the price chart
if you like, you can adjust the sell & buy signals in the tab from and to and to match the picture. It messes with auto-scaling when moving back to though
enjoy, I hope that is easy enough to understand, still trying to make this more user-friendly.
If you want to send me some token of appreciation - btc: 33c2oiCW8Fnsy41Y8z2jAPzY8trnqr5cFu
I promise it will put a fat smile on my face

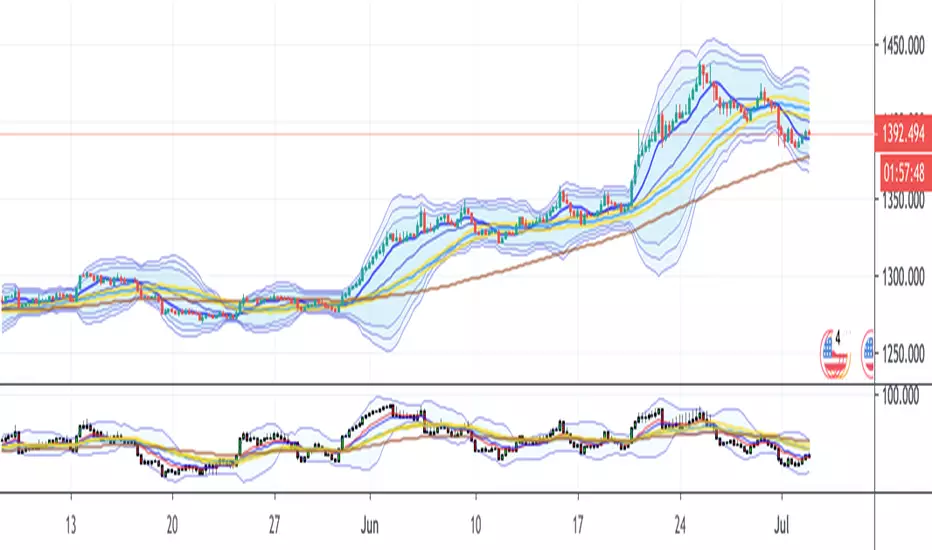
~RMCF~ 5 Bollinger Bands with EMA/Breakout options5 Configurable Bollinger Bands and custom breakout and reversal confirmation indicators. All settings are able to be edited and tuned to your liking. Default standard deviations for the bands are .5,1,2,2.5,3 and breakout/reversal confirmation standard deviation move pair is 2.9,2.1
APEX - Swing Aura StrategyA backtester of my new strat, it's a hybrid swing/scalp strat that really looks for quick low profits. Will keep it hidden as it's a bit of a work in progress right now. Working on it to perform well enough with the Apex Trading bot, ran it for a day now and it ended the day on a 1.78% portfolio profit, so I'm really pleased with that.
As for details it's based on Keltner Channels, Bolingers Bands and a Ichimoku cloud. To spice it up there's even a Wave trend in there as well!
All the settings for the bits and parts are changeable so feel free to mess around with them, but will keep my sell triggers fixed for now, so no editing of those from within the script unfortunately.
Enjoy!

Bohyun's favorite composition by Theo ParkThis indicator contains
8 MA
1 Fibonacci Bollinger Bands
3 Bollinger Bands
2 Ichimokus


Koby's 3 trend indicators AIOAll in one my indicators.
Includes 3 indicators: "KobaMA'ndicator", "MAT_K" and "KFBB".

Koby's Fibonacci Bollinger BandThis is my customized Bolinger Band. Using Fibonacci number, 0.236, 0.382 and 0.618.
HMA base.
Default source using 21 and 5. These also Fibonacci number.
Alpha version. I have created for my follower and SNS group.

BAHbO BB,RSI strategyThis script is using Bollinger Bands in combination with Oversold/Overbought RSI 2(20,80).

Rumpy's McGinley's Dynamic Bollinger Bands and Keltner ChannelUses volume weighted (optional) applied to the McGinley Dynamic for the basis of either a Bollinger Band or Keltner Channel.
When volume weighting is enabled it uses a volume weighted standard deviation to calculate the bollinger width.
Keltner channel also uses the McGinley formula to calculate the ATR used to determine the width of the channel.
Both the 1x and 2x standard dev and ATR multiples had significant PA interaction so both intervals are plotted to the BB and KC.
---------------------------------------
If you find it useful please consider a tip/donation :
BTC - 3BMEXEDyWJ58eXUEALYPadbn1wwWKmf6sA
---------------------------------------
Keltner Channel :
