BB Forecast PrototypeExperiment to try apply @atrader2's MA Forecast () to bollinger bands - didn't exactly work out how I expected it to, especially with the Upper/Lower forecast projections.
Komut dosyalarını "bollingerband" için ara

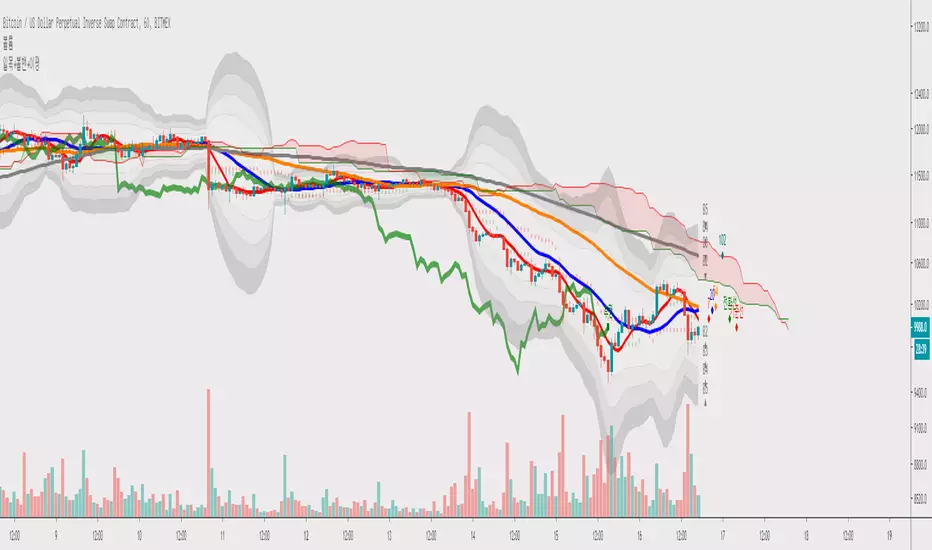
ICH+BB+MA_BY_CRYPDOGThis is multiful layout. :)
1. ICHIMOKU BASE LINE + CONVERTER LINE
2. Multiful BB BAND ( MAX 4 )
3. MA / EMA / VMA ( MAX 6 )
4. Color custom / Input number custom
If you have any question dm me.
Thanks!
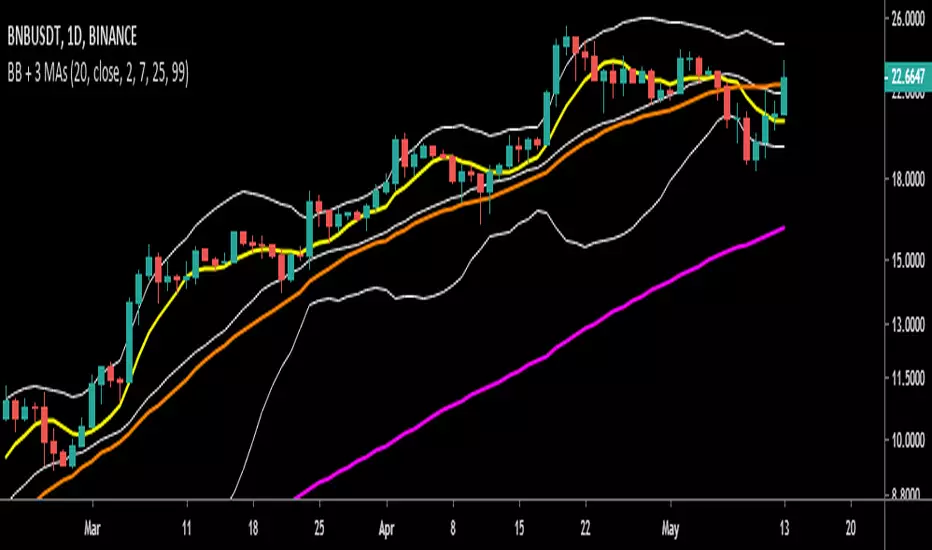
Bollinger Bands and 3 Moving Average lines in one IndicatorThe Bollinger Bands (BB) and 3 Moving Average (MA) lines in ONE indicator.
Default values were employed from Binance settings, which are:
- The BB: MA 20 and multiply by 2.
- The 3 MAs: 7, 25 and 99 periods.
The values can be modified to meet one's strategy.

Dream I Trading Indicator with JSK by Theo Parkthis indicator contains
6 MAs
6 EMAs
3 Bollinger Bands
1 Envelope
1 Ichimoku
1 CM_SlingShotSystem
composed by JSK


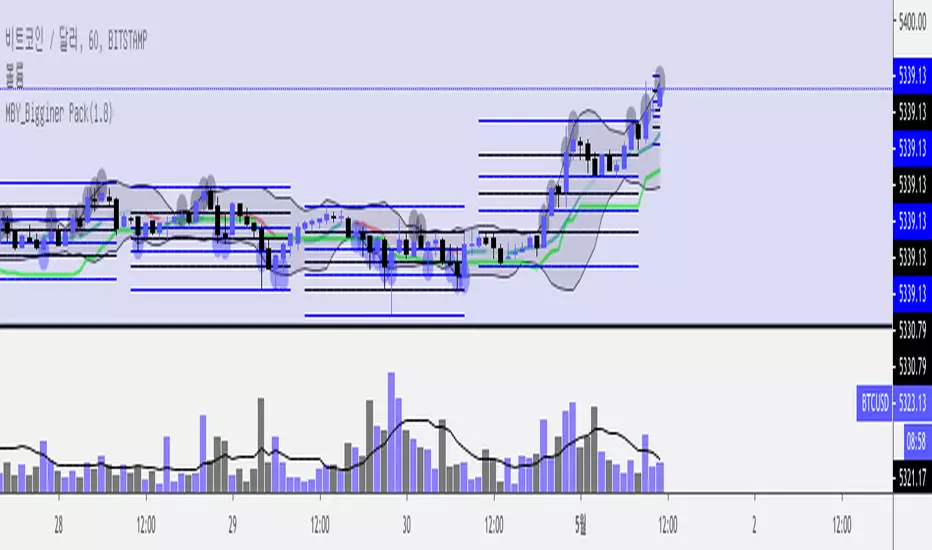
MBY_Bigginer Pack(1.8 for prototype)this indicator help your trade.
just one indicator showing, but you get more.
1. bollinger bands
2. pibotnachi support / resistance line (1H)
3. ichimoku clouds ' base line
4. movingaverage lines with macd colors.
+ strategy about bollinger bands with candle stick patterns.
enjoy it.
+ this version just for test about "Repainting" , i hope it just gonna be OK.

Rumpy's Volume Weighted Bollinger BandsBollinger Bands constructed using a volume weighted EMA as the basis and a volume weighted standard deviation to calculate the bands.
---------------------------------------
If you find it useful please consider a tip/donation :
BTC - 3BMEXEDyWJ58eXUEALYPadbn1wwWKmf6sA

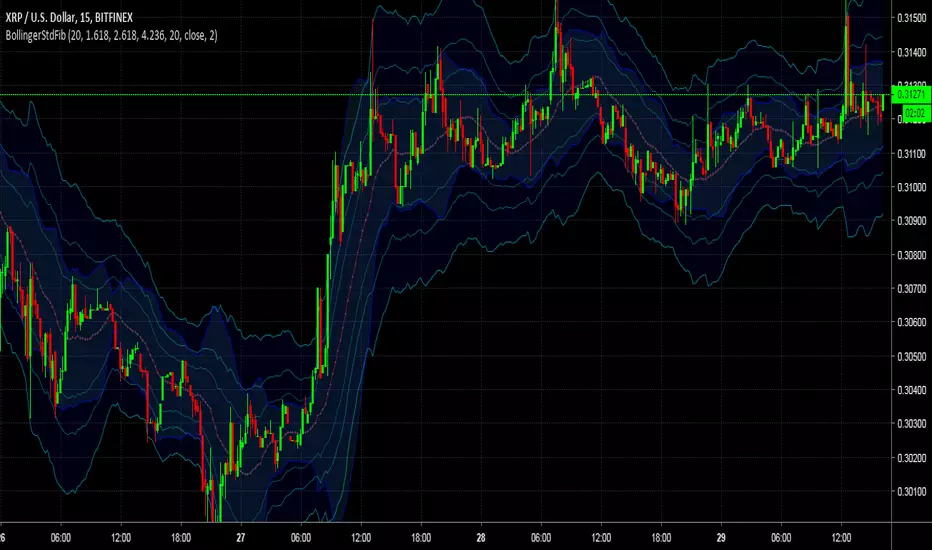
MBY_Bigginer Pack(Free)BITFINEX:BTCUSD
Hi, everyone.
This is MBY.
This indicator show you 1)Fibonacci Support&Resistance Line 2)Moving average With MACD based on MACD 3) ichimoku base line 4) Bollinger bands.
Using This indicator, no longer necessary to draw supporting lines and moving average lines.
Thanks.
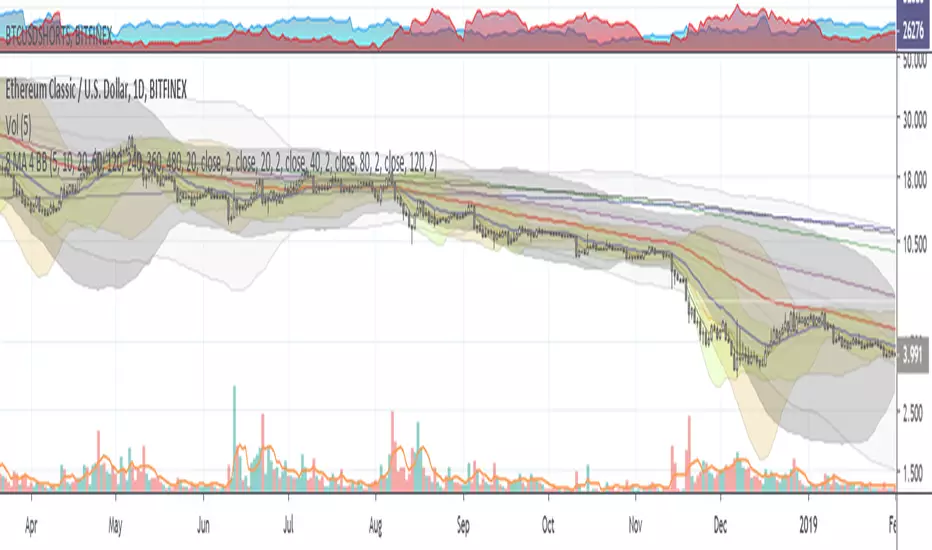
8 MA + 4 Bollinger Bands by Theo ParkThis indicator contains :
- 8 Moving Averages
- 4 Bollinger Bands
- 1 Fibonnaci
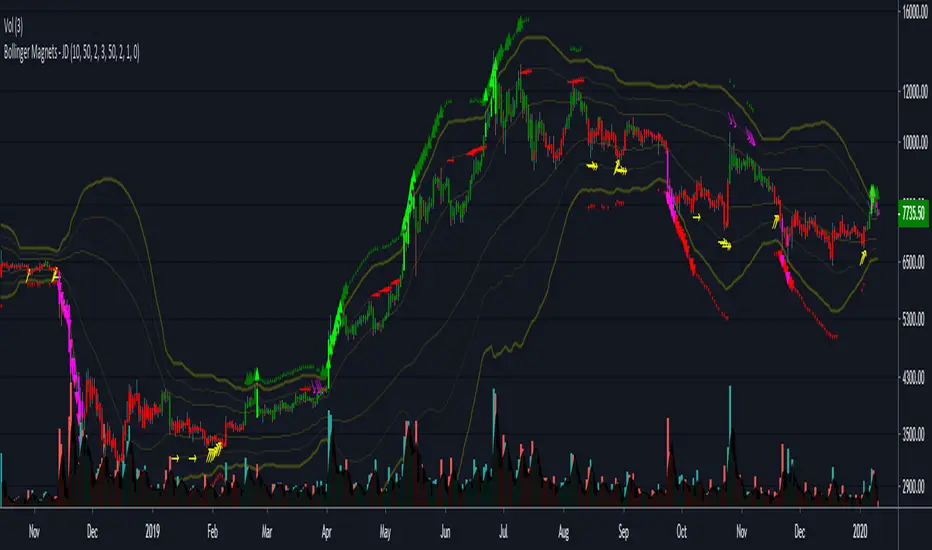
Bollinger Magnets - JDThis indicator does the same thing as my "Deviation Magnet" script, but is in 'overlay' form
and is more oriented towards the people who like to keep their eyes on the chart rather than a bottom indicator.
As tated in my "Deviation Magnet" script, contrary to the popular use where price is seen as BOUNCING AGAINST the different deviations (or upper and lower BBands),
I tend to find that price likes to STICK to those deviations once it hits them (with a high or a low wick) and "rides them" for a while.
I call this "THE MAGNET EFFECT" of the standard deviations.
The indicator highlights those "MAGNET MOVES".
For most assets I like to use 50 period deviations better than the standard 20 period because it shows the bigger trends better
but of course this can be modified to your liking!
JD.
#NotTradingAdvice
#DYOR
I build these indicators for myself and provide them open source, to use for free to use and improve upon,
as I believe the best way to learn is toghether.
ATS Master's IndicatorThis master indicator is a collection of multiple useful indicators, which only requires one indicator slot in TradingView.
In this collection you will find the following 15 indicators:
Bollinger Bands (three different types: Fibonacci, Standard, Improved)
Gaps Checker
Large Candles Checker
SPY Checker Lite
Volume Checker Pro
Moving Averages (up to two individual MA indicators)
Exponential Moving Averages (up to two individual EMA indicators)
Double Exponential Moving Averages (up to two individual DEMA indicators)
Tripple Exponential Moving Averages (up to two individual TEMA indicators)
So, using this master indicator you are able to use up to 15 indicators in one.
If you would like to use this master indicator drop me a line and send a request for it.

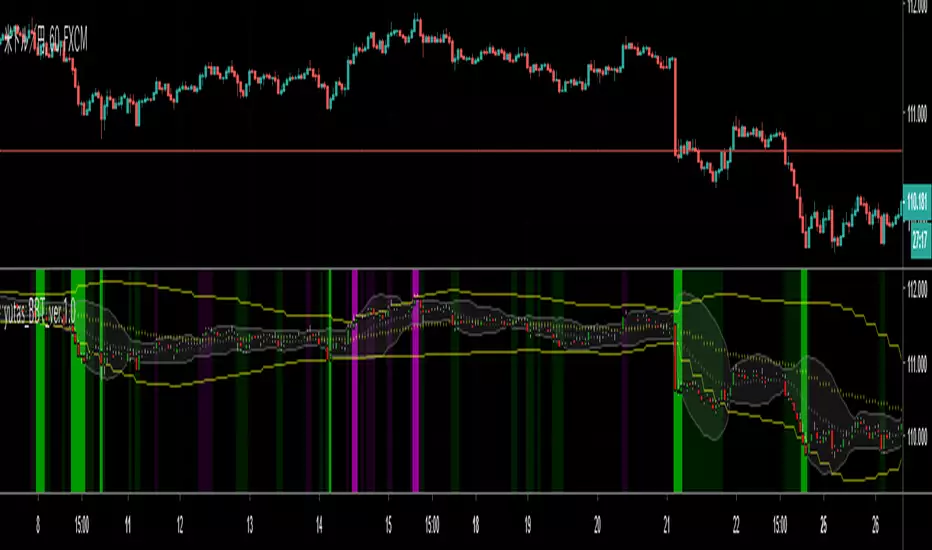
yutas_Bollinger Band Touchver.1.0
Bollinger Bands ±2(figures changeable)σ × 2(MTF)
Show / hide candlesticks.
BB touch sign display / non-display.
BB①② composite sign display / non-display.
Alert function.
-----------------------------------------------------------------
ボリンジャーバンド ±2(数値の変更可)σ × 2(マルチタイムフレーム)
ローソク足の表示・非表示。
BBタッチサイン表示・非表示。
BB①②の複合サイン表示・非表示。
アラート機能。
-----------------------------------------------------------------
(YEK) Combo(YEK) Combo is a combination of several indicators (listed below). You can use them together or one by one. Just click settings, and choose which of them to be shown.
Here are the indicators included in this script:
- Ichimoku Cloud
- Bollinger Bands
- Moving Average 1
- Moving Average 2 (In case of detecting golden crosses or death crosses)
- Exponential Moving Average
- T3 Tillson
- MavilimW
Enjoy!

HARA's favorite indicator by Theo ParkThis indicator contains :
4 Ichimoku clouds
8 Moving Averages
1 Fibonacci Bollinger Bands
2 Normal Bollinger Bands
All-In-One Moving Average by Atilla YurtsevenHere are my favorite moving averages and i brought them together in a single script.
Supported moving averages:
Simple moving average
Exponential moving average
Weighted moving average
RSI moving average
Ranking (statistical) moving average
Linear moving average
Remember to follow me
Trade safe,
Atilla

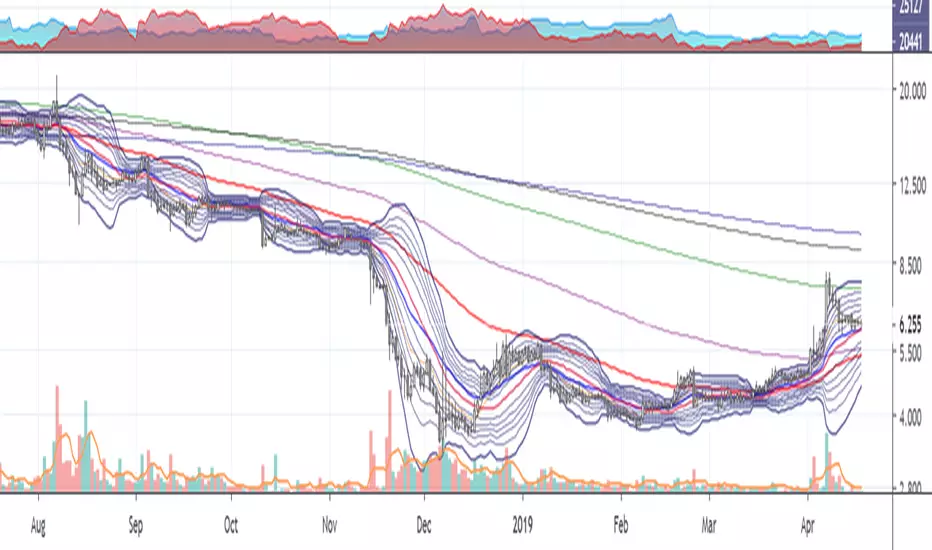
Multi SMA EMA WMA HMA BB (4x5 MAs Bollinger Bands) Adv MTF - RRBMulti SMA EMA WMA HMA 4x5 Moving Averages with Bollinger Bands Advanced MTF by RagingRocketBull 2019
Version 1.0
This indicator shows multiple MAs of any type SMA EMA WMA HMA etc with BB and MTF support, can show MAs as dynamically moving levels.
There are 4 MA groups + 1 BB group, a total of 4 TFs * 5 MAs = 20 MAs. You can assign any type/timeframe combo to a group, for example:
- EMAs 12,26,50,100,200 x H1, H4, D1, W1 (4 TFs x 5 MAs x 1 type)
- EMAs 8,10,13,21,30,50,55,100,200,400 x M15, H1 (2 TFs x 10 MAs x 1 type)
- D1 EMAs and SMAs 8,10,12,26,30,50,55,100,200,400 (1 TF x 10 MAs x 2 types)
- H1 WMAs 7,77,89,167,231; H4 HMAs 12,26,50,100,200; D1 EMAs 89,144,169,233,377; W1 SMAs 12,26,50,100,200 (4 TFs x 5 MAs x 4 types)
- +1 extra MA type/timeframe for BB
There are several versions: Simple, MTF, Pro MTF, Advanced MTF and Ultimate MTF. This is the Advanced MTF version. The Differences are listed below. All versions have BB
- Simple: you have 2 groups of MAs that can be assigned any type (5+5)
- MTF: +2 custom Timeframes for each group (2x5 MTF) +1 TF for BB, TF XY smoothing
- Pro MTF: 4 custom Timeframes for each group (4x3 MTF), 1 TF for BB, MA levels and show max bars back options
- Advanced MTF: +2 extra MAs/group (4x5 MTF), custom Ticker/Symbols, Timeframe <>= filter, Remove Duplicates Option
- Ultimate MTF: +individual settings for each MA, custom Ticker/Symbols
Features:
- 4x5 = 20 MAs of any type
- 4x MTF groups with XY step line smoothing
- +1 extra TF/type for BB MAs
- 4x5 = 20 MA levels with adjustable group offsets, indents and shift
- supports any existing type of MA: SMA, EMA, WMA, Hull Moving Average (HMA)
- custom tickers/symbols for each group - you can compare MAs of the same symbol across exchanges
- show max bars back option
- show/hide both groups of MAs/levels/BB and individual MAs
- timeframe filter: show only MAs/Levels with TFs <>= Current TF
- hide MAs/Levels with duplicate TFs
- support for custom TFs that are not available in free accounts: 2D, 3D etc
- support for timeframes in H: H, 2H, 4H etc
Notes:
- Uses timeframe textbox instead of input resolution dropdown to allow for 240 120 and other custom TFs
- Uses symbol textbox instead of input symbol to avoid establishing multiple dummy security connections to the current ticker - otherwise empty symbols will prevent script from running
- Possible reasons for missing MAs on a chart:
- there may not be enough bars in history to start plotting it. For example, W1 EMA200 needs at least 200 bars on a weekly chart.
- price << default Y smoothing step 5. For charts with low/fractional prices (i.e. 0.00002 << 5) adjust X Y smoothing as needed (set Y = 0.0000001) or disable it completely (set X,Y to 0,0)
- TradingView Replay Mode UI and Pinescript security calls are limited to TFs >= D (D,2D,W,MN...) for free accounts
- attempting to plot any TF < D1 in Replay Mode will only result in straight lines, but all TFs will work properly in history and real-time modes. This is not a bug.
- Max Bars Back (num_bars) is limited to 5000 for free accounts (10000 for paid), will show error when exceeded. To plot on all available history set to 0 (default)
- Slow load/redraw times. This indicator becomes slower, its UI less responsive when:
- Pinescript Node.js graphics library is too slow and inefficient at plotting bars/objects in a browser window. Code optimization doesn't help much - the graphics engine is the main reason for general slowness.
- the chart has a long history (10000+ bars) in a browser's cache (you have scrolled back a couple of screens in a max zoom mode).
- Reload the page/Load a fresh chart and then apply the indicator or
- Switch to another Timeframe (old TF history will still remain in cache and that TF will be slow)
- in max possible zoom mode around 4500 bars can fit on 1 screen - this also slows down responsiveness. Reset Zoom level
- initial load and redraw times after a param change in UI also depend on TF. For example:
D1/W1 - 2 sec, H1/H4 - 5-6 sec, M30 - 10 sec, M15/M5 - 4 sec, M1 - 5 sec.
M30 usually has the longest history (up to 16000 bars) and W1 - the shortest (1000 bars).
- when indicator uses more MAs (plots) and timeframes it will redraw slower. Seems that up to 5 Timeframes is acceptable, but 6+ Timeframes can become very slow.
- show_last=last_bars plot limit doesn't affect load/redraw times, so it was removed from MA plot
- Max Bars Back (num_bars) default/custom set UI value doesn't seem to affect load/redraw times
- In max zoom mode all dynamic levels disappear (they behave like text)
1. based on 3EmaBB, uses plot*, barssince and security functions
2. you can't set certain constants from input due to Pinescript limitations - change the code as needed, recompile and use as a private version
3. Levels = trackprice implementation
4. Show Max Bars Back = show_last implementation
5. swma has a fixed length = 4, alma and linreg have additional offset and smoothing params
6. Smoothing is applied by default for visual aesthetics on MTF. To use exact ma mtf values (lines with stair stepping) - disable it
Good Luck! You can explore, modify/reuse the code to build your own indicators.

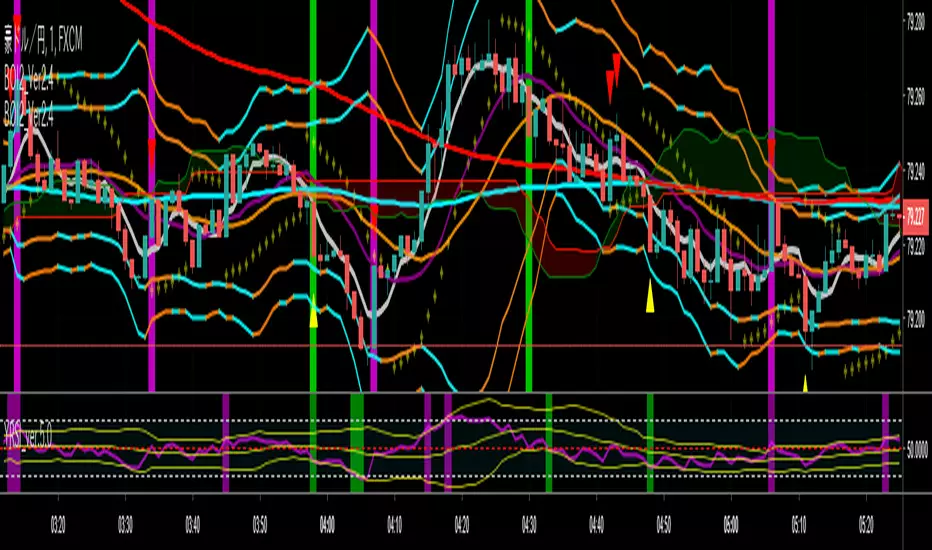
Contrarian Scalping Entry Support// @version=3
// Copyright @ ALEX SHORT
// Indicator Name : Contralian Scalping Entry Support
// alpha tester : Norakichi senpai (PRO TRADER)
// alpha tester : SHINNchan (Prop TRADER)
// Special Thanks WBZ Trading Group
// This indicator support "Contralian Scalping Entry" and "Find ideal Take-Profit point that just like Buying or Selling CLIMAX".
// Attension!!! I strongly reccomend to Verify effectiveness before "REAL TRADE".
// Note1. Downtrend often continue compared to uptrend. So, you might have to change DFMA setting for it. Or you should change reasons/grounds for Scalping Long Entry in long DownTrend.
// Note2. Before applying this indicator or switching resolution, please confirm DFMA resolution Setting. It can't chenge automatically.
// Function1. Difference from Moving Average Arrow from Multi_SMA
// This indicator will plot chart Arrow above or below candle stick when DFMA marked over range.
//
// Function2. When candle touch Quad_Bollinger band, background color will change.
// Function3.
// New Version is "v2.7.1"
1. You can switch Scalping / Swing Mode using by the checkbox. Each DFMA_#1 and #2 can apply different Alert Level.
2. QBB_Circle Alert displaying moved bottom in the main chart.

yutas_BOindicator2Ver .1.0
High-low sign indicator for binary option only.
バイナリーオプション専用ハイローサインインジケーター。
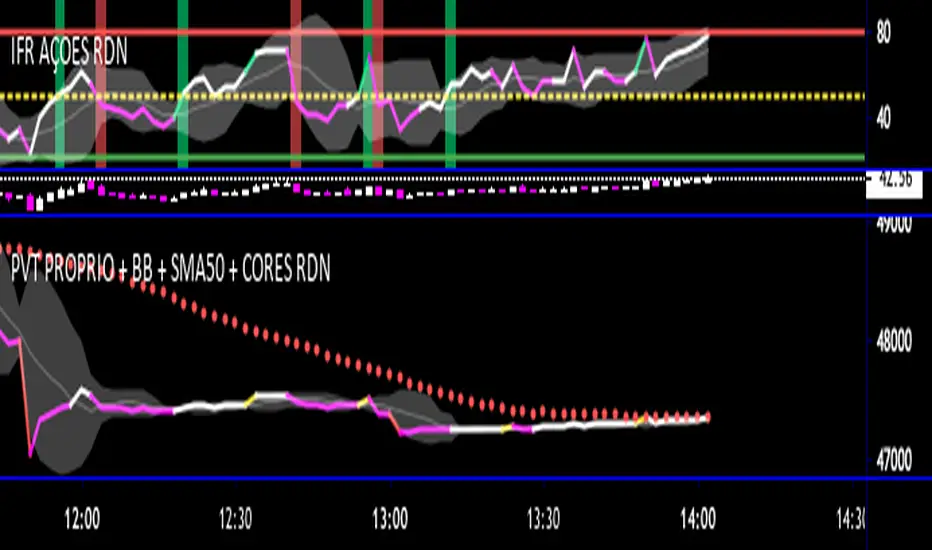
PVT + BB + Período Personalizado com cores RDNEste Script é personalizado. É um PVT com bandas de Bollinger que muda de cores os candles no gráfico e também a linha do PVT
Sugestões e maiores informações de uso adicione @rafdourado
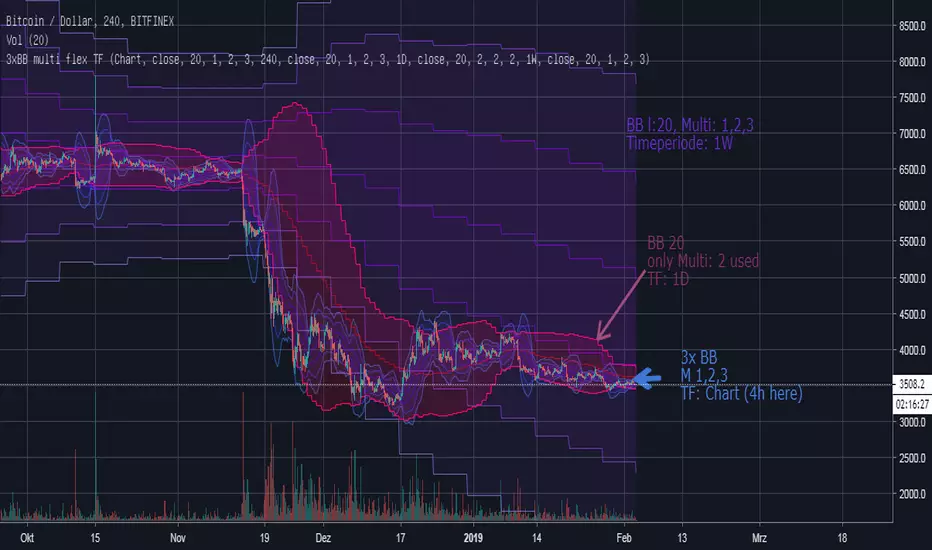
3xBB multi flex TF4 independent 3x Bollinger Bands
each of them hast the following parameterset (user inputs):
- Show/enable true/false: to de-/activate the 3xBB
- 3 diff Multiplier (set some of them to same values or disable some in style-menu to get a better overview)
- Length
- Source
- Timeframe/Resolution: "5","15","30","60", "240","360","720", "1D", "1W", "1M", "Chart"
To use the native chart time resolution select "Chart" as TimeFrame
Without any guarantee / warranty!
Please report bugs in comment section.