Parabolic SAR [Jwammo12]This is a different (dare I say, corrected?) version of the Parabolic SAR that doesn't use the current active close in its calculation. This changes the current SAR to only change when the extrema (high or low) changes.
the chart shows the difference between the built in SAR and the one I have modified.
Parabolik Bitiş ve Dönüş (PSAR)

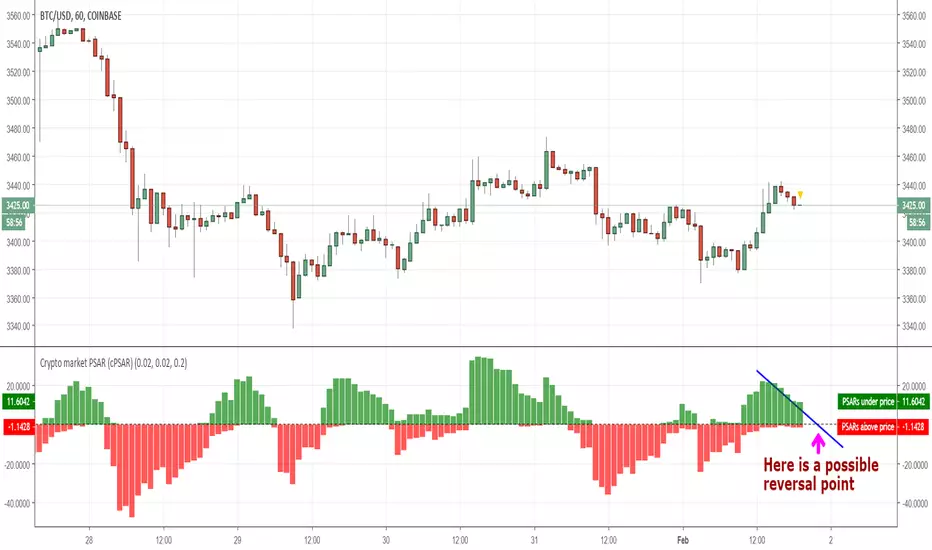
Crypto market PSAR (cPSAR)This indicator calculates the PSARs of the most liquid cryptocurrencies (as percent differences from the prices) and sums them together.
The PSARs under the closes, which act as support, are summed separately and shown in green. The PSARs over the closes (acting as resistance) are summed separately and shown in red.
The result is an indicator which can be interpreted somewhat like the RSI (but keep in mind that PSAR is a lagging indicator unlike the RSI which is a leading indicator). By interpreting this correctly you can - SOMETIMES - predict the short-term turns of the entire crypto market.
Many traders use the prices shown by PSAR (Parabolic Stop And Reverse) to set stop loss prices and/or to take profit and reverse their positions. This is why, on reversal of the PSARs (= when one of the red or green values becomes visibly larger than the other), a strong turning of the market can, sometimes, occur.
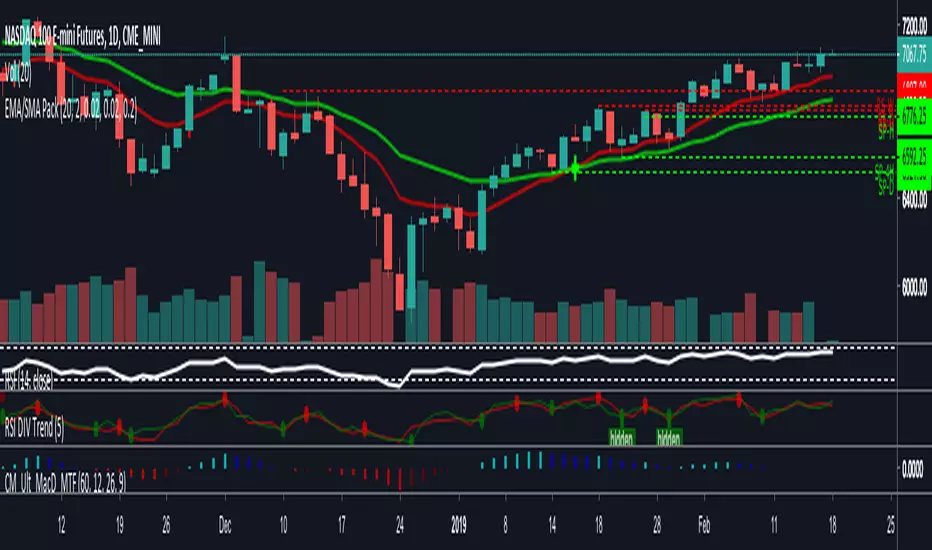
Trend Lines and MoreMulti-Indicator consisting of several useful indicators in a single package.
TREND LINES
-By default the 20 SMA and 50 SMA are shown.
-Use "MOVING AVERAGE TYPE" to select SMA, EMA, Double-EMA, Triple-EMA, or Hull.
-Use "50 MA TREND COLOR" to have the 50 turn green/red for uptrend/downtrend.
-Use "DAILY SOURCE ONLY" to always show daily averages regardless of timeframe.
-Use "SHOW LONG MA" to also include 100, 150, and 200 moving averages.
-Use "SHOW MARKERS" to show a small colored marker identifying which line is which.
OTHER INDICATORS
-You can show Bollinger Bands and Parabolic SAR.
-You can highlight key reversal times (9:50-10:10 and 14:40-15:00).
-You can show price offset markers, where was the price "n" periods ago.
That last one is useful to show the level of prices which are about to "fall off" the moving average
and be replaced with current price. So for example, if current price is significantly below the
200-days-ago price, you can gauge the difficulty for the 200 MA to start climbing again.

Kozlod - Parabolic SAR Strategy AlertsAlerts for standard Parabolic SAR Strategy.
It works best with "Once per bar" option.

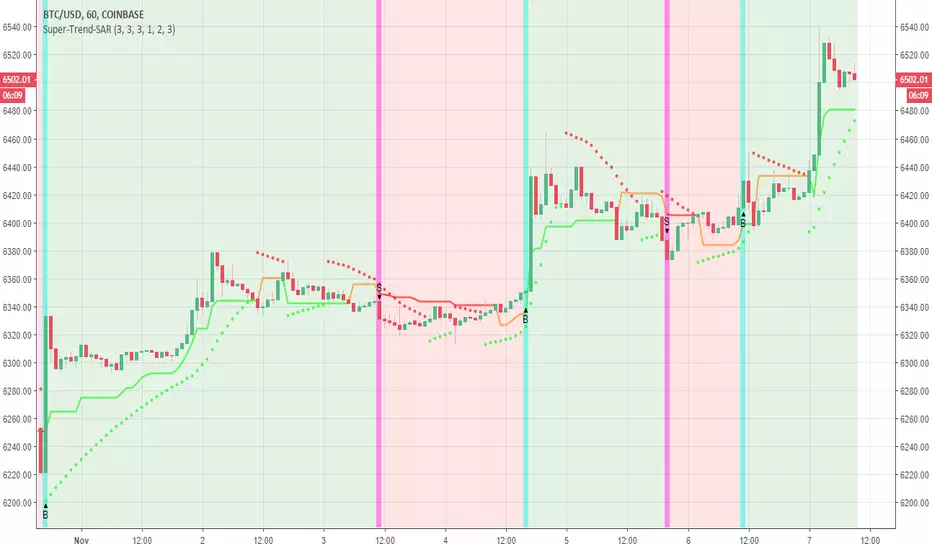
makemoneyThis system design for you in order to make you money :) I hope...
1. the donochian channel is based on color of high and low price (easy to see where the bars exist)
2. resitance and support are drawn by bolinger system (black and red dots)
3. buy and sell are based on volume model (B and S ) with alerts
4. when PSAR and the buy or sell are in agrreement this are called strong buy or sell points shown in green and red trinangle
5. you can use stop loss or take profit based on system in volume model
using the system very easy and I hope you make noney on it either shorting or longing
I normaly use 1 hour and 30 min charts . you can try another time frames if it work to you
the code is open so you can modify , chane or do what ever you want with it

poki buy and sell Take profit and stop lossThis indicator is based on modelius model of lazy bear weis model with ATR for the buy=B sell =S
in addition there is Take profit and stop loss in % both for short and for long
next stage is to know the resistance level and support based on bollinger marked in blue and red dots
Also included Parabolic Sar (blue and red dots rising up or down)
The color of bulish or bearish zone is based on the cross of Hull avreage and linear regression ( for each time set may need different setting for accuracy )
So how to use this scrupt to better profit
1. if you have B signal and its on lower support level then its good starting place for buy. look at the Parabolic Sar if its in agreement. The exit can be either by S =sell, Take profit that you decide on % or by end of Parabolic SAR upward
2. exact the oposite for short
Play with setting for the desired results or change modify this script for your purpose

Pivot Boss 4 EMA + Bollinger Bands + Parabolic SARA combination of some of my favorite indicators.
All credit to original authors.
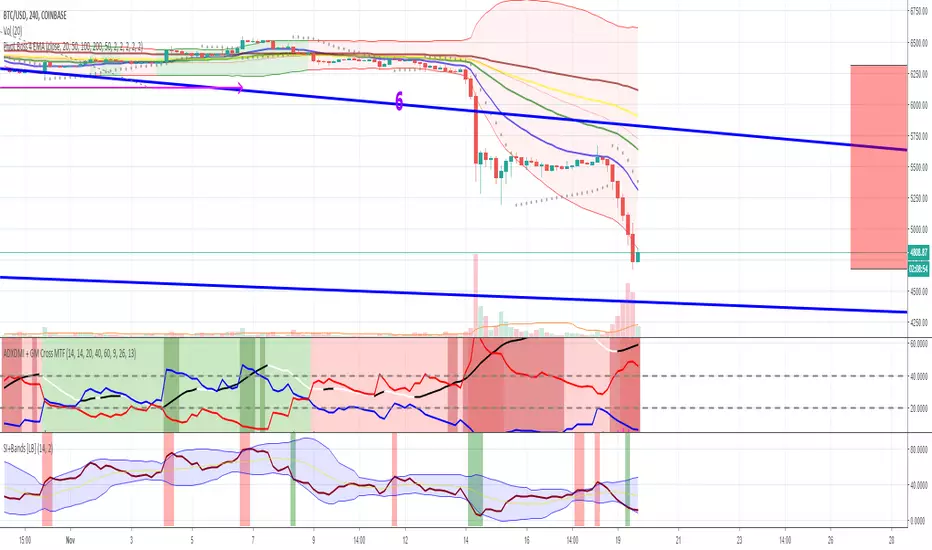
Combo Basic IndicatorsThe indicator consists of multiple time frame SMA and PSAR, the very basic indicator but could be profitable.
SMA can be used as dynamic Support-Resistant levels, and value of higher time frame are considered more significant (major level).
For example, Bitcoin currently has weekly support at 6568$, and regarding to SMA of lower time frame (Day, 4H,..) that are near then concluded as sideways condition.
However, trading opportunities still can be found for short term and tight range (scalping).

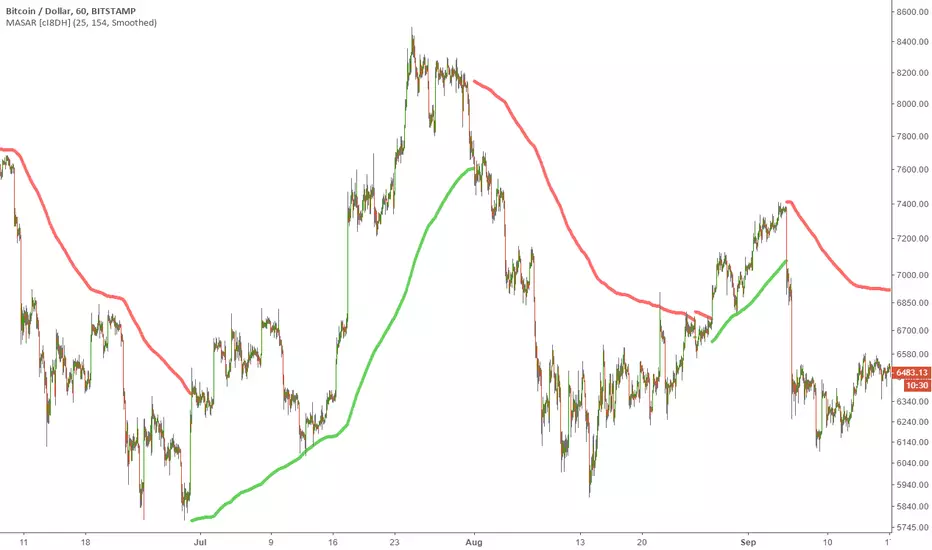
Moving Average Stop and Reverse (MASAR) [cI8DH]This indicator is an alternative to Parabolic Stop and Reverse indicator. It is primarily used to identify points of potential stops and reverses.
Instead of using a static parabolic curve, this indicator adjusts dynamically based on the changes in moving average of the price. Read here to learn more about the usage of this indicator .
I tested the strategy version of this indicator on Bitstamp:BTCUSD and compared the results to the Parabolic SAR. I changed the settings on both indicators to achieve the best results on each indicator. This indicator outperformed the Parabolic SAR by a large margin.
You need to calibrate the indicator depending on the asset and time frame. It works best in trending markets.


LinearSARThis is colur coding of linear model and Sar . it good for a template to make upon it better models
also it a great model for long or short on bitmex
so have fun


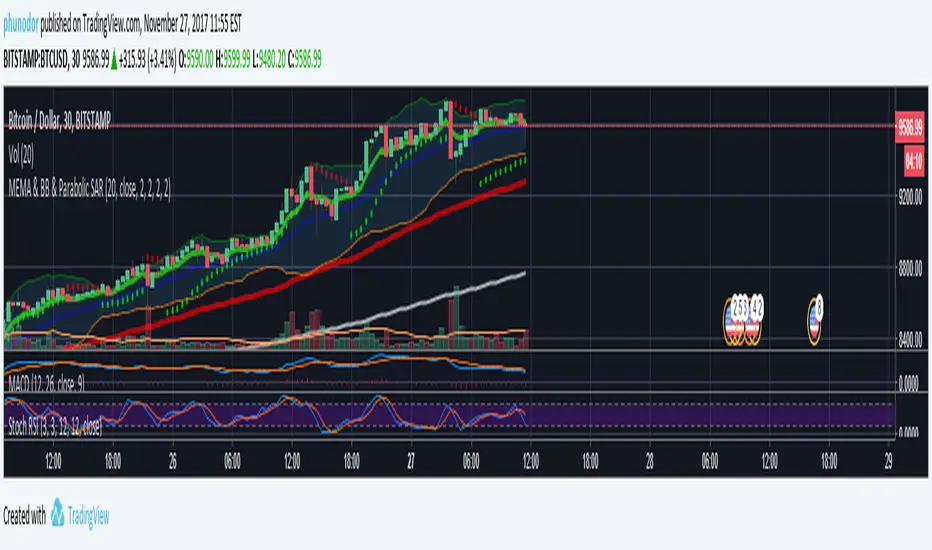
MEMA & BB & Parabolic SARMultiple Exponential Moving Average : 7, 77, 231
Bollinger Bands
Parabolic SAR
SMACH Indicator v1.0SMACH Indicator uses 3 signals from MACD, STOCHASTIC and PARABOLIC SAR.
Histogram represents trend direction. If it is greater than 2 or lesser than -2 trend is consolidated and you can trade.
I'm the author of this simple indicator. Feel free to use it as you want.
Follow me on Trading View if you want to be updated on more ideas. Thanks!

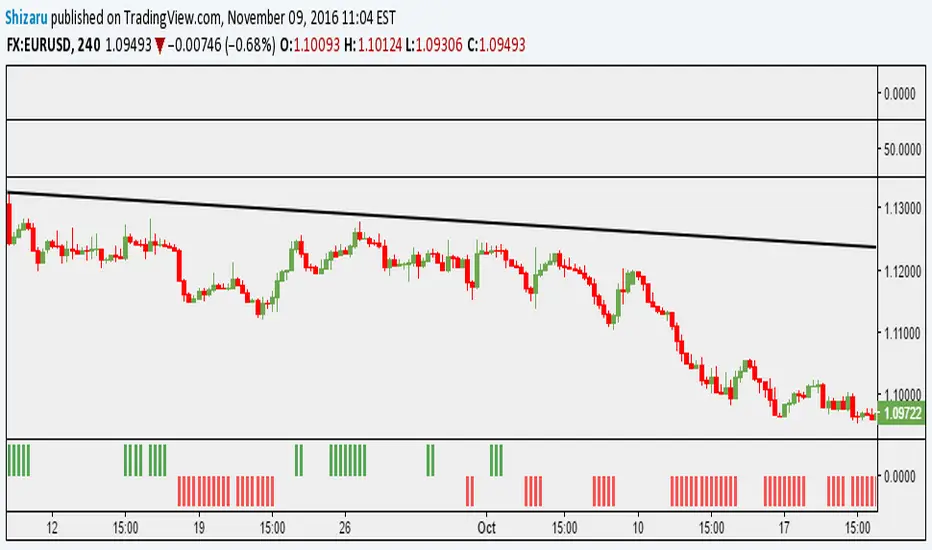
Simple Buy/Sell IndicatorThe original script was posted on ProRealCode by user Doctrading.
This little and simple code allows you to draw an indicator, which show you when buy or sell conditions are met.
For "buy" conditions, I did just set :
close > MM200
close > Parabolic SAR
MACD > 0
RSI7 > 50
For "sell" conditions : the opposite.
Of course, you can set what you want, in order to test your strategies.
Of course, to be profitable, you must also set your trading rules (entry, stop loss, trailing stop, take profit, etc.)
It's only an indicator, which doesn't show entry or exit rules.
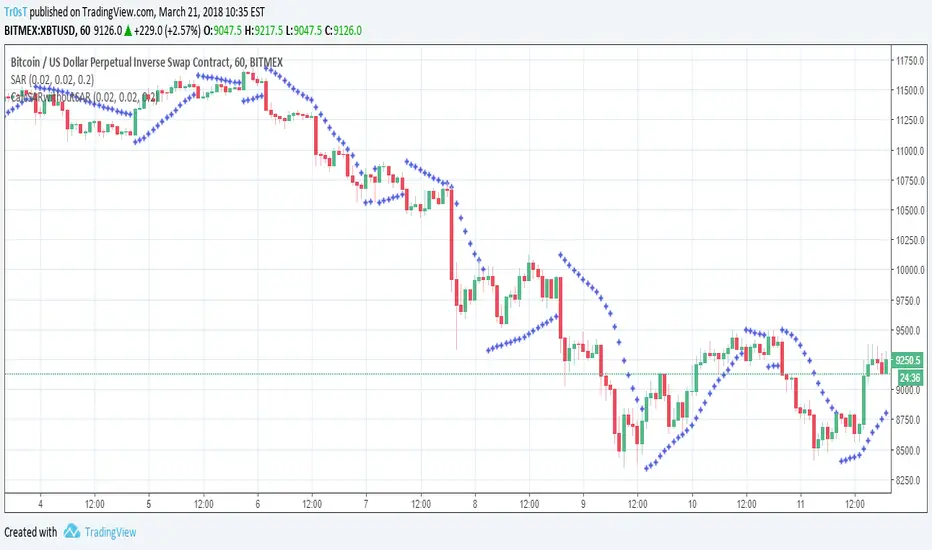
Parabolic GlitterThis indicator overlays a series of Parabolic Stop And Reverses (SARs) to continuously illustrate trends as they form in addition to a range of good possible levels at which to place stop orders.
The Initial Start argument gives the minimum value for the SAR function's "Start" argument. The Increment/Start Ratio argument gives the ratio of the SAR function's "Increment" and "Start" arguments (i.e. SAR default is Start = 0.02, Increment = 0.02, therefore Increment/Start Ratio = 1). The same logic applies to the Max/Start Ratio Argument (i.e. SAR default is Start = 0.02, Max = 0.2, therefore Max/Start Ratio = 10).
The Adaptive Coloring argument determines whether the plotting points are red in downtrends and green in uptrends, or if all the plotted points are given the same color (defaults to silver).

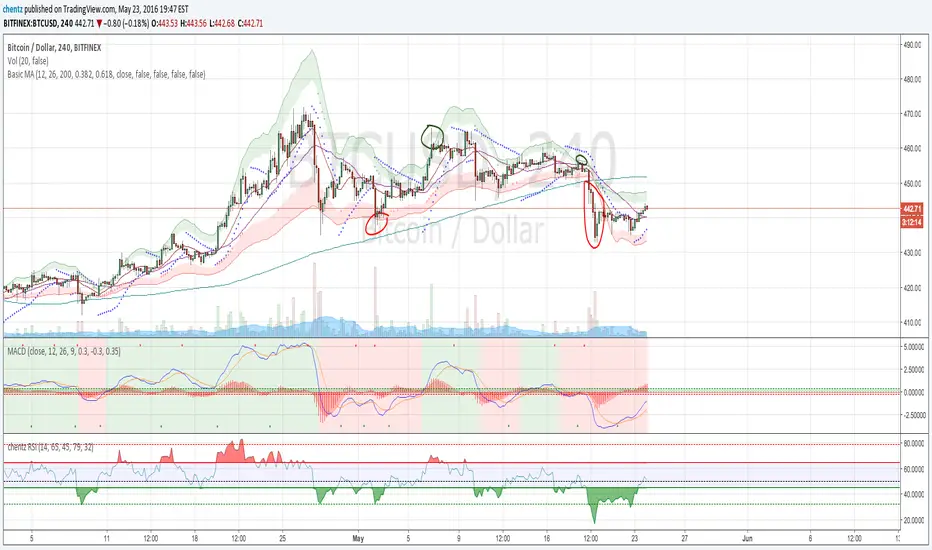
Basic MAAll-in-one basic indicators:
- MA Fast (12)
- MA Medium (26)
- MA Slow (200)
- Parabolic SAR www.investopedia.com
- Dynamic Fibonnaci channel with 2 channels - www.forexstrategiesresources.com
Parabolic StopParbolic Stop is a mix between the indicator Parabolic SAR, Volatility Stop and an SMA.
The goal of this indicator is to place your stop loss in an optimized spot. You can also combine the indicator switch from different timeframes to get buy or sell signal.
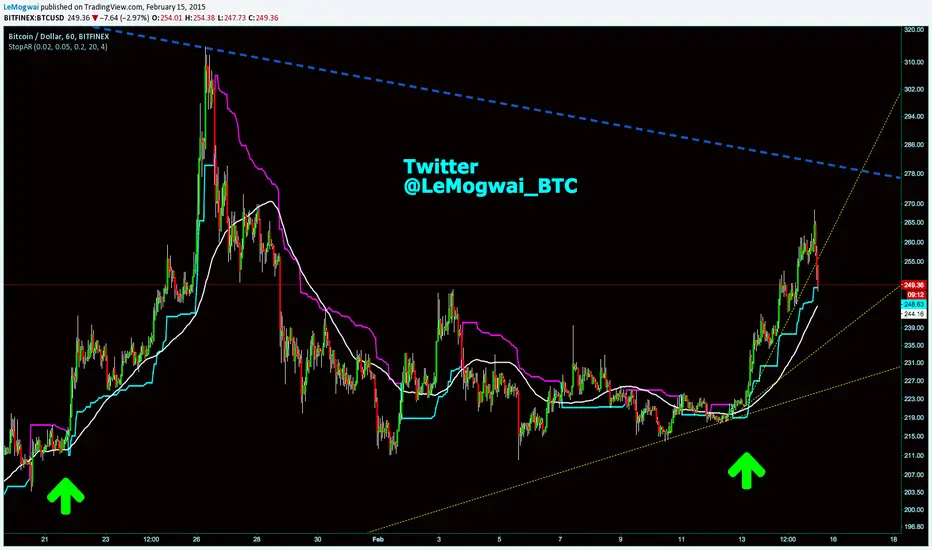
CM_Parabolic SAREnhanced Parabolic Sar
Simply Enhances Default Parabolic SAR by creating Two Color Options, One for UpTrend, Other for DownTrend
Ability To Turn On/Off The Up Trending Parabolic SAR, And The Down Trending Parabolic SAR
Great Indicator For Trailing Stops.
