Parabolic CCI Pro — Long & Short + ATR Risk — [AlphaFinansData]English Description (Enhanced)
🔹 CCI + Parabolic SAR Strategy (Long & Short, Smart Risk Management)
This indicator combines the power of CCI (Commodity Channel Index) and Parabolic SAR, creating a highly reliable trading system that adapts to market conditions.
🚀 How It Works:
Trend Hunting: CCI detects weakening momentum and potential reversal zones.
Confirmation: Parabolic SAR confirms the trend direction, reducing false signals.
Smart Risk Management: Offers both fixed-percentage and ATR-based dynamic Stop Loss & Take Profit, adjusting to volatility automatically.
Performance Dashboard: Tracks win rate, average profit/loss, max drawdown, and winning/losing streaks for deeper strategy insights.
⚡ Who Is It For?
Day traders looking for quick entries and exits,
Swing traders seeking to capture trend reversals,
Risk-conscious investors who want disciplined SL/TP management.
💡 More than just a signal generator, this indicator provides traders with a structured trading framework that helps maintain consistency and discipline.
Göstergeler ve stratejiler

Harmonic Patterns + Fib [CRT Trader]Overview
The Harmonic Patterns Fibonacci indicator is an advanced technical analysis tool designed to automatically detect and visualize Fibonacci-based harmonic patterns on financial charts. This indicator helps traders identify high-probability reversal zones and potential entry/exit points based on precise mathematical relationships.
Supported Patterns
5-Point Patterns (X-A-B-C-D Structure)
Gartley Pattern: The most common harmonic pattern with reliable reversal signals
AB/XA = 0.618, BC/AB = 0.618, CD/BC = 1.272, AD/XA = 0.786
Butterfly Pattern: Strong reversal pattern indicating potential trend changes
AB/XA = 0.786, BC/AB = 0.618, CD/BC = 1.618, AD/XA = 1.270
Bat Pattern: Medium-term reversal pattern with high accuracy
AB/XA = 0.382, BC/AB = 0.886, CD/BC = 1.618, AD/XA = 0.886
Crab Pattern: Aggressive reversal pattern with extended D point
AB/XA = 0.618, BC/AB = 0.886, CD/BC = 2.240, AD/XA = 1.618
Shark Pattern: Trend continuation or reversal pattern
AB/XA = 0.618, BC/AB = 1.130, CD/BC = 1.618, AD/XA = 0.886
4-Point Pattern (A-B-C-D Structure)
ABCD Pattern: Basic harmonic structure forming the foundation of all patterns
BC/AB = 0.382-0.886, CD/BC = 1.130-2.618
Key Features
Fibonacci Validation
Each pattern is validated against precise Fibonacci ratios with customizable tolerance
Mathematical accuracy ensures reliable pattern recognition
Eliminates false signals through strict ratio requirements
Performance Optimization
Pivot Detection: Automatically identifies significant highs and lows
Scan Frequency Control: Adjustable scanning intervals to optimize performance
Early Exit Algorithms: Efficient computation to reduce processing load
Pattern Limit: Control maximum number of patterns displayed
Visual Elements
Pattern Lines: Clear visualization of pattern structure with colored lines
Fill Areas: Highlighted zones between pattern legs
Point Labels: X, A, B, C, D markers for easy identification
Fibonacci Levels: Optional Fibonacci retracement/extension levels
Bullish/Bearish Colors: Green for bullish, red for bearish patterns
Customizable Settings
Pattern Selection: Enable/disable specific pattern types
Tolerance Adjustment: Fine-tune pattern recognition sensitivity (5-30%)
Color Customization: Personalize visual appearance
Information Table: Optional statistics display
Trading Applications
Entry Signals
Reversal Zones: Identify high-probability reversal areas at pattern completion
Confluence Trading: Combine with other technical indicators for confirmation
Risk Management: Use pattern structure to define stop-loss levels
Market Analysis
Support/Resistance: Pattern points often act as future S/R levels
Price Targets: Fibonacci extensions provide potential profit targets
Market Structure: Understand underlying market geometry and rhythm
Strategy Integration
Swing Trading: Ideal for medium-term position entries
Position Trading: Long-term trend reversal identification
Day Trading: Intraday reversal patterns on lower timeframes
How to Use
Add to Chart: Apply the indicator to any timeframe and instrument
Configure Settings: Adjust tolerance, colors, and pattern types as needed
Wait for Completion: Patterns are valid only when D point is formed
Confirm with Volume: Look for volume confirmation at pattern completion
Set Stop Loss: Place stops beyond X point for 5-point patterns, or A point for ABCD
Target Levels: Use Fibonacci extensions for profit targets
Important Notes
Pattern Completion: Wait for full pattern formation before taking action
Market Context: Consider overall market trend and conditions
Risk Management: Always use appropriate position sizing and stops
Backtesting: Test the indicator on historical data before live trading
Multiple Timeframes: Analyze patterns across different timeframes for confirmation
Technical Requirements
Lookback Period: Adjustable pivot detection sensitivity
Depth Setting: Controls how far back the algorithm searches for patterns
Memory Efficient: Optimized for real-time performance without lag
This indicator is suitable for all experience levels, from beginners learning harmonic patterns to advanced traders seeking automated pattern recognition. The combination of mathematical precision and visual clarity makes it an essential tool for harmonic trading strategies.

Fibonacci Sequence Circles [BigBeluga]🔵 Overview
The Fibonacci Sequence Circles is a unique and visually intuitive indicator designed for the TradingView platform. It combines the principles of the Fibonacci sequence with geometric circles to help traders identify potential support and resistance levels, as well as price expansion zones. The indicator dynamically anchors to key price points, such as pivot highs, pivot lows, or timeframe changes (daily, weekly, monthly), and generates Fibonacci-based circles around these anchor points.
⚠️For proper indicators visualization use simple not logarithmic chart
🔵 Key Features
Customizable Anchor Points : The indicator can be anchored to Pivot Highs , Pivot Lows , or timeframe changes ( Daily, Weekly, Monthly ), making it adaptable to various trading strategies.
Fibonacci Sequence Logic : The circles are generated using the Fibonacci sequence, where the diameter of each circle is the sum of the diameters of the two preceding circles.
first = start_val
secon = start_val + int(start_val/2)
three = first + secon
four = secon + three
five = three + four
six = four + five
seven = five + six
eight = six + seven
nine = seven + eight
ten = eight + nine
Adjustable Start Value : Traders can modify the starting value of the sequence to scale the circles larger or smaller, ensuring they fit the current price action.
Color Customization : Each circle can be individually enabled or disabled, and its color can be customized for better visual clarity.
Visual Labels : The diameter of each circle (in bars) is displayed next to the circle, providing additional context for analysis.
🔵 Usage
Step 1: Set the Anchor Point - Choose the anchor type ( Pivot High, Pivot Low, Daily, Weekly, Monthly ) to define the center of the Fibonacci circles.
Step 2: Adjust the Start Value - Modify the starting value of the Fibonacci sequence to scale the circles according to the price action.
Step 3: Customize Circle Colors - Enable or disable specific circles and adjust their colors for better visualization.
Step 4: Analyze Price Action - Use the circles to identify potential support/resistance levels, price expansion zones, or trend continuation areas.
Step 5: Combine with Other Tools - Enhance your analysis by combining the indicator with other technical tools like trendlines, moving averages, or volume indicators.
The Fibonacci Sequence Circles is a powerful and flexible tool for traders who rely on Fibonacci principles and geometric patterns. Its ability to anchor to key price points and dynamically scale based on market conditions makes it suitable for various trading styles and timeframes. Whether you're a day trader or a long-term investor, this indicator can help you visualize and anticipate price movements with greater precision.

Reverse RSI Signals [AlgoAlpha]🟠 OVERVIEW
This script introduces the Reverse RSI Signals system, an original approach that inverts traditional RSI values back into price levels and then overlays them directly on the chart as dynamic bands. Instead of showing RSI in a subwindow, the script calculates the exact price thresholds that correspond to common RSI levels (30/70/50) and displays them as upper, lower, and midline bands. These are further enhanced with an adaptive Supertrend filter and divergence detection, allowing traders to see overbought/oversold zones translated into actionable price ranges and trend signals. The script combines concepts of RSI inversion, volatility envelopes, and divergence tracking to provide a context-driven tool for spotting reversals and regime shifts.
🟠 CONCEPTS
The script relies on inverting RSI math: by solving for the price that would yield a given RSI level, it generates real chart levels tied to oscillator conditions. These RSI-derived price bands act like support/resistance, adapting each bar as RSI changes. On top of this, a Supertrend built around the RSI midline introduces directional bias, switching regimes when the midline is breached. Regular bullish and bearish divergences are detected by comparing RSI pivots against price pivots, highlighting early reversal conditions. This layered approach means the indicator is not just RSI on price but a hybrid of oscillator translation, volatility-tracking midline envelopes, and divergence analysis.
🟠 FEATURES
Inverted RSI bands: upper (70), lower (30), and midline (50), smoothed with EMA for noise reduction.
Supertrend overlay on the RSI midline to confirm regime direction (bullish or bearish).
Gradient-filled zones between outer and inner RSI bands to visualize proximity and exhaustion.
Non-repainting bullish and bearish divergence markers plotted directly on chart highs/lows.
🟠 USAGE
Apply the indicator to any chart and use the plotted RSI price bands as adaptive support/resistance. The midline defines equilibrium, while upper and lower bands represent classic RSI thresholds translated into real price action. In bullish regimes (green candles), long trades are stronger when price approaches or bounces from the lower band; in bearish regimes (red candles), shorts are favored near the upper band. Divergence markers (▲ for bullish, ▼ for bearish) flag potential reversal points early. Traders can combine the band proximity, divergence alerts, and Supertrend context to time entries, exits, or to refine ongoing trend trades. Adjust smoothing and Supertrend ATR settings to match the volatility of the instrument being analyzed.

Infinite EMA with Alpha Control♾️ Infinite EMA with Alpha Control
What Makes This EMA "Infinite"?
Unlike traditional EMA indicators that are limited to typical periods (1-5000), this Infinite EMA breaks all boundaries. You can create EMAs with periods of 1,000, 10,000, or even 1,000,000 bars - that's why it's called "infinite"! Also Infinite EMA starts working immediately from the very first bar on your chart
Why This EMA is "Infinite":
1. Mathematically: When N → ∞, alpha → 0, meaning infinitely long "memory"
2. Practically: You can set any period - even 100,000 bars
3. Flexibility: Alpha allows precise control over the "forgetting speed"
How Does It Work?
The magic lies in the Alpha parameter. While regular EMAs use fixed formulas, this indicator gives you direct control over the EMA's "memory" through Alpha values:
• High Alpha (0.1-0.2): Fast reaction, short memory
• Medium Alpha (0.01-0.05): Balanced response
• Low Alpha (0.0001-0.001): Extremely slow reaction, very long memory
• Ultra-low Alpha (0.000001): Almost frozen in time
The Mathematical Formula:
Alpha = 2 / (Period + 1)
This means you can achieve any EMA period by adjusting Alpha, giving you infinite flexibility!
Expanded "Infinite EMA" Table:
Period EMA (N) - Alpha (Rounded) - Alpha (Exact) - Description
10 - 0.1818 - 0.181818... - Fast EMA
20 - 0.0952 - 0.095238... - Short-term
50 - 0.0392 - 0.039215... - Medium-term
100 - 0.0198 - 0.019801... - Long-term
200 - 0.0100 - 0.009950... - Standard long-term
500 - 0.0040 - 0.003996... - Very long-term
1,000 - 0.0020 - 0.001998... - Super long-term
2,000 - 0.0010 - 0.000999... - Ultra long-term
5,000 - 0.0004 - 0.000399... - Mega long-term
10,000 - 0.0002 - 0.000199... - Giga long-term
25,000 - 0.00008 - 0.000079... - Century-scale EMA
50,000 - 0.00004 - 0.000039... - Practically motionless
100,000 - 0.00002 - 0.000019... - "Glacial" EMA
500,000 - 0.000004 - 0.000003... - Geological timescale
1,000,000 - 0.000002 - 0.000001... - Approaching constant
5,000,000 - 0.0000004 - 0.0000003... - Virtually static
10,000,000 - 0.0000002 - 0.0000001... - Nearly flat line
100,000,000 - 0.00000002 - 0.00000001... - Mathematical infinity
Formula: Alpha = 2/(N+1) where N is the EMA period
Key Features:
Dual EMA System: Run fast and slow EMAs simultaneously
Crossover Signals: Automatic buy/sell signals with customizable alerts
Alpha Control: Direct mathematical control over EMA behavior
Infinite Periods: From 1 to 100,000,000+ bars
Visual Customization: Colors, fills, backgrounds, signal sizes
Instant Start: Works accurately from the very first bar
Update Intervals: Control calculation frequency for noise reduction
Why Choose Infinite EMA?
1. Unlimited Flexibility: Any period you can imagine
2. Mathematical Precision: Direct alpha control for exact behavior
3. Professional Grade: Suitable for all trading styles
4. Easy to Use: Simple settings with powerful results
5. No Warm-up Period: Accurate values from bar #1
Simple Explanation:
Think of EMA as a "memory system":
• High Alpha = Short memory (forgets quickly, reacts fast)
• Low Alpha = Long memory (remembers everything, moves slowly)
With Infinite EMA, you can set the "memory length" to anything from seconds to centuries!
⚡ Instant Start Feature - EMA from First Bar
Immediate Calculation from Bar #1
Unlike traditional EMA indicators that require a "warm-up period" of N bars before showing accurate values, Infinite EMA starts working immediately from the very first bar on your chart.
How It Works:
Traditional EMA Problem:
• Standard 200-period EMA: Needs 200+ bars to become accurate
• First 200 bars: Shows incorrect/unstable values
• Result: Large portions of historical data are unusable
Infinite EMA Solution:
Bar #1: EMA = Current Price (perfect starting point)
Bar #2: EMA = Alpha × Price + (1-Alpha) × Previous EMA
Bar #3: EMA = Alpha × Price + (1-Alpha) × Previous EMA
...and so on
Key Benefits:
No Warm-up Period: Start trading signals from day one
Full Chart Coverage: Every bar has a valid EMA value
Historical Accuracy: Backtesting works on entire dataset
New Markets: Works perfectly on newly listed assets
Short Datasets: Effective even with limited historical data
Practical Impact:
Scenario Traditional EMA Infinite EMA
New cryptocurrency Unusable for first 200 days ✅ Works from day 1
Limited data (< 200 bars) Inaccurate values ✅ Fully functional
Backtesting Must skip first 200 bars ✅ Test entire history
Real-time trading Wait for stabilization ✅ Trade immediately
Technical Implementation:
if barstate.isfirst
EMA := currentPrice // Perfect initialization
else
EMA := alpha × currentPrice + (1-alpha) × previousEMA
This smart initialization ensures mathematical accuracy from the very first calculation, eliminating the traditional EMA "ramp-up" problem.
Why This Matters:
For Backesters: Use 100% of available data
For Live Trading: Get signals immediately on any timeframe
For Researchers: Analyze complete datasets without gaps
Bottom Line: Infinite EMA is ready to work the moment you add it to your chart - no waiting, no warm-up, no exceptions!
Unlike traditional EMAs that require a "warm-up period" of 200+ bars before showing accurate values, Infinite EMA starts working immediately from bar #1.
This breakthrough eliminates the common problem where the first portion of your chart shows unreliable EMA data. Whether you're analyzing a newly listed cryptocurrency, working with limited historical data, or backtesting strategies, every single bar provides mathematically accurate EMA values.
No more waiting periods, no more unusable data sections - just instant, reliable trend analysis from the moment you apply the indicator to any chart.
🔄 Update Interval Bars Feature
The Update Interval feature allows you to control how frequently the EMA recalculates, providing flexible noise filtering without changing the core mathematics.
Set to 1 for standard behavior (updates every bar), or increase to 5-10 for smoother signals that update less frequently. Higher intervals reduce market noise and false signals but introduce slightly more lag. This is particularly useful on volatile timeframes where you want the EMA's directional bias without every minor price fluctuation affecting the calculation.
Perfect for swing traders who prefer cleaner, more stable trend lines over hyper-responsive indicators.
Conclusion
The Infinite EMA transforms the traditional EMA from a fixed-period tool into a precision instrument with unlimited flexibility. By understanding the Alpha-Period relationship, traders can create custom EMAs that perfectly match their trading style, timeframe, and market conditions.
The "infinite" nature comes from the ability to set any period imaginable - from ultra-fast 2-bar EMAs to glacially slow 10-million-bar EMAs, all controlled through a single Alpha parameter.
________________________________________
Whether you're a beginner looking for simple trend following or a professional researcher analyzing century-long patterns, Infinite EMA adapts to your needs. The power of infinite periods is now in your hands! 🚀
Go forward to the horizon. When you reach it, a new one will open up.
- J. P. Morgan

Auto Trend Lines v1.0 This advanced Pine Script indicator automatically detects and draws support and resistance trendlines for any instrument based on two independent lookback periods—short-term and long-term—making it suitable for all types of traders. The indicator identifies pivot highs and lows for both user-configurable lookback lengths, draws trendlines from each anchor point to the current bar, and supports a visually intuitive chart by coloring and labeling each line type separately.
Key features:
Dual lookback: Choose separate short-term and long-term sensitivity for pivots and trendlines.
Customizable: Select the number of displayed lines, colors, and line widths to suit your preferences.
Auto-updating: Trendlines update dynamically with new pivots and extend to the latest bar.
This indicator is ideal for those who want to automate trendline analysis, spot key breakout and reversal areas, and streamline technical trading.

Mikula's Master 360° Square of 12Mikula’s Master 360° Square of 12
An educational W. D. Gann study indicator for price and time. Anchor a compact Square of 12 table to a start point you choose. Begin from a bar’s High or Low (or set a manual start price). From that anchor you can progress or regress the table to study how price steps through cycles in either direction.
What you’re looking at :
Zodiac rail (far left): the twelve signs.
Degree rail: 24 rows in 15° steps from 15° up to 360°/0°.
Transit rail and Natal rail: track one planet per rail. Each planet is placed at its current row (℞ shown when retrograde). As longitude advances, the planet climbs bottom → top, then wraps to the bottom at the next sign; during retrograde it steps downward.
Hover a planet’s cell to see a tooltip with its exact longitude and sign (e.g., 152.4° ♌︎). The linked price cell in the grid moves with the planet’s row so you can follow a planet’s path through the zodiac as a path through price.
Price grid (right): the 12×24 Square of 12. Each column is a cycle; cells are stepped price levels from your start price using your increment.
Bottom rail: shows the current square number and labels the twelve columns in that square.
How the square is read
The square always begins at the bottom left. Read each column bottom → top. At the top, return to the bottom of the next column and read up again. One square contains twelve cycles. Because the anchor can be a High or a Low, you can progress the table upward from the anchor or regress it downward while keeping the same bottom-to-top reading order.
Iterate Square (shifting)
Iterate Square shifts the entire 12×24 grid to the next set of twelve cycles.
Square 1 shows cycles 1–12; Square 2 shows 13–24; Square 3 shows 25–36, etc.
Visibility rules
Pivot cells are table-bound. If you shift the square beyond those prices, their highlights won’t appear in the table.
A/B levels and Transit/Natal planetary lines are chart overlays and can remain visible on the table as you shift the square.
Quick use
Choose an anchor (date/time + High/Low) or enable a manual start price .
Set the increment. If you anchored with a Low and want the table to step downward from there, use a negative value.
Optional: pick Transit and Natal planets (one per rail), toggle their plots, and hover their cells for longitude/sign.
Optional: turn on A/B levels to display repeating bands from the start price.
Optional: enable swing pivots to tint matching cells after the anchor.
Use Iterate Square to shift to later squares of twelve cycles.
Examples
These are exploratory examples to spark ideas:
Overview layout (zodiac & degree rails, Transit/Natal rails, price grid)
A-levels plotted, pivots tinted on the table, real-time price highlighted
Drawing angles from the anchor using price & time read from the table
Using a TradingView Gann box along the A-levels to study reactions
Attribution & originality
This script is an original implementation (no external code copied). Conceptual credit to Patrick Mikula, whose discussion of the Master 360° Square of 12 inspired this study’s presentation.
Further reading (neutral pointers)
Patrick Mikula, Gann’s Scientific Methods Unveiled, Vol. 2, “W. D. Gann’s Use of the Circle Chart.”
W. D. Gann’s Original Commodity Course (as provided by WDGAN.com).
No affiliation implied.
License CC BY-NC-SA 4.0 (non-commercial; please attribute @Javonnii and link the original).
Dependency AstroLib by @BarefootJoey
Disclaimer Educational use only; not financial advice.

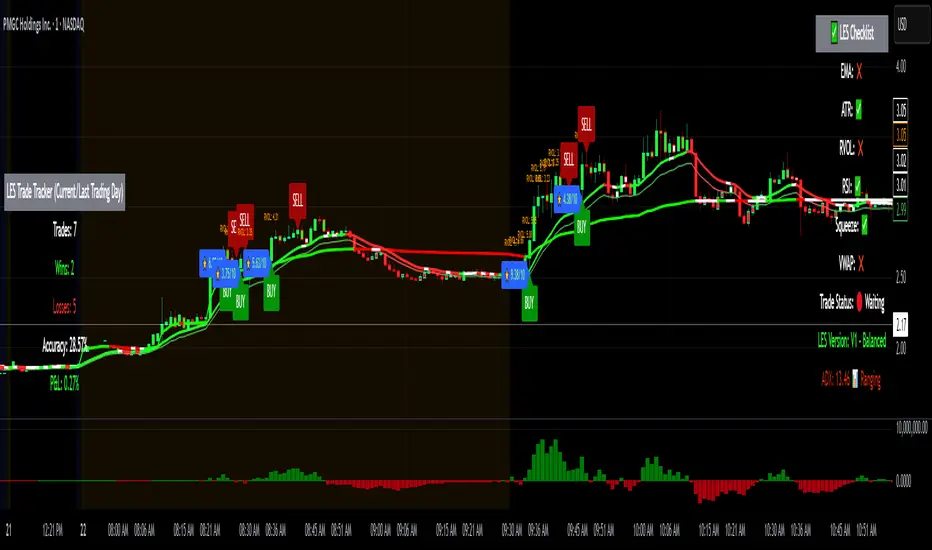
Long Elite Squeeze (LES) — H.H 22 Lindsay (AI)LES (Long Elite Squeeze)
LES (Long Elite Squeeze) is a trading framework designed to capture the highest-probability long setups. It’s not just another signal script — it’s a structured system built to filter noise, manage risk, and keep you aligned with real momentum.
🔹 Core Logic
Breakout Confirmation – Ensures moves have structure, not just random spikes.
Relative Volume (RVOL) – Confirms participation and fuel behind the move.
RSI Alignment – Avoids overextended traps and fakeouts.
Squeeze Momentum – The backbone of LES. Signals fire only after a defined squeeze pattern shift (6+ dark green bars followed by a light green bar).
🔹 Trade Management Built In
Automated Sell Signals – Trigger on either:
2 consecutive dark green bars on Squeeze Momentum
WaveTrend cross down
(only valid after a Buy signal — no random shorts)
HUD Entry Checklist – Live conditions shown on chart.
Status Tracker HUD – Flips between “Waiting for Entry” and “In Trade” for clear context.
🔹 Flexibility
3 switchable squeeze versions (V1, V2, V3) for different market conditions.
Customizable EMA & ATR settings (with color options).
Session-aware logic — filter signals to prime trading hours.
🔹 Blueprint & Credits
LES is a fusion of proven concepts, standing on the shoulders of respected creators:
-Squeeze Momentum – LazyBear
-WaveTrend Oscillator – LazyBear
-Relative Volume – LonesomeTheBlue
Breakout/structural logic – refined from classic frameworks
Their work laid the foundation — LES expands and integrates them into a complete trading system.
⚡ Why LES Stands Out
LES wasn’t coded overnight. It’s the result of countless hours of live testing, rebuilding, and refining. Every feature earned its place by proving value in real trading, not theory.
LES is more than an indicator. It’s a disciplined framework — crafted to turn chaos into structure, randomness into probability, and noise into clarity.
⚠️ Disclaimer: This is a trading framework, not financial advice. Performance depends on trader discipline, risk management, and market conditions.
Volumetric Support and Resistance [BackQuant]Volumetric Support and Resistance
What this is
This Overlay locates price levels where both structure and participation have been meaningful. It combines classical swing points with a volume filter, then manages those levels on the chart as price evolves. Each level carries:
• A reference price (support or resistance)
• An estimate of the volume that traded around that price
• A touch counter that updates when price retests it
• A visual box whose thickness is scaled by volatility
The result is a concise map of candidate support and resistance that is informed by both price location and how much trading occurred there.
How levels are built
Find structural pivots uses ta.pivothigh and ta.pivotlow with a user set sensitivity. Larger sensitivity looks for broader swings. Smaller sensitivity captures tighter turns.
Require meaningful volume computes an average volume over a lookback period and forms a volume ratio for the current bar. A pivot only becomes a level when the ratio is at least the volume significance multiplier.
Avoid clustering checks a minimum level distance (as a percent of price). If a candidate is too close to an existing level, it is skipped to keep the map readable.
Attach a volume strength to the level estimates volume strength by averaging the volume of recent bars whose high to low range spans that price. Levels with unusually high strength are flagged as high volume.
Store and draw levels are kept in an array with fields for price, type, volume, touches, creation bar, and a box handle. On the last bar, each level is drawn as a horizontal box centered at the price with a vertical thickness scaled by ATR. Borders are thicker when the level is marked high volume. Boxes can extend into the future.
How levels evolve over time
• Aging and pruning : levels are removed if they are too old relative to the lookback or if you exceed the maximum active levels.
• Break detection : a level can be removed when price closes through it by more than a break threshold set as a fraction of ATR. Toggle with Remove Broken Levels.
• Touches : when price approaches within the break threshold, the level’s touch counter increments.
Visual encoding
• Boxes : support boxes are green, resistance boxes are red. Box height uses an ATR based thickness so tolerance scales with volatility. Transparency is fixed in this version. Borders are thicker on high volume levels.
• Volume annotation : show the estimated volume inside the box or as a label at the right. If a level has more than one touch, a suffix like “(2x)” is appended.
• Extension : boxes can extend a fixed number of bars into the future and can be set to extend right.
• High volume bar tint : bars with volume above average × multiplier are tinted green if up and red if down.
Inputs at a glance
Core Settings
• Level Detection Sensitivity — pivot window for swing detection
• Volume Significance Multiplier — minimum volume ratio to accept a pivot
• Lookback Period — window for average volume and maintenance rules
Level Management
• Maximum Active Levels — cap on concurrently drawn levels
• Minimum Level Distance (%) — required spacing between level prices
Visual Settings
• Remove Broken Levels — drop a level once price closes decisively through it
• Show Volume Information on Levels — annotate volume and touches
• Extend Levels to Right — carry boxes forward
Enhanced Visual Settings
• Show Volume Text Inside Box — text placement option
• Volume Based Transparency and Volume Based Border Thickness — helper logic provided; current draw block fixes transparency and increases border width on high volume levels
Colors
• Separate colors for support, resistance, and their high volume variants
How it can be used
• Trade planning : use the most recent support and resistance as reference zones for entries, profit taking, or stop placement. ATR scaled thickness provides a practical buffer.
• Context for patterns : combine with breakouts, pullbacks, or candle patterns. A breakout through a high volume resistance carries more informational weight than one through a thin level.
• Prioritization : when multiple levels are nearby, prefer high volume or higher touch counts.
• Regime adaptation : widen sensitivity and increase minimum distance in fast regimes to avoid clutter. Tighten them in calm regimes to capture more granularity.
Why volume support and resistance is used in trading
Support and resistance relate to willingness to transact at certain prices. Volume measures participation. When many contracts change hands near a price:
• More market players hold inventory there, often creating responsive behavior on retests
• Order flow can concentrate again to defend or to exit
• Breaks can be cleaner as trapped inventory rebalances
Conditioning level detection on above average activity focuses attention on prices that mattered to more participants.
Alerts
• New Support Level Created
• New Resistance Level Created
• Level Touch Alert
• Level Break Alert
Strengths
• Dual filter of structure and participation, reducing trivial swing points
• Self cleaning map that retires old or invalid levels
• Volatility aware presentation using ATR based thickness
• Touch counting for persistence assessment
• Tunable inputs for instrument and timeframe
Limitations and caveats
• Volume strength is an approximation based on bars spanning the price, not true per price volume
• Pivots confirm after the sensitivity window completes, so new levels appear with a delay
• Narrow ranges can still cluster levels unless minimum distance is increased
• Large gaps may jump past levels and immediately trigger break conditions
Practical tuning guide
• If the chart is crowded: increase sensitivity, increase minimum level distance, or reduce maximum active levels
• If useful levels are missed: reduce volume multiplier or sensitivity
• If you want stricter break removal: increase the ATR based break threshold in code
• For instruments with session patterns: tailor the lookback period to a representative window
Interpreting touches and breaks
• First touch after creation is a validation test
• Multiple shallow touches suggest absorption; a later break may then travel farther
• Breaks on high current volume merit extra attention
Multi timeframe usage
Levels are computed on the active chart timeframe. A common workflow is to keep a higher timeframe instance for structure and a lower timeframe instance for execution. Align trades with higher timeframe levels where possible.
Final Thoughts
This indicator builds a lightweight, self updating map of support and resistance grounded in swings and participation. It is not a full market profile, but it captures much of the practical benefit with modest complexity. Treat levels as context and decision zones, not guarantees. Combine with your entry logic and risk controls.

Pivot Extension Indicator (Jaxon0007)Pivot Extension Indicator (Jaxon0007)
This indicator automatically detects pivot highs and lows, then extends those levels forward as potential support and resistance zones. It's designed for traders who rely on price action, breakout setups, and clear structure in the market.
.
🔧 Key Features:
✅ Auto-detected pivot levels (highs & lows)
✅ Forward-projected SR lines with customizable length
✅ Real-time buy/sell signal alerts on pivot breakouts
✅ Optional RSI and MACD filters to confirm trade quality
✅ Clean chart visuals with full styling control (lines, width, style)
🧠 Best For:
Traders who follow breakouts, trends, or swing strategies
Those looking for a non-repainting indicator
Anyone who wants a clean way to visualize structure and key price zones
📌 Notes:
This is an indicator-only tool — it doesn't execute trades or track performance.
Built in Pine Script v5 and fully copyright-free.
💼 Created by @Jaxon0007
For VIP signals, private tools, or account management — DM me on Telegram.

Script_Algo - ORB Strategy with Filters🔍 Core Concept: This strategy combines three powerful technical analysis tools: Range Breakout, the SuperTrend indicator, and a volume filter. Additionally, it features precise customization of the number of candles used to construct the breakout range, enabling optimized performance for specific assets.
🎯 How It Works:
The strategy defines a trading range at the beginning of the trading session based on a selected number of candles.
It waits for a breakout above the upper or below the lower boundary of this range, requiring a candle close.
It filters signals using the SuperTrend indicator for trend confirmation.
It utilizes trading volume to filter out false breakouts.
⚡ Strategy Features
📈 Entry Points:
Long: Candle close above the upper range boundary + SuperTrend confirmation
Short: Candle close below the lower range boundary + SuperTrend confirmation
🛡️ Risk Management:
Stop-Loss: Set at the opposite range boundary.
Take-Profit: Calculated based on a risk/reward ratio (3:1 by default).
Position Size: 10 contracts (configurable).
⚠️ IMPORTANT SETTINGS
🕐 Time Parameters:
Set the correct time and time zone!
❕ATTENTION: The strategy works ONLY with correct time settings! Set the time corresponding to your location and trading session.
📊 This strategy is optimized for trading TESLA stock!
Parameters are tailored to TESLA's volatility, and trading volumes are adequate for signal filtering. Trading time corresponds to the American session.
📈 If you look at the backtesting results, you can see that the strategy could potentially have generated about 70 percent profit on Tesla stock over six months on 5m timeframe. However, this does not guarantee that results will be repeated in the future; remain vigilant.
⚠️ For other assets, the following is required:
Testing and parameter optimization
Adjustment of time intervals and the number of candles forming the range
Calibration of stop-loss and take-profit levels
⚠️ Limitations and Drawbacks
🔗 Automation Constraints:
❌ Cannot be directly connected via Webhook to CFD brokers!
Additional IT solutions are required for automation, thus only manual trading based on signals is possible.
📉 Risk Management:
Do not risk more than 2-3% of your account per trade.
Test on historical data before live use.
Start with a demo account.
💪 Strategy Advantages
✅ Combined approach – multiple signal filters
✅ Clear entry and exit rules
✅ Visual signals on the chart
✅ Volume-based false breakout filtering
✅ Automatic position management
🎯 Usage Recommendations
Always test the strategy on historical data.
Start with small trading volumes.
Ensure time settings are correct.
Adapt parameters to current market volatility.
Use only for stocks – futures and Forex require adaptation.
📚 Suitable Timeframes - M1-M15
Only highly liquid stocks
🍀 I wish all subscribers good luck in trading and steady profits!
📈 May your charts move in the right direction!
⚠️ Remember: Trading involves risk. Do not invest money you cannot afford to lose!

TIKOLE SVM Sentiment Combo Oscillator MACD"This one has MACD and RSI. Accuracy is very good. Best for 5-minute and 15-minute timeframes."
The script combines MACD-style histogram with RSI logic.
It gives high accuracy signals.
Works best on 5-minute and 15-minute charts (scalping + intraday).
⚡MACD (fast EMA / slow EMA) into the same script along with your RSI sentiment oscillator, so you’ll get a dual-confirmation system (RSI sentiment + MACD crossover + histogram).

Intraday AutoFib Gann++Suitable for intraday trading. EMA indicator with price range and direction helps in good trading. Normal price action knowledge will help for good trading. Only choppy day will be problematic.

DR + Fibonacci Zones — 🔵 Bullish Scenario -- 🔴 Bearish ScenarioElliott + Fibonacci Zones — 🔵 Bullish Scenario & 🔴 Bearish Scenario
A visual tool that combines Elliott Waves and Fibonacci levels to help traders map out potential market scenarios.
✦ Features:
Manual plotting of Elliott Waves (1→5) using customizable highs and lows.
Display of classic Fibonacci retracements (0.236 – 0.382 – 0.5 – 0.618 – 0.786) with individual on/off controls.
Display of Fibonacci extensions (1.272 – 1.618) to project possible Wave (5) targets.
Full customization options:
• Line styles (Solid / Dashed / Dotted).
• Line extension (Left / Right / Both / None).
• Label background colors with adjustable transparency.
• Custom text color for labels.
Flexible inputs to adjust wave points according to your own market analysis.
✦ How to Use:
Set the wave levels (Wave 1–4) in the input panel.
Enable or disable Fibonacci levels as needed.
Watch the key retracement and extension areas:
🔵 Bullish scenario: Wave (5) continuation after breaking resistance.
🔴 Bearish scenario: Support failure and breakdown through critical retracement zones.
✦ Benefit:
This indicator provides a clear visual roadmap of critical support and resistance zones, combining Elliott Wave structure with Fibonacci confluence to anticipate potential reversals or price extensions.

EMA Oscillator [Alpha Extract]A precision mean reversion analysis tool that combines advanced Z-score methodology with dual threshold systems to identify extreme price deviations from trend equilibrium. Utilizing sophisticated statistical normalization and adaptive percentage-based thresholds, this indicator provides high-probability reversal signals based on standard deviation analysis and dynamic range calculations with institutional-grade accuracy for systematic counter-trend trading opportunities.
🔶 Advanced Statistical Normalization
Calculates normalized distance between price and exponential moving average using rolling standard deviation methodology for consistent interpretation across timeframes. The system applies Z-score transformation to quantify price displacement significance, ensuring statistical validity regardless of market volatility conditions.
// Core EMA and Oscillator Calculation
ema_values = ta.ema(close, ema_period)
oscillator_values = close - ema_values
rolling_std = ta.stdev(oscillator_values, ema_period)
z_score = oscillator_values / rolling_std
🔶 Dual Threshold System
Implements both statistical significance thresholds (±1σ, ±2σ, ±3σ) and percentage-based dynamic thresholds calculated from recent oscillator range extremes. This hybrid approach ensures consistent probability-based signals while adapting to varying market volatility regimes and maintaining signal relevance during structural market changes.
// Statistical Thresholds
mild_threshold = 1.0 // ±1σ (68% confidence)
moderate_threshold = 2.0 // ±2σ (95% confidence)
extreme_threshold = 3.0 // ±3σ (99.7% confidence)
// Percentage-Based Dynamic Thresholds
osc_high = ta.highest(math.abs(z_score), lookback_period)
mild_pct_thresh = osc_high * (mild_pct / 100.0)
moderate_pct_thresh = osc_high * (moderate_pct / 100.0)
extreme_pct_thresh = osc_high * (extreme_pct / 100.0)
🔶 Signal Generation Framework
Triggers buy/sell alerts when Z-score crosses extreme threshold boundaries, indicating statistically significant price deviations with high mean reversion probability. The system generates continuation signals at moderate levels and reversal signals at extreme boundaries with comprehensive alert integration.
// Extreme Signal Detection
sell_signal = ta.crossover(z_score, selected_extreme)
buy_signal = ta.crossunder(z_score, -selected_extreme)
// Dynamic Color Coding
signal_color = z_score >= selected_extreme ? #ff0303 : // Extremely Overbought
z_score >= selected_moderate ? #ff6a6a : // Overbought
z_score >= selected_mild ? #b86456 : // Mildly Overbought
z_score > -selected_mild ? #a1a1a1 : // Neutral
z_score > -selected_moderate ? #01b844 : // Mildly Oversold
z_score > -selected_extreme ? #00ff66 : // Oversold
#00ff66 // Extremely Oversold
🔶 Visual Structure Analysis
Provides a six-tier color gradient system with dynamic background zones indicating mild, moderate, and extreme conditions. The histogram visualization displays Z-score intensity with threshold reference lines and zero-line equilibrium context for precise mean reversion timing.
snapshot
4H
1D
🔶 Adaptive Threshold Selection
Features intelligent threshold switching between statistical significance levels and percentage-based dynamic ranges. The percentage system automatically adjusts to current volatility conditions using configurable lookback periods, while statistical thresholds maintain consistent probability-based signal generation across market cycles.
🔶 Performance Optimization
Utilizes efficient rolling calculations with configurable EMA periods and threshold parameters for optimal performance across all timeframes. The system includes comprehensive alert functionality with customizable notification preferences and visual signal overlay options.
🔶 Market Oscillator Interpretation
Z-score > +3σ indicates statistically significant overbought conditions with high reversal probability, while Z-score < -3σ signals extreme oversold levels suitable for counter-trend entries. Moderate thresholds (±2σ) capture 95% of normal price distributions, making breaches statistically significant for systematic trading approaches.
snapshot
🔶 Intelligent Signal Management
Automatic signal filtering prevents false alerts through extreme threshold crossover requirements, while maintaining sensitivity to genuine statistical deviations. The dual threshold system provides both conservative statistical approaches and adaptive market condition responses for varying trading styles.
Why Choose EMA Oscillator ?
This indicator provides traders with statistically-grounded mean reversion analysis through sophisticated Z-score normalization methodology. By combining traditional statistical significance thresholds with adaptive percentage-based extremes, it maintains effectiveness across varying market conditions while delivering high-probability reversal signals based on quantifiable price displacement from trend equilibrium, enabling systematic counter-trend trading approaches with defined statistical confidence levels and comprehensive risk management parameters.

Svl - Trading SystemPrice can tell lies but volume cannot, so keeping this in mind I have created this indicator in which you see sell order block and buy order block on the basis of price action + volume through which we execute our trade
First of all, let us know its core concepts and logic, which will help you in taking the right decisions in it.
core concept of the " Svl - Trading System " TradingView indicator is based on professional price action, volume, and swing structure. This indicator smartly gives real-time insights of important price turning points, reversal zones, and trend continuation. Its deep explanation is given below.
Edit - default swing length -5 , change according your nature , tested With 7 For 5 minute timeframe
Core Concept:
1. Swing Structure Detection
The indicator automatically detects swing highs (HH/LH) and swing lows (HL/LL) on the chart.
HH: Higher High
HL: Higher Low
LH: Lower High
LL: Lower Low
These swings are the backbone of price action – signaling a change in trend, a bounce, reversal or trend continuation.
2. Order Block (OB) Mapping
Buy Order Block (Buy OB): When the indicator detects the HL/LL swing, we declare Buy OB, the lowest point of the swing.
Sell Order Block (Sell OB): On HH/LH swing, the highest point of our swing is called Sell OB.
Order Blocks are those important zones of price where historically price has reacted strongly – where major clusters of buyers/sellers are located in the market.
3. Volume Analysis (Optional Dashboard/Barcolor)
The candle color depends on the volume ranking on the chart (most high/low, normal, pressure blue shade).
Highest/lowest volume candles are a special highlight, which helps to spot liquidity spikes, exhaustion, or big orders.
4. Live Dashboard
There is an automated dashboard in the top-right of the chart, which shows this in real-time:
Last swing type (HH/HL/LH/LL)
Reversal price (last swing level)
Swing direction (Bull/Bear/Neutral)
Volume, Buy OB, Sell OB, etc.
This helps the trader understand the market situation at a glance.
5. Smart Plotting/Labels
Buy/Sell are plotted as distinct lines on the OB chart.
The Labels option gives clear visual swing points.
All calculations are fast and automated – the user does not need to mark manually.
This indicator is an advanced, fully-automated price action tool that combines
trend, reversal, volume, liquidity and zone detection in one smart system,
makes entry/exit decisions objective and error-free,
and provides complete trading confidence with a live monitor/dashboard.
All of its functions/properties such as: swing detect, OB plot, volume color, dashboard follow best practice for professional chart analysis!

Script_Algo - High Low Range MA Crossover Strategy🎯 Core Concept
This strategy uses modified moving averages crossover, built on maximum and minimum prices, to determine entry and exit points in the market. A key advantage of this strategy is that it avoids most false signals in trendless conditions, which is characteristic of traditional moving average crossover strategies. This makes it possible to improve the risk/reward ratio and, consequently, the strategy's profitability.
📊 How the Strategy Works
Main Mechanism
The strategy builds 4 moving averages:
Two senior MAs (on high and low) with a longer period
Two junior MAs (on high and low) with a shorter period
Buy signal 🟢: when the junior MA of lows crosses above the senior MA of highs
Sell signal 🔴: when the junior MA of highs crosses below the senior MA of lows
As seen on the chart, it was potentially possible to make 9X on the WIFUSDT cryptocurrency pair in just a year and a half. However, be careful—such results may not necessarily be repeated in the future.
Special Feature
Position closing priority ❗: if an opposite signal arrives while a position is open, the strategy first closes the current position and only then opens a new one
⚙️ Indicator Settings
Available Moving Average Types
EMA - Exponential MA
SMA - Simple MA
SSMA - Smoothed MA
WMA - Weighted MA
VWMA - Volume Weighted MA
RMA - Adaptive MA
DEMA - Double EMA
TEMA - Triple EMA
Adjustable Parameters
Senior MA Length - period for long-term moving averages
Junior MA Length - period for short-term moving averages
✅ Advantages of the Strategy
🛡️ False Signal Protection - using two pairs of modified MAs reduces the number of false entries
🔄 Configuration Flexibility - ability to choose MA type and calculation periods
⚡ Automatic Switching - the strategy automatically closes the current position when receiving an opposite signal
📈 Visual Clarity - all MAs are displayed on the chart in different colors
⚠️ Disadvantages and Risks
📉 Signal Lag - like all MA-based strategies, it may provide delayed signals during sharp movements
🔁 Frequent Switching - in sideways markets, it may lead to multiple consecutive position openings/closings
📊 Requires Optimization - optimal parameters need to be selected for different instruments and timeframes
💡 Usage Recommendations
Backtest - test the strategy's performance on historical data
Optimize Parameters - select MA periods suitable for the specific trading instrument
Use Filters - add additional filters to confirm signals
Manage Risks - always use stop-loss and take-profit orders.
You can safely connect to the exchange via webhook and enjoy trading.
Good luck and profits to everyone!!

SingleBarFastMagetAutomatically conduct quick transactions to the magnet based on the conditions of the magnet, i b s and trend bar
基于磁体、IBS和趋势K的条件自动进行急赴磁体的交易

Stacked Order Blocks & Breaker Blocks [FREE] [Extended]BASED ON LOGIC FROM "Order Blocks and Breaker Blocks
This indicator builds directly on the LuxAlgo Order Blocks & Breaker Blocks concept and adds a powerful new feature: stacked intersection highlighting.
Order Blocks (OBs) and Breaker Blocks are detected with the original LuxAlgo swing-based logic for reliability.
Blocks automatically extend to the right until invalidated, with breaker transitions marked clearly.
Intersection Zones: when multiple OBs and/or Breakers overlap, the shared price-time region is highlighted. These stacked zones represent areas of especially strong supply/demand confluence.
Customizable highlight styling:
Choose different colors for OB vs Breaker intersections.
Adjust transparency and maximum highlights displayed.
Optionally draw a center line through the overlap mid-price.
Toggle visibility so you can display only intersections, or both intersections and the underlying blocks.
Supports both bullish and bearish block filtering for overlap detection.
This tool is designed to help traders quickly identify high-probability confluence zones where multiple institutional footprints align.


Adaptive Square Levels (Prev + Curr Month, Big Labels)Title:
🔢 Adaptive Square Levels — Monthly Precision Trendlines
Description:
The Adaptive Square Levels indicator dynamically plots mathematical square number levels based on the first trading day’s open of each month.
📌 Key Features:
Plots horizontal trendlines aligned with the nearest square number to the monthly open.
Automatically generates ±10 additional square levels above and below that anchor.
Shows current month and previous month levels only, keeping the chart clean.
Special highlight: levels that are squares of multiples of 3 (9, 36, 81…) appear in orange for easy recognition.
The nearest square line is bold and labeled with a ★ star, making it instantly stand out.
Labels use large fonts, ensuring values are clearly visible alongside price scale.
📊 How It Works:
At the first bar of each new month, the script locks the opening price.
It finds the nearest perfect square to that open.
The indicator then plots horizontal levels extending across the month (finite lines, not rays).
At month change, previous month levels are fixed and new levels start fresh.
⚡ Use Cases:
Identify natural mathematical zones of support/resistance.
Compare current vs. previous month’s adaptive levels.
Use as confluence with price action or other technical tools.
⚠️ Disclaimer:
This script is for educational and analytical purposes only. It is not financial advice. Trading involves risk, and past levels or patterns do not guarantee future performance. Always use with proper risk management.

Essa - Market Structure Crystal Ball SystemEssa - Market Structure Crystal Ball V2.0
Ever wished you had a glimpse into the market's next move? Stop guessing and start anticipating with the Market Structure Crystal Ball!
This isn't just another indicator that tells you what has happened. This is a comprehensive analysis tool that learns from historical price action to forecast the most probable future structure. It combines advanced pattern recognition with essential trading concepts to give you a unique analytical edge.
Key Features
The Predictive Engine (The Crystal Ball)
This is the core of the indicator. It doesn't just identify market structure; it predicts it.
Know the Odds: Get a real-time probability score (%) for the next structural point: Higher High (HH), Higher Low (HL), Lower Low (LL), or Lower High (LH).
Advanced Analysis: The engine considers the pattern sequence, the speed (velocity) of the move, and its size to find the most accurate historical matches.
Dynamic Learning: The indicator constantly updates its analysis as new price data comes in.
The All-in-One Dashboard
Your command center for at-a-glance information. No need to clutter your screen!
Market Phase: Instantly know if the market is in a "🚀 Strong Uptrend," "📉 Steady Downtrend," or "↔️ Consolidation."
Live Probabilities: See the updated forecasts for HH, HL, LL, and LH in a clean, easy-to-read format.
Confidence Level: The dashboard tells you how confident the algorithm is in its current prediction (Low, Medium, or High).
🎯 Dynamic Prediction Zones
Turn probabilities into actionable price areas.
Visual Targets: Based on the highest probability outcome, the indicator draws a target zone on your chart where the next structure point is likely to form.
Context-Aware: These zones are calculated using recent volatility and average swing sizes, making them adaptive to the current market conditions.
🔍 Fair Value Gap (FVG) Detector
Automatically identify and track key price imbalances.
Price Magnets: FVGs are automatically detected and drawn, acting as potential targets for price.
Smart Tracking: The indicator tracks the status of each FVG (Fresh, Partially Filled, or Filled) and uses this data to refine its predictions.
🌍 Trading Session Analysis
Never lose track of key session levels again.
Visualize Sessions: See the Asia, London, and New York sessions highlighted with colored backgrounds.
Key Levels: Automatically plots the high and low of each session, which are often critical support and resistance levels.
Breakout Alerts: Get notified when price breaks a session high or low.
📈 Multi-Timeframe (MTF) Context
Understand the bigger picture by integrating higher timeframe analysis directly onto your chart.
BOS & MSS: Automatically identifies Breaks of Structure (trend continuation) and Market Structure Shifts (potential reversals) from up to two higher timeframes.
Trade with the Trend: Align your intraday trades with the dominant trend for higher probability setups.
⚙️ How It Works in Simple Terms
1️⃣ It Learns: The indicator first identifies all the past swing points (HH, HL, LL, LH) and analyzes their characteristics (speed, size, etc.).
2️⃣ It Finds a Match: It looks at the most recent price action and searches through hundreds of historical bars to find moments that were almost identical.
3️⃣ It Analyzes the Outcome: It checks what happened next in those similar historical scenarios.
4️⃣ It Predicts: Based on that historical data, it calculates the probability of each potential outcome and presents it to you.
🚀 How to Use This Indicator in Your Trading
Confirmation Tool: Use a high probability score (e.g., >60% for a HH) to confirm your own bullish analysis before entering a trade.
Finding High-Probability Zones: Use the Prediction Zones as potential areas to take profit, or as reversal zones to watch for entries in the opposite direction.
Gauging Market Sentiment: Check the "Market Phase" on the dashboard. Avoid forcing trades when the indicator shows "😴 Low Volatility."
Confluence is Key: This indicator is incredibly powerful when combined with your existing strategy. Use it alongside supply/demand zones, moving averages, or RSI for ultimate confirmation.
We hope this tool gives you a powerful new perspective on the market. Dive into the settings to customize it to your liking!
If you find this indicator helpful, please give it a Boost 👍 and leave a comment with your feedback below! Happy trading!
Disclaimer: All predictions are probabilistic and based on historical data. Past performance is not indicative of future results. Always use proper risk management.
