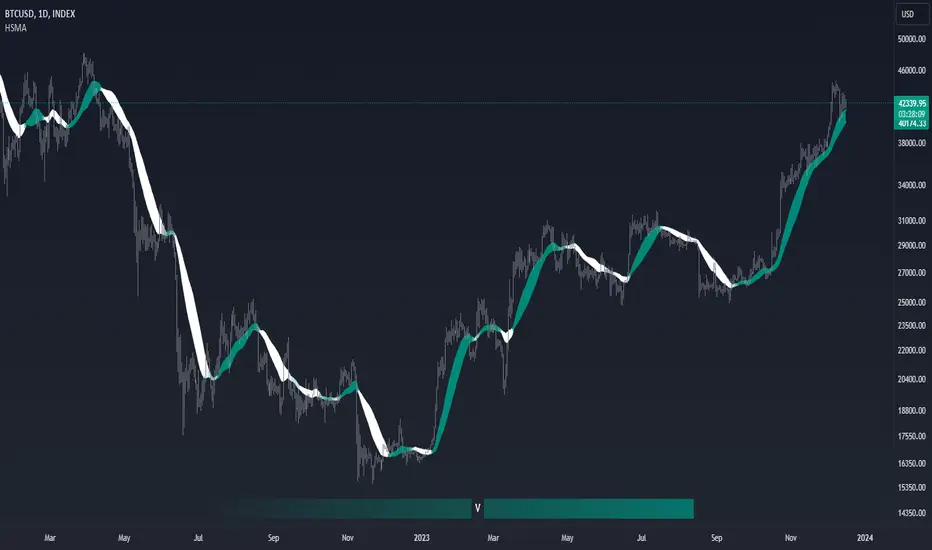
Uptrick: Hull Suite IndicatorThe "Uptrick: Hull Suite Indicator" is a powerful technical analysis tool designed to identify trends and potential buy or sell signals in the financial markets. This indicator leverages the Hull Moving Average (HMA), known for its superior smoothness and reduced lag compared to traditional moving averages, making it a preferred choice for traders seeking more accurate trend detection.
Purpose
The primary purpose of the Uptrick: Hull Suite Indicator is to provide traders with a clear visual representation of the market trend and to generate actionable signals for trading decisions. It achieves this by:
Smoothing Price Data: Using the Hull Moving Average (HMA) to smooth price data, reducing noise and highlighting the underlying trend.
Trend Identification: Coloring the HMA line green or red based on its slope to indicate uptrends and downtrends respectively.
Signal Generation: Offering optional signal lines and background highlights to emphasize bullish or bearish conditions.
Actionable Alerts: Placing 'Buy' and 'Sell' labels directly on the chart when specific conditions are met, helping traders make timely decisions.
Key Features and Benefits
Advanced Smoothing Technique: The HMA is calculated using weighted moving averages, which smooths price data more effectively than simple or exponential moving averages, resulting in a more responsive and accurate trend line.
Dynamic Trend Coloring: The HMA line changes color based on its slope (green for upward, red for downward), providing an immediate visual cue of the current trend direction.
Signal Line Option: Traders can enable a signal line that represents a simple moving average of the HMA, offering an additional layer of trend confirmation.
Background Highlighting: The background color changes to a brighter shade when the HMA is above or below the signal line, highlighting trending periods and making it easier to spot potential trading opportunities.
Zero Line Reference: A horizontal zero line is included to give traders a reference point, aiding in the analysis of the HMA's position and slope.
Buy and Sell Labels: Automatic labeling of 'Buy' and 'Sell' signals based on HMA crossovers, providing clear entry and exit points.
Superior Performance
The Uptrick: Hull Suite Indicator stands out from other moving average-based indicators due to its:
Reduced Lag: By utilizing the Hull Moving Average, it minimizes lag while maintaining smoothness, allowing traders to react more quickly to market changes.
Enhanced Clarity: The combination of dynamic coloring, signal lines, and background highlights ensures that trends and signals are easy to identify, even for novice traders.
Customizability: Input parameters for HMA length, signal length, and signal line visibility allow traders to tailor the indicator to their specific trading style and preferences.
Overall, the Uptrick: Hull Suite Indicator is an exceptional tool for traders seeking a reliable and visually intuitive method to analyze market trends and make informed trading decisions. Its advanced features and superior smoothing capabilities provide a distinct advantage over traditional moving averages, making it an indispensable part of any trader's toolkit.
Hull Hareketli Ortalaması (HMA)

No-Lag MA Crossover ScalperThe No Lag Crossover Scalper aims to capitalize on short-term trends using a combination of Hull Moving Average (HMA) for trend detection and multiple indicators for generating buy and sell signals. Here’s an overview of its components and approach:
1. Trend Detection with Hull Moving Averages (HMA) :
- Dual Hull MA Setup : Uses two Hull Moving Averages (HMA) to detect crossovers and crossunders, which are signals of short-term trend changes.
- No Lag Nature : HMAs are chosen for their ability to reduce lag compared to traditional moving averages, providing quicker responses to price movements.
2. Indicators for Signal Generation :
- Relative Strength Index (RSI) : Detects overbought and oversold conditions, generating signals when price movements diverge from RSI readings.
- Moving Average Convergence Divergence (MACD) : Provides signals based on the convergence and divergence of two moving averages, indicating potential trend reversals.
- Stochastic Oscillator (Stoch) : Identifies momentum shifts by comparing the current closing price to its range over a specific period.
- On-Balance Volume (OBV) : Measures buying and selling pressure based on volume flow, signaling potential changes in price direction.
- RSI Divergence : Looks for discrepancies between price action and RSI values, suggesting weakening trends and possible reversals.
3. Signal Generation Logic :
- Buy Signals : Generated when both HMAs cross over, supported by bullish indications from RSI, MACD, Stoch, OBV, or RSI divergence. At least 2 indicators must be true to generate a signal.
- Sell Signals : Triggered when HMAs cross under, complemented by bearish signals from the mentioned indicators.
4. Implementation and Optimization :
- Parameter Optimization : Fine-tuning of indicator periods and sensitivity settings to balance signal accuracy and responsiveness.
- Confirmation Mechanisms : Use of multiple indicators to confirm signals, reducing false positives and enhancing reliability.
Overall, the No Lag Crossover Scalper combines the speed of Hull Moving Averages with the reliability of multiple indicators to identify short-term trends effectively. By focusing on no lag indicators and confirming signals with diverse technical tools, it aims to capitalize on rapid market movements while managing risk through disciplined execution.
Credits: used TradingView ta library for a lot of the built-in indicators.
Disclaimer: This is still experimental beta version so use at your own risk.

HMA Crossover 1H with RSI, Stochastic RSI, and Trailing StopThe strategy script provided is a trading algorithm designed to help traders make informed buy and sell decisions based on certain technical indicators. Here’s a breakdown of what each part of the script does and how the strategy works:
Key Components:
Hull Moving Averages (HMA):
HMA 5: This is a Hull Moving Average calculated over 5 periods. HMAs are used to smooth out price data and identify trends more quickly than traditional moving averages.
HMA 20: This is another HMA but calculated over 20 periods, providing a broader view of the trend.
Relative Strength Index (RSI):
RSI 14: This is a momentum oscillator that measures the speed and change of price movements over a 14-period timeframe. It helps identify overbought or oversold conditions in the market.
Stochastic RSI:
%K: This is the main line of the Stochastic RSI, which combines the RSI and the Stochastic Oscillator to provide a more sensitive measure of overbought and oversold conditions. It is smoothed with a 3-period simple moving average.
Trading Signals:
Buy Signal:
Generated when the 5-period HMA crosses above the 20-period HMA, indicating a potential upward trend.
Additionally, the RSI must be below 45, suggesting that the market is not overbought.
The Stochastic RSI %K must also be below 39, confirming the oversold condition.
Sell Signal:
Generated when the 5-period HMA crosses below the 20-period HMA, indicating a potential downward trend.
The RSI must be above 60, suggesting that the market is not oversold.
The Stochastic RSI %K must also be above 63, confirming the overbought condition.
Trailing Stop Loss:
This feature helps protect profits by automatically selling the position if the price moves against the trade by 5%.
For sell positions, an additional trailing stop of 100 points is included.

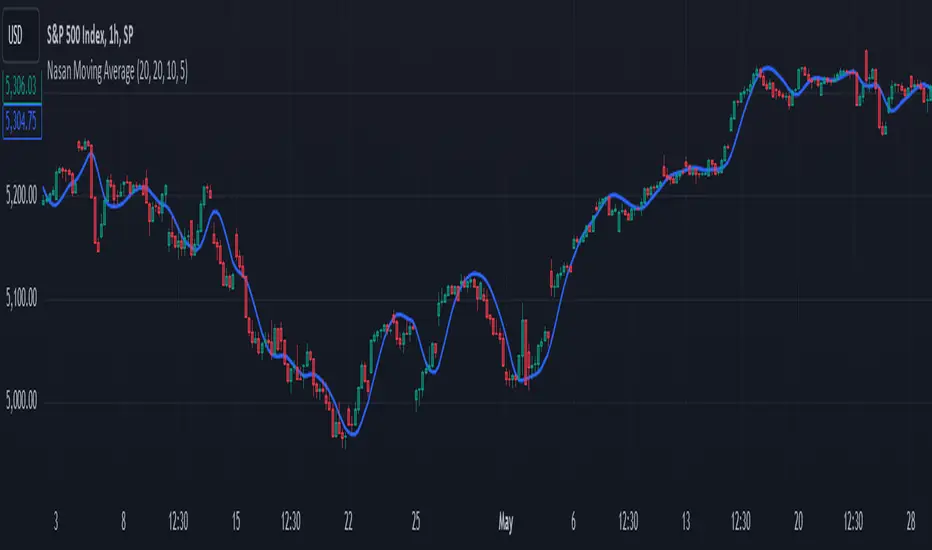
Nasan Moving AverageNasan Moving Average belong to the group of moving average which provides a high degree of smoothness with very low lag.
The calculation process involves several steps to analyze the typical price of a financial asset over specific periods. It starts by computing a simple moving average and standard deviation of the typical price. Then, it standardizes (differencing TP - Average Typical price over previous n periods) the price and applies an inverse hyperbolic sine transformation to the standardized value. The transformed values are summed cumulatively, and various weighted moving averages are calculated to adjust and smooth the data. The final output is a smoothed signal with reduced lag.
Input Parameters:
len: Differencing length (default 21, Use a minimum of 5 and for lower time frames less than 15 min use values between 300 -3000)
len1: Correction Factor Length 1 (default 21, this determines the length of the MA you want , eg. 10 MA, 50 MA, 100 MA, )
len2: Correction Factor Length 2 (default 9, this works best if it is ~ </=1/2 of len1 )
len3: Smoothing Length (default 5, I would not change this and only use if I want to introduce lag where you want to use it for cross over strategies).
Differencing and Standardization:
The code calculates the standardized price a by differencing the typical price and normalizing it using the mean and standard deviation. This step standardizes the price changes.
Transformation:
The transformation using logarithms and square roots (b) aim to stabilize the variance and make the distribution more normal-like, improving the robustness of the cumulative sum c.
Cumulative Sum:
The cumulative sum c of the transformed series helps in integrating the series over time, capturing the overall trend and movement.
Correction Factors:
Correction factors c1 and c4 adjust the cumulative sum based on weighted averages, to correct any biases or to align it with the typical price.
Smoothing:
The final result c6 is smoothed using a weighted moving average, reducing noise and making it easier to interpret trends.
Fibonacci Moving Averages [UkutaLabs]█ OVERVIEW
The Fibonacci Moving Averages are a toolkit which allows the user to configure different types of Moving Averages based on key Fibonacci numbers.
Moving Averages are used to visualise short-term and long-term support and resistance which can be used as a signal where price might continue or retrace. Moving Averages serve as a simple yet powerful tool that can help traders in their decision-making and help foster a sense of where the price might be moving next.
The aim of this script is to simplify the trading experience of users by automatically displaying a series of useful Moving Averages, allowing the user to easily configure multiple at once depending on their trading style.
█ USAGE
This script will automatically plot 5 Moving Averages, each with a period of a key Fibonacci Level (5, 8, 13, 21 and 34).
Both the Source and Type of the Moving Averages can be configured by the user (see all options below under SETTINGS), making this a versatile trading tool that can provide value in a wide variety of trading styles.
█ SETTINGS
Configuration
• MA Source: Determines the source of the Moving Averages (open, high, low, close, hl2, hlc3, ohlc4, hlcc4)
• MA Source: Determines the type of the Moving Averages (SMA, EMA, VWMA, WMA, HMA, RMA)
Colors
• 5: Determines the color of the 5 period Moving Average
• 8: Determines the color of the 8 period Moving Average
• 13: Determines the color of the 13 period Moving Average
• 21: Determines the color of the 21 period Moving Average
• 34: Determines the color of the 34 period Moving Average

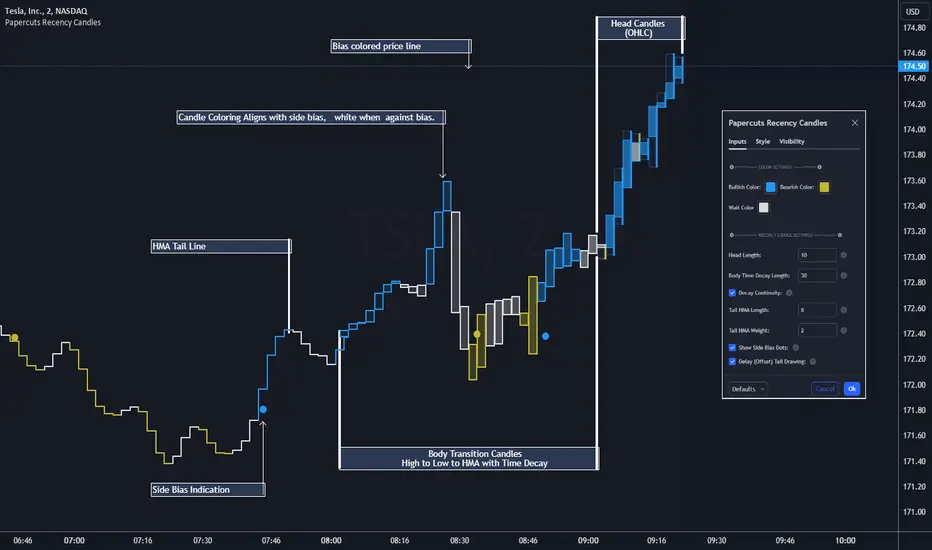
Papercuts Recency CandlesPapercuts Recency Candles
V0.8 by Joel Eckert @PapercutsTrading
***This is currently an experimental visual exploratory concept.***
*** Experimental tools should only be explored by fellow coders and experienced traders.***
DESCRIPTION:
As coders, how can we seamlessly transition between actual and smoothed price data sets as data ages?
This is a visual experiment to see if and how data can be smoothly transitioned from one value to another over a set number of candles. If we visualize a chart in 3 zones, a head, a body, and a tail we can start to understand how this could work. The head zone would represent the first data set of actual asset prices. The body zone would represent the transition period from the first to the to the second data set. Last, the tail zone would represent the second data set made of a Hull Moving Average of the asset.
CONCEPT:
It is conceived that data and position precision constantly shift as they decay or age, therefore making older price levels act more like price regions or zones vs exact price points. This is what I am calling Recency.
This indicator utilizes the concept of "Recency" to explore the possibility of a new style of candle. It aims to maintain accurately on recent prices action but loosen up accuracy on older price action. The very nature of this requires ALTERING HISTORICAL DATA within the body zone or transition candles to achieve the effect. It is similar to trying to merge a line chart type with a candle chart type.
This experiment of using recency for candles was to create candles that stay more accurate near current price but fade away into a simple line as they age out, resulting in a simplified view of the big picture which consists of older price action.
This experimental design theoretically will help you stay focused only on what is currently unfolding and to minimize distractions from older price nuances.
USAGE:
WHO:
This is not recommended for new traders or novices that are unfamiliar with standard tools. Standardized tools should always be used to get grounded and build a foundation.
Active traders who are familiar with trading comfortably should experiment with this to see if they find it interesting or usable.
Pine coders may find this concept interesting enough, and may adapt the idea to other elements of their own scripts if they find it interesting… I just ask they give credit where credit is due.
HOW:
The best way to visualize how this works is to do the following:
Load it on a chart.
Turn off Standard candles in Chart Setting of the current window. I actually just turn off the bodies and borders, and dim the old wicks as I like the way the old wicks look when left alone with these new candles.
Enable chart replay at a faster speed, like 3x, and play back the chart to watch the behavior of the candles.
You’ll be able to see how the head of the candle type preserves OHLC, and indicates direction but as the candle starts to age it progressively flowers into the HMA
While it plays back try adjusting settings to see how they affect behavior.
You can see the data average in real-time which often reveals how unstable actual price noise really is.
The head candle diagonals indicate the candle body direction.
SETTINGS:
Coloring: You can choose your own bullish or bearish colors to match your scheme.
Price Line: The price line is colored according to the trend and
Head Length: These candles are true to the source high and low. They remain slightly brighter than transition candles. We have a max of 50 to keep things responsive.
Time Decay Length: This is the amount of candles it takes to transition to the tail. Max is 300 to keep things responsive.
Decay Continuity: This forces transition candles to complete the HMA curve instead of creating gaps when conforming to it. The best way to visualize this feature is to run a 3x replay of an asset, and toggle the result on and off. On is preferred.
Tail HMA Length: This is the smoothing amount for the resulting HMA stepline that calculates every close, but has a delayed draw until after the transition candles. You can optionally turn off the delayed visibility to help with comprehension.
Tail HMA Weight: This is simply an option to make the tail thicker or thinner. This also adjusts the border on the head candles to help them stand out.
Show Side Bias Dots: Default true: Draws a dot when bias to one side changes to help keep you on the right side of trade. Side bias is simply the alignment of 3 moving averages in one direction.
IMPORTANT NOTES:
You'll have to turn off or dim the standard candles in your view "Chart Settings" to see this properly.
Be aware that since the candles are based on boxes and utilize the “recency concept”, which means their data decays and changes as it ages. This results in a cleaner chart overall, but exact highs and lows will be averaged out as the data decays, forming a Hull Moving Average stepline of your defined length once decay has finished.
SUMMARY OF HOW IT WORKS:
First it takes candle information and creates unique boxes that represent each candle based on the high and low. It utilizes boxes because standard candles once written, cannot be later altered or removed… which is a key element for this effect to work.
Next it creates a second box and line from open to close for the body of the Head candles. This indicates direction at a glance.
As candles age beyond the defined distance of the “Head” they enter the "Body" aka "Time Decay" zone. Here the accuracy of the high and low will be averaged down using an incremental factor of the HMA, defined by "Time Decay Length" amount of candles.
The resulting tail is an HMA of Tail HMA Length. This tail is always calculate at close, but is not drawn instantly. The draw is delayed so that there is not overlapping data, and this makes the effect look more elegant.
There are also two EMAs within the script that do nothing but help candle coloring and help provide a trade side bias. When both EMA's and the HMA align, a side bias is defined. Only when the side bias changes will a new dot is formed.
Head candles have been simplified from previous versions to be easier to read at a a glance.
F.B_Double Hull Moving Average Trend TrackerThe F.B_Double Hull Moving Average Trend Tracker indicator is designed to identify market trends and is based on two Hull Moving Averages.
The "Hull Moving Average" (HMA) is a fast and smooth moving average that exhibits a rather unique behavior. The HMA attempts to completely remove lag while simultaneously presenting smoother results.
The first derivative is calculated for each HMA 1 and HMA 2.
If HMA 1 derivative > 0 and HMA 2 derivative > 0, then color the HMA lines and bar color green.
If HMA 1 derivative < 0 and HMA 2 derivative < 0, then color the HMA lines and bar color red.
If the slope of the derivative is different between HMA 1 and HMA 2, then color the HMA lines and bar color gray.
Meaning of colors:
Green ⇒ Uptrend
Gray ⇒ Price consolidation, trend weakness, or correction
Red ⇒ Downtrend
Best used in conjunction with additional indicators.

Advanced Trend Strategy [BITsPIP]The BITsPIP team is super excited to share our latest trading gem with you all. We're all about diving deep and ensuring our strategies can stand the test of time. So, we invite you to join us in exploring the awesome potential of this new strategy and really put it through its pace with some deep backtesting. This isn't just another strategy; it boasts a profit factor hovering around 1.5 across over 1000 trades, which is quite an achievement. Consider integrating it with your trading bots to further enhance your trading efficiency and profit generation. Curious? Ask for trial access or drop by our website for more details.
I. Deep Backtesting
We're all in on transparency and solid results, which is why we didn't stop at 100... or even 500 trades. We went over 1000, making sure this strategy is as robust as they come. No flimsy forecasts or sneaky repainting here. Just good, solid strategy that's ready for the real deal. Curious about the details? Check out our detailed backtesting screenshot for the BINANCE:BTCUSDT in a 5-minute timeframe. It's all about giving you the clear picture.
#No Overfitting
#No Repainting
Backtesting Screenshot
II. Algorithmic Trading
Thinking of trading as a manual game? Think again! Manual trading is a bit like rolling the dice - fun, but kind of risky if you're aiming for consistent wins. Instead, why not lean into the future with algorithmic trading? It's all about trusting the market's rhythm over the long term. By integrating your strategy with a trading bot, you can enjoy peace of mind, rest easy, and keep those emotional trades at bay.
III) Applications
Dive into the Advanced Trend Strategy, your versatile tool for navigating the market's waters. This strategy shines in under an hour timeframes, offering adaptability across stocks, commodities, forex, and cryptocurrencies. Initially fine-tuned for low-volatility cryptos like BINANCE:BTCUSDT , its default settings are a solid starting point.
But here's where your expertise comes into play. Each market beats to its own drum, necessitating nuanced adjustments to stop loss and take profit settings. This customization is key to maximizing the strategy's effectiveness in your chosen arena.
IV) Strategy's Logic
The Advanced Trend Strategy is a powerhouse, blending the precision of Hull Suite, RSI, and our unique trend detector technique. At its core, it’s designed for savvy risk management, aiming to lock in substantial profits while steering clear of minor market ripples. It utilizes stop-loss and take-profit thresholds to form a profit channel, providing a safety net for each trade. This is a trend-following strategy at heart, where these profit channels play a critical role in maximizing returns by securing positions within these "warranty channels."
1. Trend-Following
The market's complexity, influenced by countless factors, makes small movements seem almost chaotic. Yet, the principle of #Trend-Following shines in less volatile markets in long term. The strategy excels by pinpointing the ideal moments to enter the market, coupled with refined risk management to secure profits. It’s tailored for you, the individual trader, enabling you to ride the waves of market trends upwards or downwards.
2. Risk Management
A key facet of the strategy is its emphasis on pragmatic risk management. Traders are empowered to establish practical stop-loss and take-profit levels, tailoring these crucial parameters to the specific market they are engaging in. This customization is instrumental in optimizing long-term profitability, ensuring that the strategy adapts fluidly to the unique characteristics and volatility patterns of different trading environments.
V) Strategy's Input Settings and Default Values
1. Alerts
The strategy comes equipped with a flexible alert system designed to keep you informed and ready to act. Within the settings, you’ll find options to configure order/exit and comment/alert messages to your preference. This feature is particularly useful for staying on top of the strategy’s activities without constant manual oversight.
2. Hull Suite
i. Hull Suite Length: Designed for capturing long-term trends, the Hull Suite Length is configured at 1000. Functioning comparably to moving averages, the Hull Suite features upper and lower bands. Currently, it is set to 1000.
ii. Length Multiplier: It's advisable to maintain a minimal value for the Length Multiplier, prioritizing the optimization of the Hull Suite Length. Presently, it is set to 1.
3. RSI Indicator
i. The RSI is a widely recognized tool in trading. Adapt the oversold and overbought thresholds to better match the specifics of your market for optimal results.
4. StopLoss and TakeProfit
i. StopLoss and TakeProfit Settings: Two distinct approaches are available. Semi-Automatic StopLoss/TakeProfit Setting and Manual StopLoss/TakeProfit Setting. The Semi-Automatic mode streamlines the process by allowing you to input values for a 5-minute timeframe, subsequently auto-adjusting these values across various timeframes, both lower and higher. Conversely, the Manual mode offers full control, enabling you to meticulously define TakeProfit values for each individual timeframe.
ii. TakeProfit Threshold # and TakeProfit Value #: Imagine this mechanism as an ascending staircase. Each step represents a range, with the lower boundary (TakeProfit Value) designed to close the trade upon being reached, and the upper boundary (TakeProfit Threshold) upon being hit, propelling the trade to the next level, and forming a new range. This stair-stepping approach enhances risk management and increases profitability. The pre-set configurations are tailored for $BINANCE:BTCUSDT. It's advisable to devote time to tailoring these settings to your specific market, aiming to achieve optimal results based on backtesting.
iii. StopLoss Value: In line with its name, this value marks the limit of loss you're prepared to accept should the market trend go against your expectations. It's crucial to note that once your asset reaches the first TakeProfit range, the initial StopLoss value becomes obsolete, supplanted by the first TakeProfit Value. The default StopLoss value is pegged at 1.6(%), a figure worth considering in your trading strategy.
VI) Entry Conditions
The primary signal for entry is generated by our custom trend detection mechanism and hull suite values (ascending/descending). This is supported by additional indicators acting as confirmation.
VII) Exit Conditions
The strategy stipulates exit conditions primarily governed by stop loss and take profit parameters. On infrequent occasions, if the trend lacks confirmation post-entry, the strategy mandates an exit upon the issuance of a reverse signal (whether confirmed or unconfirmed) by the strategy itself.
BITsPIP

Trend, Momentum, Volume Delta Ratings Emoji RatingsThis indicator provides a visual summary of three key market conditions - Trend, Momentum, and Volume Delta - to help traders quickly assess the current state of the market. The goal is to offer a concise, at-a-glance view of these important technical factors.
Trend (HMA): The indicator uses a Hull Moving Average (HMA) to assess the overall trend direction. If the current price is above the HMA, the trend is considered "Good" or bullish (represented by a 😀 emoji). If the price is below the HMA, the trend is "Bad" or bearish (🤮). If the price is equal to the HMA, the trend is considered "Neutral" (😐).
Momentum (ROC): The Rate of Change (ROC) is used to measure the momentum of the market. A positive ROC indicates "Good" or bullish momentum (😀), a negative ROC indicates "Bad" or bearish momentum (🤮), and a zero ROC is considered "Neutral" (😐).
Volume Delta: The indicator calculates the difference between the current trading volume and a simple moving average of the volume (Volume Delta). If the Volume Delta is above a user-defined threshold, it is considered "Good" or bullish (😀). If the Volume Delta is below the negative of the threshold, it is "Bad" or bearish (🤮). Values within the threshold are considered "Neutral" (😐).
The indicator displays these three ratings in a compact table format in the top-right corner of the chart. The table uses color-coding to quickly convey the overall market conditions - green for "Good", red for "Bad", and gray for "Neutral".
This indicator can be useful for traders who want a concise, at-a-glance view of the current market trend, momentum, and volume activity. By combining these three technical factors, traders can get a more well-rounded understanding of the market conditions and potentially identify opportunities or areas of concern more easily.
The user can customize the indicator by adjusting the lengths of the HMA, ROC, and Volume moving average, as well as the Volume Delta threshold. The colors used in the table can also be customized to suit the trader's preferences.

SVMKR_UT_Bot_HMA_UCS_LRSThis Pine Script code is a TradingView study script titled "SVMKR_UT_Bot_HMA_UCS_LRS". It combines two separate trading indicators: the UT Bot (Ultimate Trailing Stop Bot) and the UCS_LRS (Linear Regression Slope) indicator.
UT Bot (Ultimate Trailing Stop Bot):
The UT Bot is designed to provide buy and sell signals based on a trailing stop strategy.
It calculates the trailing stop level using the Average True Range (ATR) and Heikin Ashi candle signals if enabled.
Buy signals are generated when the price crosses above the trailing stop, while sell signals occur when the price crosses below the trailing stop.
Additionally, buy and sell signals are visually represented on the chart with corresponding labels and shapes.
The script also includes options to customize the sensitivity of the trailing stop and to color the bars based on buy or sell signals.
Hull Moving Average (HMA):
This section calculates and plots the Hull Moving Average, a type of moving average that reduces lag and improves smoothing compared to traditional moving averages.
It uses the weighted moving average (WMA) to compute the HMA, which helps to identify trend direction and potential reversal points.
UCS_LRS (Linear Regression Slope):
The UCS_LRS indicator calculates the linear regression slope of the closing prices over a specified period.
It then applies exponential smoothing to the slope values and calculates an average slope.
Buy signals are generated when the current slope is greater than the average slope and positive, indicating an uptrend.
Conversely, sell signals are generated when the current slope is less than the average slope and negative, suggesting a downtrend.
The linear regression slope and its average are plotted on the chart, allowing traders to visually identify trend strength and potential reversal points.
Overall, this combined script provides traders with a comprehensive set of tools for trend following and momentum trading strategies, integrating trailing stop analysis, moving average smoothing, and linear regression slope analysis into a single script for technical analysis on TradingView charts.

Hull AMA SignalsThis script is a comprehensive trading indicator named "Hull AMA Signals", which combines AMA and HSO by LuxAlgo and ther video based strategy techniques to provide buy (long) and sell (short) signals. It overlays directly on the price chart, offering a dynamic and visually intuitive trading aid. The core components of this indicator are Adaptive Moving Averages (AMA), Hull Moving Average (HMA), and a unique Hull squeeze oscillator (HSO), each configured with customizable parameters for flexibility and adaptability to various market conditions.
Features and Components
Adaptive Moving Averages (AMA): This indicator employs two sets of AMAs, each with distinct lengths, multipliers, lags, and overshoot parameters. The AMAs are designed to adapt their sensitivity based on the market's volatility, making them more responsive during significant price movements and less prone to false signals during periods of consolidation.
Hull Moving Average (HMA): The HMA is calculated using a sophisticated algorithm that aims to reduce the lag commonly associated with traditional moving averages. It provides a smoother and more responsive moving average line, which helps in identifying the prevailing market trend more accurately.
Hull Squeeze Oscillator (HSO): A novel component of this indicator, the HSO, is designed to identify potential market breakouts. It does so by comparing the Hull Moving Average's direction and momentum against a dynamically calculated mean, generating bullish or bearish signals based on the crossover and divergence from this mean.
Buy (Long) and Sell (Short) Signals: The script intelligently combines signals from the AMA crossovers and the Hull squeeze oscillator to pinpoint potential buy and sell opportunities. Bullish signals are generated when there's a positive crossover in the AMAs accompanied by a bullish dot from the HSO, whereas bearish signals are indicated by a negative crossover in the AMAs along with a bearish dot from the HSO.
Customization and Style Options: Users have the ability to adjust various parameters such as the length of the moving averages, multipliers, and source data, enabling customization for different trading strategies and asset classes. Additionally, color-coded visual elements like gradients and shapes enhance the readability and instant recognition of trading signals.
Use Cases
Trend Identification: By analyzing the direction and position of the AMAs and HMA, traders can easily discern the prevailing market trend, helping them to align their trades with the market momentum.
Signal Confirmation: The combination of AMA crossovers and HSO signals provides a robust framework for confirming trade entries and exits, potentially increasing the reliability of the trading signals.
Volatility Adaptation: The adaptive nature of the AMAs and the dynamic calculation of the HSO mean allow this indicator to adjust to changing market volatility, making it suitable for a wide range of market environments.
This indicator is suitable for traders looking for a comprehensive and dynamic technical analysis tool that combines trend analysis with signal generation, offering both visual appeal and practical trading utility.

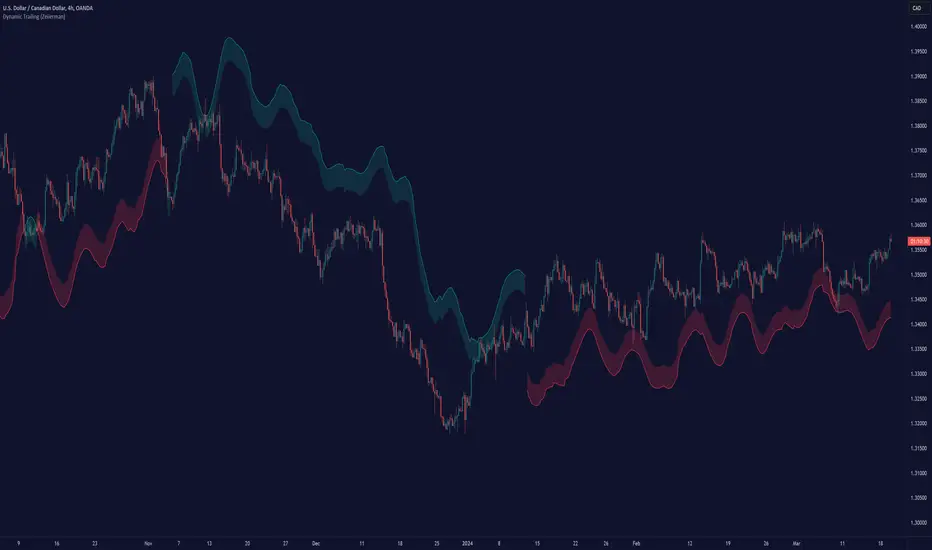
Dynamic Trailing (Zeiierman)█ Overview
The Dynamic Trailing (Zeiierman) indicator enhances the traditional SuperTrend approach by providing a more nuanced, adaptable tool for trend analysis and market volatility assessment. It combines techniques to identify dynamic support and resistance levels, trend directions, and market volatility. By integrating the Average True Range (ATR) with a unique multiplier system and smoothing mechanisms, this indicator offers a nuanced approach to trend-following strategies, making it a valuable asset for traders looking to leverage SuperTrend methodologies with additional insights into market dynamics.
█ How It Works
At its core, this indicator builds on the traditional SuperTrend formula by utilizing a modified ATR calculation to define the deviation for dynamic support and resistance levels. These levels are dynamically adjusted based on market volatility. The innovation lies in the addition of the Hull Moving Average (HMA) and the Triple Exponential Moving Average (TEMA) for an enhanced smoothing effect, making the indicator's trend signals more reliable and less prone to market noise. The trend direction is determined by comparing the closing price with the dynamic levels, facilitating clear bullish or bearish signals.
The indicator incorporates a 'Supertrend' function, which uses the dynamic levels and the price’s position relative to them to determine the trend direction. This determination is visualized through color-coded lines and a cloud zone, which expands or contracts based on the ATR and a user-defined width setting, illustrating the market's volatility and trend strength.
ATR Calculation: Utilizes the Average True Range (ATR) to measure market volatility. The ATR is a cornerstone of this indicator, helping to dynamically adjust the support and resistance levels according to the market’s changing conditions.
Supertrend Calculation: Implements a supertrend formula that combines the ATR with user-defined multipliers to plot potential trend directions. This feature helps in identifying whether the market is in an uptrend or downtrend, offering visual cues for potential reversals.
TEMA Calculation: Employs the Triple Exponential Moving Average (TEMA) through a Hull Moving Average (HMA) calculation to smooth out price data. This smoothing process helps in reducing market noise and makes the trend direction clearer.
Dynamic Support and Resistance: Calculates dynamic support and resistance levels by applying a deviation (derived from the ATR and user-defined multiplier) to the smoothed price data. These levels adapt to market conditions, providing areas where price might experience support or resistance.
Trend and Cloud Calculation: Determines the overall trend direction and plots a 'Cloud' zone around it, which adjusts in width based on the ATR and a user-defined cloud width setting. This cloud acts as a visual buffer, indicating the strength and stability of the current trend.
█ How to Use
Trend Identification: The primary function of this indicator is to help traders quickly identify the prevailing market trend. A change in the color of the dynamic trailing line or its position relative to the price can signal potential trend reversals.
Dynamic Support and Resistance: Unlike static levels, the dynamic levels adjust with market conditions, providing current areas where the price might experience support or resistance.
Dynamic Support
Dynamic Resistance
█ Settings
Mult (Multiplier): Adjusts the multiplier for the ATR calculation, affecting the deviation distance for support and resistance levels. Higher values decrease sensitivity and vice versa.
Len (Length): Sets the period for the HMA in the TEMA calculation, influencing the indicator's responsiveness to price changes.
Smoothness: Determines the smoothness of the dynamic support and resistance lines by setting the SMA length. Higher values result in smoother lines.
Cloud Width : Modifies the width of the cloud, providing a visual representation of market volatility.
Color Settings (upcol and dncol): Allows users to customize the colors of the indicator's lines and cloud, aiding in visual trend identification.
-----------------
Disclaimer
The information contained in my Scripts/Indicators/Ideas/Algos/Systems does not constitute financial advice or a solicitation to buy or sell any securities of any type. I will not accept liability for any loss or damage, including without limitation any loss of profit, which may arise directly or indirectly from the use of or reliance on such information.
All investments involve risk, and the past performance of a security, industry, sector, market, financial product, trading strategy, backtest, or individual's trading does not guarantee future results or returns. Investors are fully responsible for any investment decisions they make. Such decisions should be based solely on an evaluation of their financial circumstances, investment objectives, risk tolerance, and liquidity needs.
My Scripts/Indicators/Ideas/Algos/Systems are only for educational purposes!
Cauchy Distribution Trend AnalysisThis custom Pine Script indicator is designed to analyze assets, including cryptocurrencies, through a lens inspired by the Cauchy distribution's characteristics. It focuses on identifying potential long and short opportunities by evaluating the asset's price position relative to a dynamically calculated median price and a scale parameter. Here's a breakdown of its components and how to use it:
Components
Median Length: The period over which the median price is calculated. The median price acts as a proxy for the Cauchy distribution's location parameter, representing a central value around which the market price fluctuates.
MA Length: The length for calculating the moving average, which is used to determine the scale parameter. The scale parameter estimates the average volatility around the median price, adjusted for the selected averaging method.
Moving Average Type: Offers a choice between HMA (Hull Moving Average), SMA (Simple Moving Average), and EMA (Exponential Moving Average) to calculate the scale parameter. This flexibility allows users to tailor the sensitivity of the scale parameter to the asset's price volatility.
Median Price Calculation: Uses the close price (by default) to calculate the median price over the specified period.
Scale Parameter Calculation: A function that calculates the scale parameter based on the chosen average source. This parameter is used to identify the threshold for long and short conditions.
Strategy Logic
Long Condition: Triggered when the asset's close price is greater than the sum of the median price and the scale parameter. This indicates that the asset's price has moved significantly above the median price, suggesting bullish momentum.
Short Condition: Triggered when the asset's close price is less than the difference between the median price and the scale parameter. This indicates that the asset's price has moved significantly below the median price, suggesting bearish momentum.

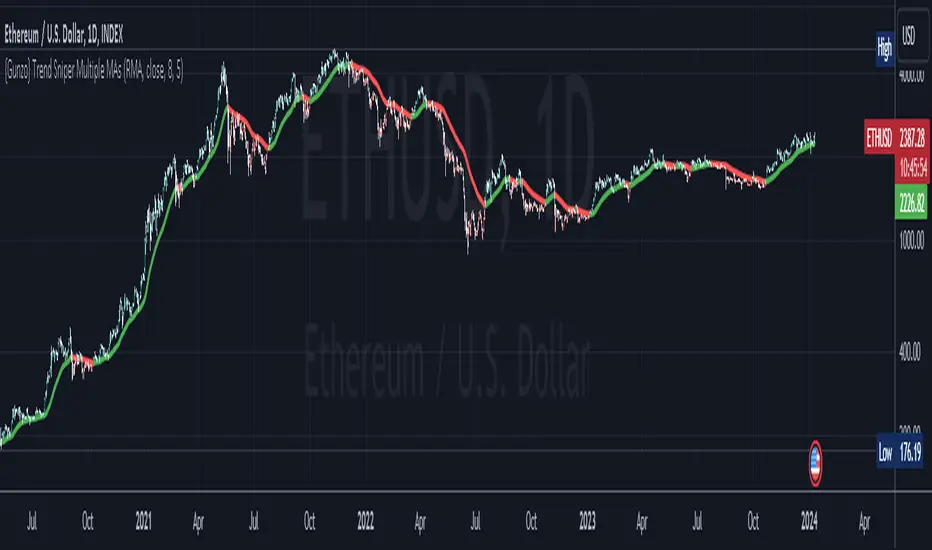
{Gunzo} Trend Sniper (Multiple MAs with coefficient)Updated GUNZO's Trend Sniper script by adding in different MA types to choose from. This can help reduce false signals and sharpen the trend reversal points.
Here's a summary of the key changes:
1. Multiple Moving Average Types: The original script was focused solely on the Weighted Moving Average (WMA) with a coefficient. The updated script introduces flexibility by allowing users to choose from a variety of Moving Average types, including WMA, VWMA (Volume Weighted Moving Average), EMA (Exponential Moving Average), SMA (Simple Moving Average), HullMA (Hull Moving Average), TEMA (Triple Exponential Moving Average), DEMA (Double Exponential Moving Average), T3, and RMA (Running Moving Average).
2. Coefficient Integration: In the original script, the coefficient was specifically designed for the WMA calculation. The updated script extends this concept to all the selected Moving Average types. This coefficient is applied differently depending on the type of MA, often affecting the length of the MA calculation.
3. Dynamic Length Calculation: For MAs that traditionally use an integer length (like SMA, EMA, etc.), the updated script calculates this length dynamically by multiplying the user-defined length by the coefficient and then rounding it to the nearest integer. This ensures compatibility with Pine Script's requirements for these functions.
All credits to GUNZO
original script:
Trend Strength GaugeTrend Strength Gauge with Modified Hull Moving Average (HMA)
Overview:
The indicator combines a modified Hull Moving Average (HMA) with a visual gauge that represents the strength and direction of the current trend. This helps traders quickly assess the trend's vigor and direction.
Key Features:
Modified Hull Moving Average (HMA):
Purpose: The HMA is a smoothed moving average designed to reduce lag and provide more responsive trend signals.
The indicator displays two HMA line and SMA line on the chart and fill color between them
based on HMA is above SMA or not.
Trend Strength Gauge:
Visualization: Below the chart, there's a gauge represented by gradient line gauge with "V" symbol.
The gauge line change color based on the direction of the trend.
Additionally, symbol "V" moves from solid color to transparent, indicating the trend's strength gradient.
Up Trend:
Dn Trend:
Trend Assessment:
When "V" at the strong teal collor it represents a strong positive trend (uptrend).
When "V" at the strong white collor it Indicates a strong negative trend (downtrend).
Arrow Movement: The symbol 'V' transitions from a solid color (teal or white) to a more transparent shade based on the strength of the trend.
Usage:
Trend Confirmation: Traders can use this indicator to confirm trends and assess their strength before making trading decisions.
Entry/Exit Points: The changing colors and transparency levels of the 'V' symbols can assist in identifying potential entry or exit points.
Can be used as a simple Hull indicator
This combined indicator simplifies trend analysis by offering an easily understandable visual representation of trend strength and direction.
Remember, while indicators are valuable tools, successful trading requires a comprehensive approach that incorporates multiple sources of information and risk management strategies.
Always exercise caution, apply critical thinking, and consider the broader market context when using indicators to make informed trading decisions.
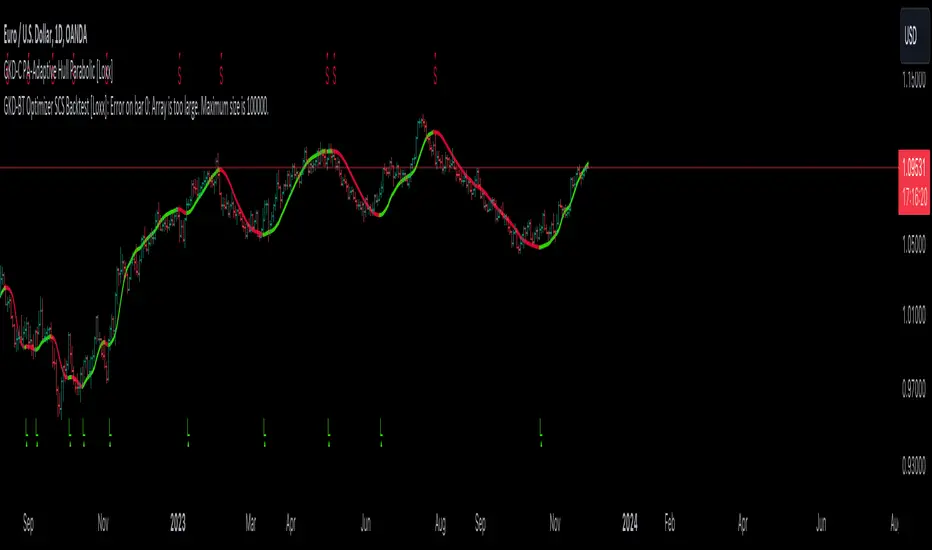
GKD-C PA-Adaptive Hull Parabolic [Loxx]The Giga Kaleidoscope GKD-C PA-Adaptive Hull Parabolic is a confirmation module included in Loxx's "Giga Kaleidoscope Modularized Trading System."
█ GKD-C PA-Adaptive Hull Parabolic
Ehlers' Phase Accumulation
John Ehlers is well-known in the trading community for his digital signal processing approach to market data. One of his standout techniques is phase accumulation. This method identifies the dominant cycle in the market by accumulating the phases of individual cycles. By doing so, it "adapts" to real-time market conditions.
Here's the brilliance of phase accumulation in this code
The indicator doesn't merely use a static look-back period. Instead, it dynamically determines the dominant market cycle through phase accumulation.
The calcComp function, rooted in Ehlers' methodology, provides a complex computation using a digital signal processing approach to filter out market noise and pinpoint the current cycle's frequency.
By measuring and adapting to the instantaneous period of the market, it ensures that the indicator remains relevant, especially in non-stationary market conditions.
Hull's Moving Average
John Hull introduced the Hull Moving Average (HMA) aiming to reduce lag and improve smoothing. The HMA's essence lies in its weighted average computation, prioritizing more recent prices.
This code takes an adaptive twist on the HMA
Instead of a fixed period, the HMA uses the dominant cycle length derived from Ehlers' phase accumulation. This makes the HMA not just fast and smooth, but also adaptive to the dominant market rhythm.
The intricate iLwmp function in the script provides this adaptive HMA computation. It's a weighted moving average, but its length isn't static; it's based on the previously determined dominant market cycle.
Trading Insights
The indicator paints the bars to represent the immediate trend: green for bullish and red for bearish.
Entry points, both long ("L") and short ("S"), are presented visually. These are derived from crossovers of the adaptive HMA, a clear indication of a potential shift in the trend.
Additionally, alert conditions are set, ready to notify a trader when these crossovers occur, ensuring real-time actionable insights.
Conclusion
The PA-Adaptive Hull Parabolic is a masterclass in advanced technical indicator design. By marrying John Ehlers' adaptive phase accumulation with John Hull's HMA, it creates a dynamic, responsive, and precise tool for traders. It's not just about capturing the trend; it's about understanding the very rhythm of the market.
█ Giga Kaleidoscope Modularized Trading System
Core components of an NNFX algorithmic trading strategy
The NNFX algorithm is built on the principles of trend, momentum, and volatility. There are six core components in the NNFX trading algorithm:
1. Volatility - price volatility; e.g., Average True Range, True Range Double, Close-to-Close, etc.
2. Baseline - a moving average to identify price trend
3. Confirmation 1 - a technical indicator used to identify trends
4. Confirmation 2 - a technical indicator used to identify trends
5. Continuation - a technical indicator used to identify trends
6. Volatility/Volume - a technical indicator used to identify volatility/volume breakouts/breakdown
7. Exit - a technical indicator used to determine when a trend is exhausted
8. Metamorphosis - a technical indicator that produces a compound signal from the combination of other GKD indicators*
*(not part of the NNFX algorithm)
What is Volatility in the NNFX trading system?
In the NNFX (No Nonsense Forex) trading system, ATR (Average True Range) is typically used to measure the volatility of an asset. It is used as a part of the system to help determine the appropriate stop loss and take profit levels for a trade. ATR is calculated by taking the average of the true range values over a specified period.
True range is calculated as the maximum of the following values:
-Current high minus the current low
-Absolute value of the current high minus the previous close
-Absolute value of the current low minus the previous close
ATR is a dynamic indicator that changes with changes in volatility. As volatility increases, the value of ATR increases, and as volatility decreases, the value of ATR decreases. By using ATR in NNFX system, traders can adjust their stop loss and take profit levels according to the volatility of the asset being traded. This helps to ensure that the trade is given enough room to move, while also minimizing potential losses.
Other types of volatility include True Range Double (TRD), Close-to-Close, and Garman-Klass
What is a Baseline indicator?
The baseline is essentially a moving average, and is used to determine the overall direction of the market.
The baseline in the NNFX system is used to filter out trades that are not in line with the long-term trend of the market. The baseline is plotted on the chart along with other indicators, such as the Moving Average (MA), the Relative Strength Index (RSI), and the Average True Range (ATR).
Trades are only taken when the price is in the same direction as the baseline. For example, if the baseline is sloping upwards, only long trades are taken, and if the baseline is sloping downwards, only short trades are taken. This approach helps to ensure that trades are in line with the overall trend of the market, and reduces the risk of entering trades that are likely to fail.
By using a baseline in the NNFX system, traders can have a clear reference point for determining the overall trend of the market, and can make more informed trading decisions. The baseline helps to filter out noise and false signals, and ensures that trades are taken in the direction of the long-term trend.
What is a Confirmation indicator?
Confirmation indicators are technical indicators that are used to confirm the signals generated by primary indicators. Primary indicators are the core indicators used in the NNFX system, such as the Average True Range (ATR), the Moving Average (MA), and the Relative Strength Index (RSI).
The purpose of the confirmation indicators is to reduce false signals and improve the accuracy of the trading system. They are designed to confirm the signals generated by the primary indicators by providing additional information about the strength and direction of the trend.
Some examples of confirmation indicators that may be used in the NNFX system include the Bollinger Bands, the MACD (Moving Average Convergence Divergence), and the MACD Oscillator. These indicators can provide information about the volatility, momentum, and trend strength of the market, and can be used to confirm the signals generated by the primary indicators.
In the NNFX system, confirmation indicators are used in combination with primary indicators and other filters to create a trading system that is robust and reliable. By using multiple indicators to confirm trading signals, the system aims to reduce the risk of false signals and improve the overall profitability of the trades.
What is a Continuation indicator?
In the NNFX (No Nonsense Forex) trading system, a continuation indicator is a technical indicator that is used to confirm a current trend and predict that the trend is likely to continue in the same direction. A continuation indicator is typically used in conjunction with other indicators in the system, such as a baseline indicator, to provide a comprehensive trading strategy.
What is a Volatility/Volume indicator?
Volume indicators, such as the On Balance Volume (OBV), the Chaikin Money Flow (CMF), or the Volume Price Trend (VPT), are used to measure the amount of buying and selling activity in a market. They are based on the trading volume of the market, and can provide information about the strength of the trend. In the NNFX system, volume indicators are used to confirm trading signals generated by the Moving Average and the Relative Strength Index. Volatility indicators include Average Direction Index, Waddah Attar, and Volatility Ratio. In the NNFX trading system, volatility is a proxy for volume and vice versa.
By using volume indicators as confirmation tools, the NNFX trading system aims to reduce the risk of false signals and improve the overall profitability of trades. These indicators can provide additional information about the market that is not captured by the primary indicators, and can help traders to make more informed trading decisions. In addition, volume indicators can be used to identify potential changes in market trends and to confirm the strength of price movements.
What is an Exit indicator?
The exit indicator is used in conjunction with other indicators in the system, such as the Moving Average (MA), the Relative Strength Index (RSI), and the Average True Range (ATR), to provide a comprehensive trading strategy.
The exit indicator in the NNFX system can be any technical indicator that is deemed effective at identifying optimal exit points. Examples of exit indicators that are commonly used include the Parabolic SAR, the Average Directional Index (ADX), and the PA-Adaptive Hull Parabolic.
The purpose of the exit indicator is to identify when a trend is likely to reverse or when the market conditions have changed, signaling the need to exit a trade. By using an exit indicator, traders can manage their risk and prevent significant losses.
In the NNFX system, the exit indicator is used in conjunction with a stop loss and a take profit order to maximize profits and minimize losses. The stop loss order is used to limit the amount of loss that can be incurred if the trade goes against the trader, while the take profit order is used to lock in profits when the trade is moving in the trader's favor.
Overall, the use of an exit indicator in the NNFX trading system is an important component of a comprehensive trading strategy. It allows traders to manage their risk effectively and improve the profitability of their trades by exiting at the right time.
What is an Metamorphosis indicator?
The concept of a metamorphosis indicator involves the integration of two or more GKD indicators to generate a compound signal. This is achieved by evaluating the accuracy of each indicator and selecting the signal from the indicator with the highest accuracy. As an illustration, let's consider a scenario where we calculate the accuracy of 10 indicators and choose the signal from the indicator that demonstrates the highest accuracy.
The resulting output from the metamorphosis indicator can then be utilized in a GKD-BT backtest by occupying a slot that aligns with the purpose of the metamorphosis indicator. The slot can be a GKD-B, GKD-C, or GKD-E slot, depending on the specific requirements and objectives of the indicator. This allows for seamless integration and utilization of the compound signal within the GKD-BT framework.
How does Loxx's GKD (Giga Kaleidoscope Modularized Trading System) implement the NNFX algorithm outlined above?
Loxx's GKD v2.0 system has five types of modules (indicators/strategies). These modules are:
1. GKD-BT - Backtesting module (Volatility, Number 1 in the NNFX algorithm)
2. GKD-B - Baseline module (Baseline and Volatility/Volume, Numbers 1 and 2 in the NNFX algorithm)
3. GKD-C - Confirmation 1/2 and Continuation module (Confirmation 1/2 and Continuation, Numbers 3, 4, and 5 in the NNFX algorithm)
4. GKD-V - Volatility/Volume module (Confirmation 1/2, Number 6 in the NNFX algorithm)
5. GKD-E - Exit module (Exit, Number 7 in the NNFX algorithm)
6. GKD-M - Metamorphosis module (Metamorphosis, Number 8 in the NNFX algorithm, but not part of the NNFX algorithm)
(additional module types will added in future releases)
Each module interacts with every module by passing data to A backtest module wherein the various components of the GKD system are combined to create a trading signal.
That is, the Baseline indicator passes its data to Volatility/Volume. The Volatility/Volume indicator passes its values to the Confirmation 1 indicator. The Confirmation 1 indicator passes its values to the Confirmation 2 indicator. The Confirmation 2 indicator passes its values to the Continuation indicator. The Continuation indicator passes its values to the Exit indicator, and finally, the Exit indicator passes its values to the Backtest strategy.
This chaining of indicators requires that each module conform to Loxx's GKD protocol, therefore allowing for the testing of every possible combination of technical indicators that make up the six components of the NNFX algorithm.
What does the application of the GKD trading system look like?
Example trading system:
Backtest: Multi-Ticker CC Backtest
Baseline: Hull Moving Average
Volatility/Volume: Hurst Exponent
Confirmation 1: Advance Trend Pressure as shown on the chart above
Confirmation 2: uf2018
Continuation: Coppock Curve
Exit: Rex Oscillator
Metamorphosis: Baseline Optimizer
Each GKD indicator is denoted with a module identifier of either: GKD-BT, GKD-B, GKD-C, GKD-V, GKD-M, or GKD-E. This allows traders to understand to which module each indicator belongs and where each indicator fits into the GKD system.
? Giga Kaleidoscope Modularized Trading System Signals
Standard Entry
1. GKD-C Confirmation gives signal
2. Baseline agrees
3. Price inside Goldie Locks Zone Minimum
4. Price inside Goldie Locks Zone Maximum
5. Confirmation 2 agrees
6. Volatility/Volume agrees
1-Candle Standard Entry
1a. GKD-C Confirmation gives signal
2a. Baseline agrees
3a. Price inside Goldie Locks Zone Minimum
4a. Price inside Goldie Locks Zone Maximum
Next Candle
1b. Price retraced
2b. Baseline agrees
3b. Confirmation 1 agrees
4b. Confirmation 2 agrees
5b. Volatility/Volume agrees
Baseline Entry
1. GKD-B Baseline gives signal
2. Confirmation 1 agrees
3. Price inside Goldie Locks Zone Minimum
4. Price inside Goldie Locks Zone Maximum
5. Confirmation 2 agrees
6. Volatility/Volume agrees
7. Confirmation 1 signal was less than 'Maximum Allowable PSBC Bars Back' prior
1-Candle Baseline Entry
1a. GKD-B Baseline gives signal
2a. Confirmation 1 agrees
3a. Price inside Goldie Locks Zone Minimum
4a. Price inside Goldie Locks Zone Maximum
5a. Confirmation 1 signal was less than 'Maximum Allowable PSBC Bars Back' prior
Next Candle
1b. Price retraced
2b. Baseline agrees
3b. Confirmation 1 agrees
4b. Confirmation 2 agrees
5b. Volatility/Volume agrees
Volatility/Volume Entry
1. GKD-V Volatility/Volume gives signal
2. Confirmation 1 agrees
3. Price inside Goldie Locks Zone Minimum
4. Price inside Goldie Locks Zone Maximum
5. Confirmation 2 agrees
6. Baseline agrees
7. Confirmation 1 signal was less than 7 candles prior
1-Candle Volatility/Volume Entry
1a. GKD-V Volatility/Volume gives signal
2a. Confirmation 1 agrees
3a. Price inside Goldie Locks Zone Minimum
4a. Price inside Goldie Locks Zone Maximum
5a. Confirmation 1 signal was less than 'Maximum Allowable PSVVC Bars Back' prior
Next Candle
1b. Price retraced
2b. Volatility/Volume agrees
3b. Confirmation 1 agrees
4b. Confirmation 2 agrees
5b. Baseline agrees
Confirmation 2 Entry
1. GKD-C Confirmation 2 gives signal
2. Confirmation 1 agrees
3. Price inside Goldie Locks Zone Minimum
4. Price inside Goldie Locks Zone Maximum
5. Volatility/Volume agrees
6. Baseline agrees
7. Confirmation 1 signal was less than 7 candles prior
1-Candle Confirmation 2 Entry
1a. GKD-C Confirmation 2 gives signal
2a. Confirmation 1 agrees
3a. Price inside Goldie Locks Zone Minimum
4a. Price inside Goldie Locks Zone Maximum
5a. Confirmation 1 signal was less than 'Maximum Allowable PSC2C Bars Back' prior
Next Candle
1b. Price retraced
2b. Confirmation 2 agrees
3b. Confirmation 1 agrees
4b. Volatility/Volume agrees
5b. Baseline agrees
PullBack Entry
1a. GKD-B Baseline gives signal
2a. Confirmation 1 agrees
3a. Price is beyond 1.0x Volatility of Baseline
Next Candle
1b. Price inside Goldie Locks Zone Minimum
2b. Price inside Goldie Locks Zone Maximum
3b. Confirmation 1 agrees
4b. Confirmation 2 agrees
5b. Volatility/Volume agrees
Continuation Entry
1. Standard Entry, 1-Candle Standard Entry, Baseline Entry, 1-Candle Baseline Entry, Volatility/Volume Entry, 1-Candle Volatility/Volume Entry, Confirmation 2 Entry, 1-Candle Confirmation 2 Entry, or Pullback entry triggered previously
2. Baseline hasn't crossed since entry signal trigger
4. Confirmation 1 agrees
5. Baseline agrees
6. Confirmation 2 agrees
Choose Symbol, Mode with HullThis Pine Script code is designed to create a customizable indicator on the TradingView platform. Below is an introduction to its features and purpose:
Introduction:
This script serves as a versatile indicator on TradingView, allowing users to choose between different modes (Heikin-Ashi, Linear, and Normal) and apply a Hull Moving Average (Hull) for trend analysis. The primary features include mode selection, the choice of using different calculation methods, and the option to incorporate the Hull Moving Average for enhanced trend visibility.
Key Features:
Mode Selection:
Users can choose between "Heikin-Ashi," "Linear," or "Normal" modes, influencing how the open, high, low, and close prices are calculated.
Hull Moving Average:
The script incorporates the Hull Moving Average (Hull) to provide a smoothed trend line for better trend identification.
Calculation Methods:
Users can select different calculation methods for the open, high, low, and close prices, including Simple Moving Average (SMA), Exponential Moving Average (EMA), Smoothed Moving Average (SMMA or RMA), Weighted Moving Average (WMA), and Volume Weighted Moving Average (VWMA).
Customizable Lengths:
Length parameters are customizable, allowing users to adjust the period lengths for the Hull Moving Average and other calculation methods.
Buy and Sell Signals:
Buy and sell signals are generated based on crossovers and crossunders between the Hull Moving Average and the price. These signals are visually displayed on the chart with corresponding labels.
Color-Coding:
The script utilizes color-coding to distinguish between bullish (lime) and bearish (red) trends, making it easier for users to identify potential changes in market direction.
Customizable Symbol and Resolution:
Users have the option to choose a specific trading symbol and resolution for analysis.
Important Note:
This script is provided for educational purposes and does not constitute financial advice. Traders and investors should conduct thorough research and analysis before making any trading decisions. Additionally, customization options should be explored to align the script with individual trading preferences.

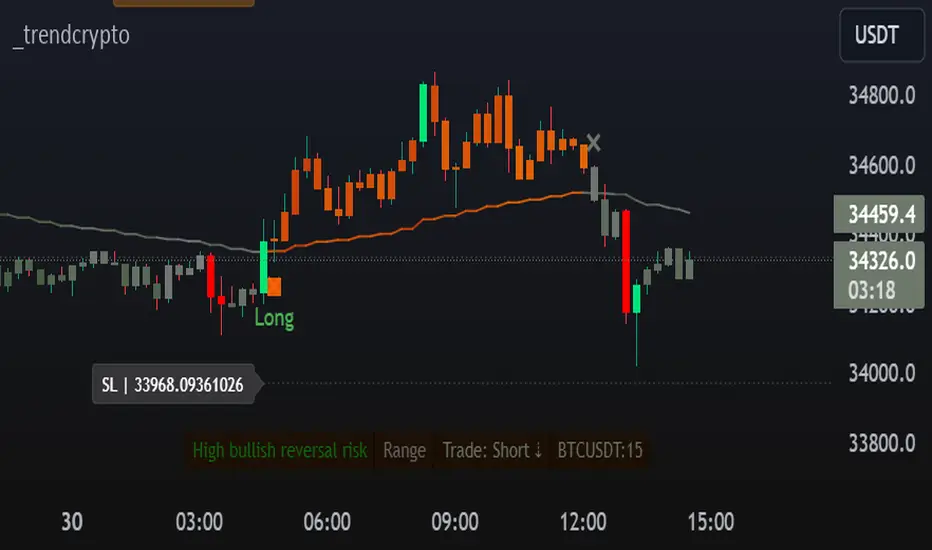
TrendCryptoThe _trendcrypto script is a trading strategy that uses a variety of indicators to identify potential trading opportunities, including the Parabolic SAR, ADX, and RSI.
The script first calculates the RMA, SMA, and trend direction. The RMA is a moving average that is weighted more heavily towards recent prices. The SMA is a simple moving average that gives equal weight to all prices in the period. The trend direction is calculated by comparing the current price to the price a certain number of periods ago.
The script then uses the RMA, SMA, and trend direction to identify potential trading opportunities. If the current price is above the RMA and the trend direction is up, the script will generate a buy signal. If the current price is below the RMA and the trend direction is down, the script will generate a sell signal.
The script also calculates the Parabolic SAR, which is a technical indicator that helps traders identify potential trend reversals. The Parabolic SAR is calculated using a formula that takes into account the high and low prices of a security over a specified period of time.
The script also calculates the ADX, which is a trend strength indicator. The ADX is calculated using a formula that takes into account the difference between the high and low prices of a security, as well as the difference between the closing price and the previous close.
The script also calculates the RSI, which is a momentum indicator that measures the magnitude of recent price changes to evaluate overbought or oversold conditions in the price of a stock or other asset. The RSI is calculated over a specified period of time, and the default value in the code is 14.
The script also allows users to specify a stop loss and take profit level for each trade. The default stop loss level is 4% and the default take profit level is 7%.
Hull WavesThe Hull Waves indicator is based on the Hull Moving Averages (HMA), which are special moving averages that stand out for their ability to filter out market noise and offer a clearer view of price trends. Compared to traditional moving averages, HMAs are more responsive yet smoother, allowing traders to capture significant price movements without getting overwhelmed by short-term fluctuations.
The HMAs integrated into Hull Waves provide two distinct perspectives on the price trend:
8-period HMA: This short-term HMA is extremely reactive and closely follows price changes. It is ideal for capturing short-term trading signals while the medium-term 21-period HMA offers a more balanced view of price trends and identifies medium-term trends.
By crossing HMAs, traders can efficiently identify trend reversal points or strong market continuations.
Another feature of the indicator is the “fan” of dynamic lines, which acts as a visual float for price candles, allowing traders to quickly evaluate trading opportunities.
The "fan" or float of dynamic lines represents a visual representation of the candle's price movements. These lines extend from the start point to the end point, like an open fan. This visual approach makes the market dynamics immediately evident.
Strategy:
Long Entry Signal (Buy):
When the Hull Waves range shows a series of upward sloping lines and the Hull Moving Averages (e.g. 8-period HMA) crosses the 21-period HMA upwards, it is a long entry signal.
Confirmation of the signal can come from an increase in trader volume or other supporting indicators.
Place a buy order at the next closing price.
Short Entry Signal (Sell):
When the Hull Waves range shows a series of downward sloping lines and the Hull Moving Averages (e.g. 8-period HMA) crosses the 21-period HMA downward, it is a short entry signal.
Confirm the signal with an increase in trader volume or other relevant indicators.
Place a sell order at the next closing price.
Exit Signal (Closing a Position):
To close a long position, wait for a signal reversal, such as the Hull Moving Averages crossing downwards or a change in the Hull Waves range.
To close a short position, wait for a signal reversal, such as the Hull Moving Averages crossing higher or a change in the Hull Waves range.

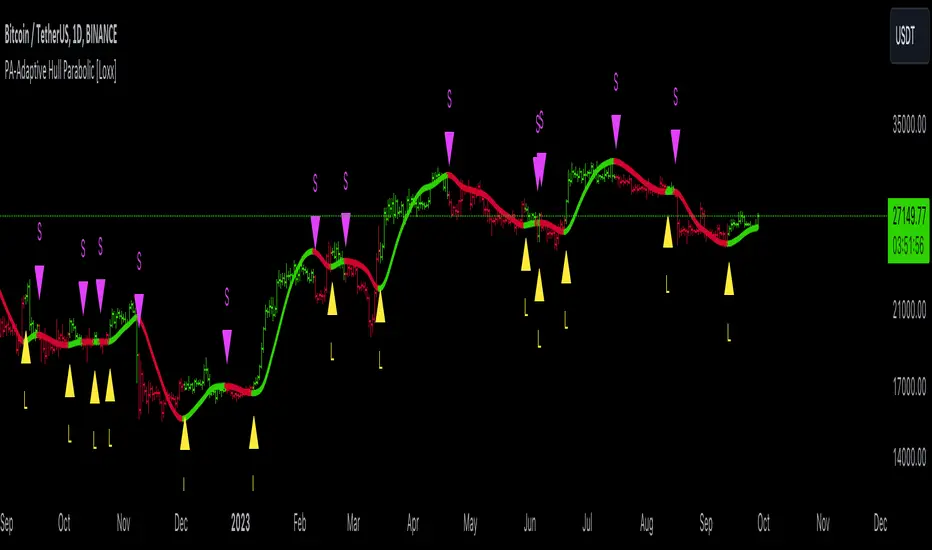
PA-Adaptive Hull Parabolic [Loxx]The PA-Adaptive Hull Parabolic is not your typical trading indicator. It synthesizes the computational brilliance of two famed technicians: John Ehlers and John Hull. Let's demystify its sophistication.
█ Ehlers' Phase Accumulation
John Ehlers is well-known in the trading community for his digital signal processing approach to market data. One of his standout techniques is phase accumulation. This method identifies the dominant cycle in the market by accumulating the phases of individual cycles. By doing so, it "adapts" to real-time market conditions.
Here's the brilliance of phase accumulation in this code
The indicator doesn't merely use a static look-back period. Instead, it dynamically determines the dominant market cycle through phase accumulation.
The calcComp function, rooted in Ehlers' methodology, provides a complex computation using a digital signal processing approach to filter out market noise and pinpoint the current cycle's frequency.
By measuring and adapting to the instantaneous period of the market, it ensures that the indicator remains relevant, especially in non-stationary market conditions.
Hull's Moving Average
John Hull introduced the Hull Moving Average (HMA) aiming to reduce lag and improve smoothing. The HMA's essence lies in its weighted average computation, prioritizing more recent prices.
This code takes an adaptive twist on the HMA
Instead of a fixed period, the HMA uses the dominant cycle length derived from Ehlers' phase accumulation. This makes the HMA not just fast and smooth, but also adaptive to the dominant market rhythm.
The intricate iLwmp function in the script provides this adaptive HMA computation. It's a weighted moving average, but its length isn't static; it's based on the previously determined dominant market cycle.
█ Trading Insights
The indicator paints the bars to represent the immediate trend: green for bullish and red for bearish.
Entry points, both long ("L") and short ("S"), are presented visually. These are derived from crossovers of the adaptive HMA, a clear indication of a potential shift in the trend.
Additionally, alert conditions are set, ready to notify a trader when these crossovers occur, ensuring real-time actionable insights.
█ Conclusion
The PA-Adaptive Hull Parabolic is a masterclass in advanced technical indicator design. By marrying John Ehlers' adaptive phase accumulation with John Hull's HMA, it creates a dynamic, responsive, and precise tool for traders. It's not just about capturing the trend; it's about understanding the very rhythm of the market.
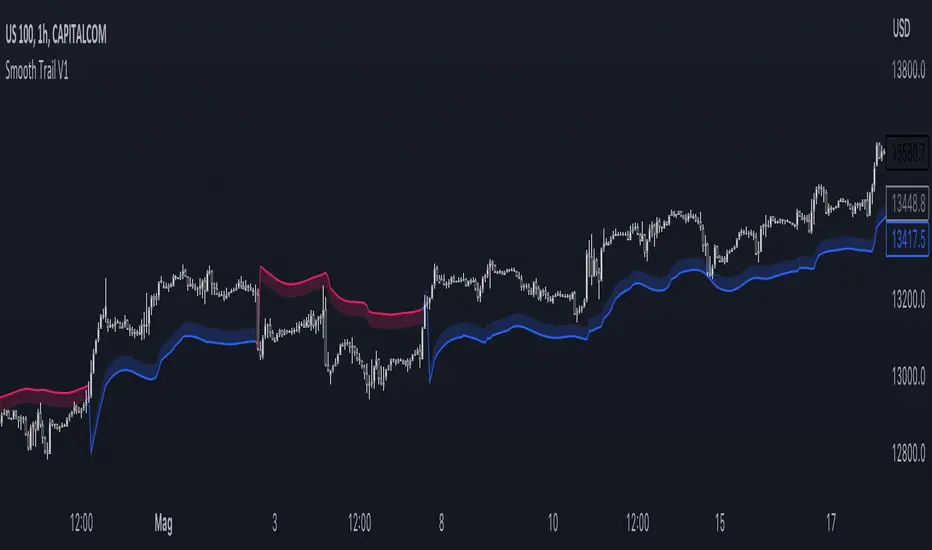
Smooth Trail V1Please, enjoy your new game changing tradingview indicator, may I present you: the Smooth Trail (first version).
The Smooth Trail is an indicator that works just like a super trend, but it has a completely different usage and potential.
The super trend works following the price and displaying a line that uses the ATR to determine how far it has to be from the actual price, and many new trader like to use the indicator thanks to his easy readability and the buy sell signals that it shows, unfortunately this is not the best usage of the indicator and it often leads to lose money on the markets.
The main characteristics that this indicator has is that, not like the normal super trend, it follow the trend the better adapting itself in the retracement phases.
The second feature that dictate the best usage of this indicator, is that it shows a zone in which to buy or sell to have the best risk to reward ratio.
The indicator also works as dynamic level of support and resistance and can be used the best for trend following strategies to maximize the profits.
The first input, the multiplier, is used to determine how many times the ATR has to be added or subtracted in order to plot the indicator.
The second input, the length, is used to determine how many candle the indicator and the ATR have to consider for the calculation.
The third and last input, the zone width, is used to calculate the width of the zone displayed by the indicator, and is the factor that will be multiplied to the ATR, this means that if you leave the settings as default, the zone will be 1 ATR or 34 candle width.
This indicator is great to use in confluence with other indicator or with various candlestick pattern.
PRICE CHANNEL MEAN REVERSIONThis script is a Fully Automated trading script meant to be used with "Oanda" broker and the plug-ins for algorithmic trading automation.( FOREX ONLY)
This script is meant to capture "MEAN REVERSION " for intraday charts (1hour) preferably and will hold for days / weeks .trading on forex markets.
(The combination of indicators includes a high and low price channel along with a fast moving average)
This script is original in the description of Alan Hulls moving average combined with the high and low closing of price action.
The concept of this mean reversion strategy is to try and capture price exhaustive moves . The moving average is fast and most times remains in the channel. when the moving average overshoots the channel the average price of the instrument is thought to be rising or falling faster then average, indicating a possibility that the instrument may revert (pull back) this strategy aims to capture that pull back.
This strategy uses a higher risk than reward profile to jump in front of market moves (4 risk to 1 reward)
in the likelihood the instrument will revert back (example) 25 pips before it continues 100 pips in the current direction.
This strategy should only be used in markets that you believe are mean reverting at the time of trading otherwise you will be jumping Infront of a possible trend and the price can continue in the trending direction for an unknown specified amount of time.
This script uses a (user defined period) fast moving average ( green/red color) and (user defined period) price channel (White/Blue) chosen in the indicator settings menu.
The default parameters are 55 with a (minimum of 1 and maximum of 10000) for the moving average and 50 with a (minimum of 1 and maximum of 10000) for the price channel , the default parameters = roughly 2 days of price action on the (1 hour) chart.
"The default parameters should be kept unless you fully understand the complete strategy"
the upper band (white line) is the highest close of the specified period and the lower band (blue line) is the lowest close of the same period.
When the fast moving average over shoots the price channel (exits) then crosses back into the price channel (enters) it will trigger a long or short trade.
The long signal is given when the the moving average crosses below the low band then crosses back above the low band . The trade long trade will be entered and the trade will exit if the stop loss or profit targets are hit or if the short signal is given the trade will close then reverse.
The short trade will be entered if the fast moving average crosses above the upper band (white line) then crosses back down through the upper band (white line) The trade short trade will be entered and the trade will exit if the stop loss or profit targets are hit or if the long signal is given the trade will close then reverse.
When the trade is entered a red , a blue and green horizontal dotted line will appear on the chart.
the blue line is the strategy entry price , the red line is the stop loss price , and the green line is the take profit price . the colors will invert if the trade is long or short.
(Setting alerts should be done in the indicator settings menu, and the parameters you chose will determine the stop loss/target and the amount of "units = (position size)" you wish to trade for the (forex only) markets. using "alert() function calls only" is the only alert that should be used with this strategy.
(note : when "alert() function calls only" is set two messages will be sent, one closing any open position in the opposite direction and one placing the new order regardless if you are currently in a trade or not)
Trade targets , stoploss and trade position size are a user defined variables entered in the indicator settings menu. (target pips minimum 0 and a maximum of 1000)(stop pips minimum of 0 and maximum of 1000)
Back test date range is included in the script for back testing different data periods.
the back ground will be colored a transparent navy blue if the period you are looking trading is with in the date range( note: to place live trades the end date will need to be in the future)
this is also adjustable in the settings menu
The avoid spread filter is a user defined time in which the spread is typically higher than average, applying this filter avoids trades in the specified time. When this filter is applied there will be a transparent red back ground color in the specified time.
Back test default setting are equivocal to OANDA:NZDUSD
at the time of this publication placing trades with the "Oanda" broker are as follows , NZD units = 3250 equal 2000 USD position size . "Oanda" current leverage is 33.3 to 1 for this particular pair and commission is paid in spread (1.7) pips = 0.55 USD per trade , Margin required for the trade is 60.50 USD , Position sizing = 6.5% of a 1000 USD account. OANDA:NZDUSD
Premium Smart Exit HMA [ByteBoost]The Premium Smart Exit HMA strategy is designed for fast-paced trend detection and is well-suited for small trades in highly volatile markets. It utilizes the Hull Moving Average (HMA) as a signal to execute trades and offers customizable inputs for price calculation, period settings, and stop loss/take profit levels. The strategy aims to reduce lag associated with traditional moving averages, allowing it to catch trends quickly.
Development Notes
This Strategy was developed with the PineScript language, version 5. The aim of the strategy is to provide a trading system that catches fast trend reversals and uses a modified version of the Hull Moving Average. The HMA adeptly adapts to swift variations in price movements while offering better smoothing and utilizes a user selected moving averages, mitigating the smoothing effect and is controlled with a custom weight design.
Features
Customizable trading periods.
Customizable stop loss and take profit levels.
Adjustable date range for backtesting.
Allows setting of initial capital, commission type and value.
Provides visual aids for better understanding of the market trends.
Customize the visuals of the strategy.
Strategy Description
The Smart Exit HMA strategy offers the flexibility to use various types of moving averages, allowing customization of inputs for price calculation, period settings, and stop loss/take profit levels. The strategy relies on the Hull Moving Average (HMA) as a signal to execute trades. However, you have control over the signal frequency by selecting your preferred period value, which determines the number of candles used in the average calculation. This allows you to adapt the strategy to market tendencies and increase its effectiveness during clear trends.
The Smart Exit HMA strategy is designed to minimize lag associated with traditional moving averages, enabling it to respond more quickly to recent price movements based on your chosen period. It's worth noting that the strategy plots two lines on the graph: the average line and the square root line. Buy and sell signals are generated when both lines intersect, indicating favorable trading opportunities.
Inputs/Settings
Capital - If using any leverage multiply the amount of money to invest by the leverage, else input the amount to be invested in every trade.
Start date - The date from which the strategy should begin its analysis. Leave unchanged to start from the earliest available date based on your account's plan.
End date - The date until which the strategy should conduct its analysis. Leave unchanged to continue until the current date.
Period - The lookback period for the moving average calculation, a longer period will translate into fewer trades that last longer.
Stop loss - Allows the use of a stop loss for all trades.
Take profit - Activates the use of a take profit for all trades.
Stop loss value - The distance from the entry price at which the strategy should exit to prevent further losses.
Take profit value - The distance from the entry price at which the strategy should exit to secure profits.
Take profit % - The percentage of the capital to take as profit.
Stop loss % - The percentage of the capital to set as the maximum loss.
Candles exit - The minimum number of candles before the strategy is allowed to close a trade.
Candles change - The minimum number of candles before the strategy is allowed to change the current trend.
Moving average type - Determines the preprocessing method applied prior to utilizing the HMA.
Custom weight - Enables the utilization of a personalized weighting system for the HMA. If chosen, ensure that the sum of all weights equals 1.
Open weight - Determines the weight assigned to the candle's open value.
Close weight - Specifies the weight assigned to the candle's close value.
High weight - Sets the weight attributed to the candle's high value.
Low weight - Determines the weight assigned to the candle's low value.
Highlighter - Light coloring between the trend and average price of each bar.
Signal labels - View the labels indicating a new long or short position.
Exit labels - Displays the labels indicating exit points.
Color long - Sets the color scheme for a new long position.
Color short - Sets the color scheme for a new short position.
Color exit - Decides the color scheme for the exit tag and cross shown.
Indicator Visuals
The strategy plots the two trendlines on the chart and changes its color based on its direction. It also plots shapes on the chart to denote potential buy (Long) and sell (Short) points where the signals of short and long will appear, as well as crosses for the exit points.
Strategy Alerts
The strategy does not include built-in alerts. However, alerts can be added using the TradingView interface based on the strategy's buy, sell and exit conditions. This way you will be able to receive notifications on your computer or phone when a new signal goes out.
Details
Repainting: It is important to mention that the strategy can mark an uptrend signal during a candle and disappear at the end of it, so please just put long or short when the buy/sell conditions are followed and marked by the strategy at the end of each candle.
Conclusion
The Premium Smart Exit HMA is a versatile strategy that combines the benefits of the Hull Moving Average with adjustable parameters to suit individual trading styles. It offers a combination of speed and smoothness, which can be beneficial in volatile markets.
Disclaimer
This strategy is provided as-is, with no guarantee of profits or responsibility for losses. Trading involves risk, and you should only trade with money you can afford to lose. Always conduct your own research and consider your financial situation before engaging in trading.
