Hull Hareketli Ortalaması (HMA)


ck - CryptoSniper (Indicator) v1Due to popular demand, here is an Indicator version on Cryptosniper v1 (with alerts).
This indicator repaints and should be used with a confirmation indicator as part os your strategy.

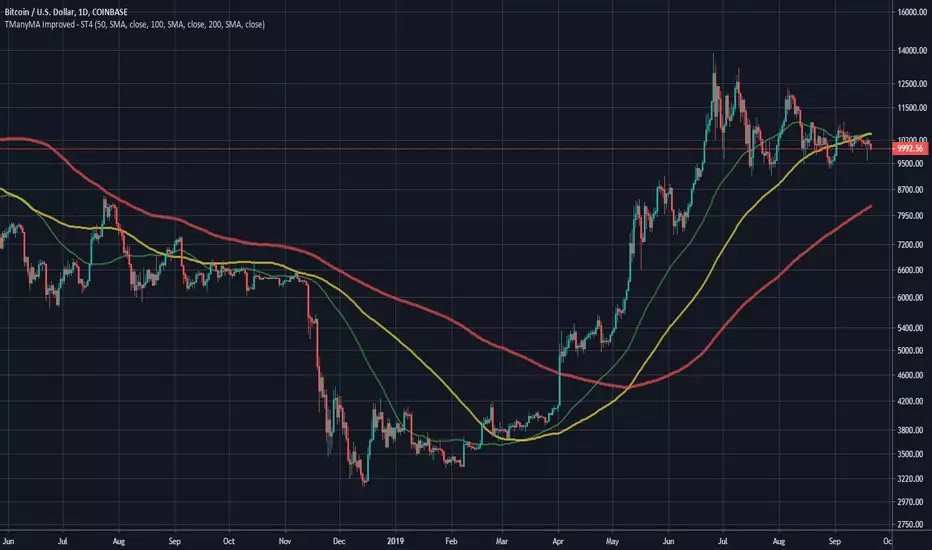
Scripting Tutorial 4 - Triple Many Moving Averages ImprovedThis script is for a triple moving average indicator where the user can select from different types of moving averages and periods. This script improves upon tutorial 3 by adding source selection for MAs and another option for an MA that is not built-in, the HMA. It is meant as an educational script with well formatted styling, and references for specific functions.
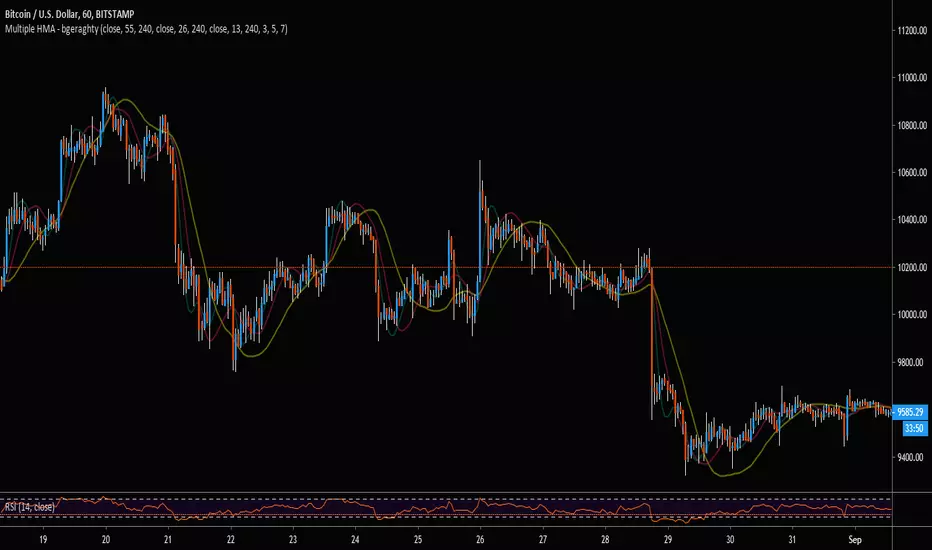
Multiple HMA - bgeraghtyTo save space on a chart's maximum indicator count, this single indicator includes:
- Three Hull Moving Averages, Defaulted to 13, 26, and 55 Periods.
- Customizable Time-Frame for Each HMA.
- Customizable Triple Weighted MA Smoothing for Jagged Lines from Higher Time-Frame
- Alert Conditions for Price Cross Over/Under the HMAs.
Double RSI StudyHere is the study version of our recent Double RSI strategy based on a Hull RSI and ALMA RSI.
The study version includes alerts for signals generated by both RSI's. It also includes an option to allow repeat signals, as well as tons of plotting options, etc.
If interested in a 3 day trial, feel free to send a message and check out our website ProfitProgrammers.com !

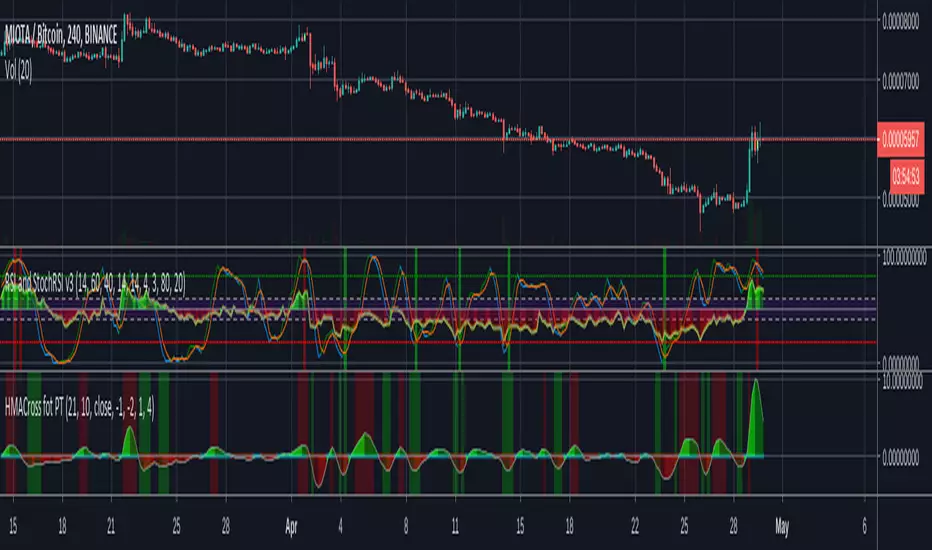
Double RSI Strategy(ALMA RSI + Hull RSI)We're back at it with a brand new strategy centered around an Arnaud Legoux RSI and Hull RSI. This one took a lot longer to make than usual, which is the reason there hasn't been any new posts the last week.
The first component of the strategy is the Hull RSI. The Hull RSI is shown in light blue and its upper and lower bounds are plotted as the dark pink and teal horizontal lines. Applying a Hull Moving Average to the RSI results in higher smoothness and less false signals. The lengths of the RSI and the HMA of the RSI can both be adjusted by the user.
We then used a similar process to calculate an Arnaud Legoux Moving Average(ALMA) of the RSI. The ALMA RSI is shown as the solid white line, while its upper and lower thresholds are the green and red horizontal lines. The ALMA RSI is a great tool since it is adaptable for multiple different uses - users can adjust the offset, sigma, and length values to modify the RSI's responsiveness and smoothness.
Input Options for ALMA RSI:
-Offset : Value in range {0,1} that adjusts the curve of the Gaussian Distribution. A higher value will result in higher responsiveness but lower smoothness. A lower value will mean higher smoothness but less responsiveness.
-Length : The lookback for each ALMA calculation.
-Sigma : Defines the sharpe of the curve coefficients.
The entry and exit signals generated by the Hull RSI are represented by the small green(buy) and red(sell) circles, while the green and red vertical highlights are the ALMA RSI's buy and sell signals. By default, we set the pyramiding to 3, with 50% equity used in each trade to allow the ALMA to make the longer-term swing trades and higher frequency trades made with the Hull RSI.
The strategy will be posted on our website, ProfitProgrammers.com, soon. As always, we will be offering 3 day trials for this strategy so feel free to send a quick message to start the trial period!

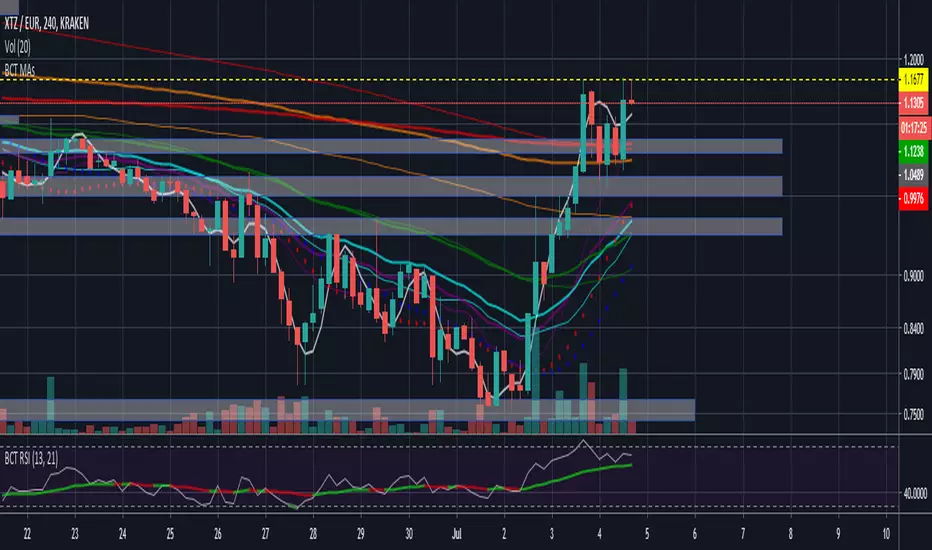
OBV with Auto Fibonacci LevelsI like to use OBV as a summary of the order book action + I added Fib levels from my other script for more context. I typically trade swings on H4, and HMA of the OBV helps me set the bias/trend.

Hull RSI
This is an RSI that is smoothed with a faster Hull Moving Average. The upper pink and bottom teal lines represent the 95th and 5th percentiles of Hull RSI values over a window of user-defined length.
The two percentile bands function identically to the traditional upper and lower bounds used in the standard RSI setup. Buy signals are plotted as the vertical green background highlights and sell signals are the red highlights. Buy signal is generated when RSI is below the lower teal line and then crosses above it. Sell signals occur when Hull RSI was previously above the upper pink line and then crosses back under.

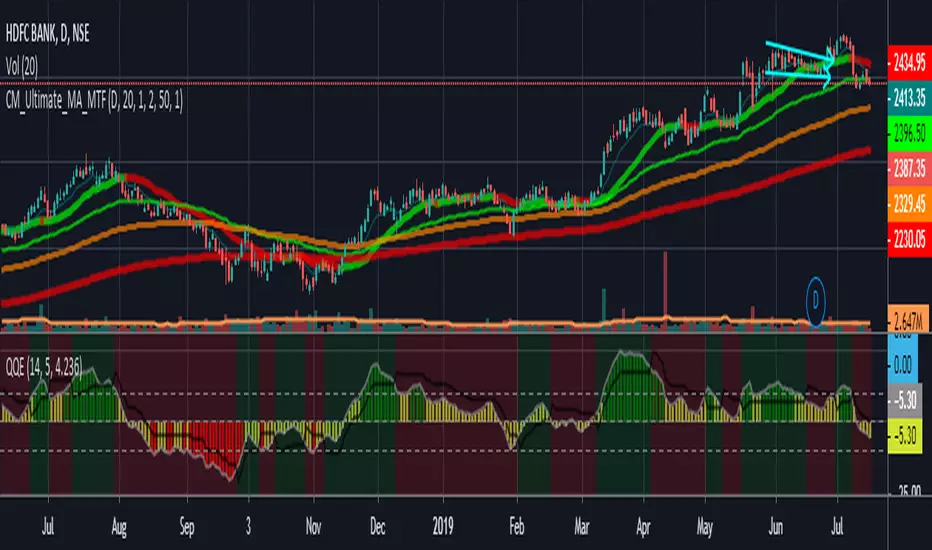
Ultimate_MA_MTF_CMChrisMoody MTF Ultimate Moving Average combined
with Exponential Moving Averages with Price line, i needed to analyze stocks
I have added 50, 100, 200 Period Moving Average to Chrismoody's UMA_MTF
Chris's MA can be found at
i have just combined these averages in a script major contribution goes to chris not me
please look at his indicator still is million times better than me
ck - CryptoSniper Longs Only (Strategy) v1Hey all,
This is a new script I have been working on and is in Beta testing stage.
It is best used for scalping 1/3/5/10/15 minutes.
Default settings are great for scalping, changing the “Period” will allow you to tweak for swing trades.
To use manually, you will get a Green triangle to alert you to be prepared to place an order.
This will happen 1 candle before the strategy paints an “open long” label on the chart.

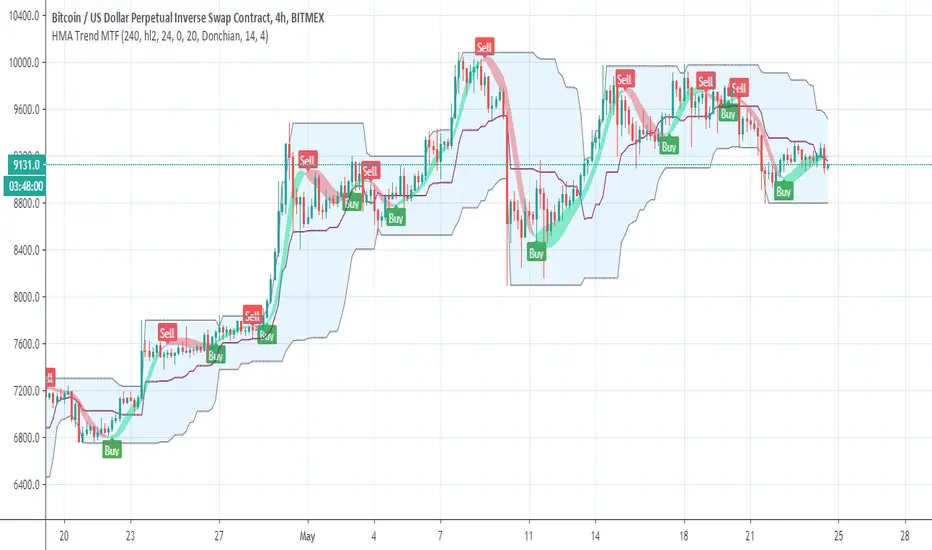
Hull Trend MTFhull trend taken from
So add MTF function and alert for the buy and sell (in the MTF shift set to 0 , if repaint then set shift to 1)
the blue line is linear regression trend
Hull TrendHere we are using Hull Moving Average crossovers as an experiment in trend detection.
The Hull Moving Average (HMA) is an extremely fast and smooth moving average.
Credit to alexgrover & RicardoSantos:

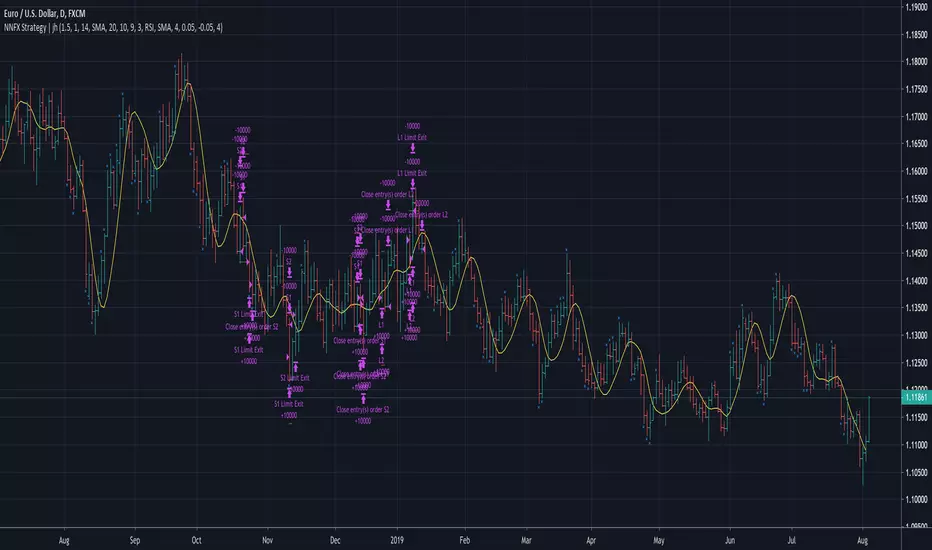
No Nonsense NNFX VP Strategy for Back Testing | jhMy first script, be kind :)
Most of the rules are implemented:
- Money management
- ATR, Baseline, Confirmation, Volume, Exit
More details below.
//////////////////////////////////////////////////////////////////////////////////////////////////////////////////////////////////
//////////////////////////////////////////////////////////////////////////////////////////////////////////////////////////////////
//Designed per No Nonsense Forex VP rules
//Made to be as modular as possible, so we can swap the indicators in and out.
//Originated from causecelebre
//Tried to put in as much VP rules as possible
///////////////////////////////////////////////////
//Rules Implemented:
///////////////////////////////////////////////////
// - SL 1.5 x ATR
// - TP 1 x ATR
//
// - Entry conditions
//// - Entry within 1 candles of baseline + 1 x confirmation + volume
//// - Entry only if baseline is < 1 x ATR
// - Exit conditions
//// - Exit on exit indicator or when baseline or confirmation flip
///////////////////////////////////////////////////
//Trades entries
///////////////////////////////////////////////////
// - First entry L1 or S1 with standard SL and TP
// - Second entry L2 or S2 with standard SL and exit upon the exit conditions
///////////////////////////////////////////////////
//Included Indicators and settings
///////////////////////////////////////////////////
// - Baseline = HMA 20
// - Confirmtion = SSL 10
// - Volume = TDFI 4
// - Exit = RVI 4
///////////////////////////////////////////////////
//Credits
// Strategy causecelebre
// TDFI causecelebre
// SSL Channel ErwinBeckers
//////////////////////////////////////////////////////////////////////////////////////////////////////////////////////////////////
//////////////////////////////////////////////////////////////////////////////////////////////////////////////////////////////////
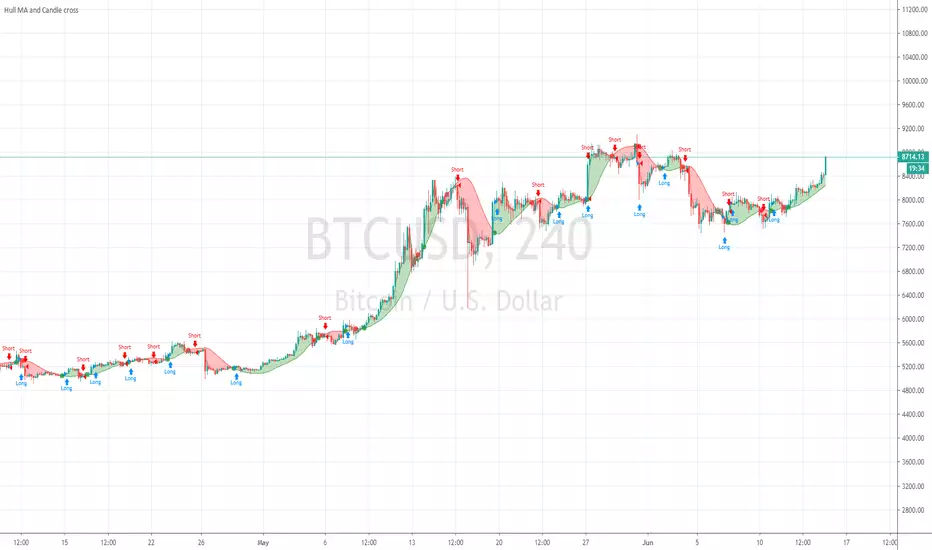
Hull MA and Candle crossHull MA vs price cossover . not 2 Hull MA's crossing, and also a price vs previous price crossover :
current price higher than previous = buy
current price lower than previous = sell
Price value set to OPEN to avoid repaint during candle
Legoux_MA<>Hull_MAArnaud Legoux MA > Hull MA
Long Hull period default, for use with low timeframe
probably not as good if a trading commision is applied etc
script open, help yourself :)

TH_MA Directional ChangeSimple script
Plot flag on chart when HMA (default), EMA or SMA is changing direction.

HMA ATR Range v2In Alan Hull's books he talks about his 'range indicator' which is the HMA and ATR to give buy / hold / sell signals.
It is the HMA with the ATR SL with the Trend and (ATR multiplier * Period) + HMA for the TP (upper range)

HMA ATR RangeIn Alan's books he talks about his 'range indicator' which is the HMA and ATR to give buy / hold / sell signals. This is my version as he doesnt give the formula.
It is the HMA with the ATR added and subtracted and plotted above & below the HMA to create a range.
According to Alan's terminology: HMA = Central Cord, SL = Lower deviation, TP = Upper deviation

Exponential Hull MA Oscillator PrototypeClamped EHMA Oscillator Prototype with 21/200 EHMA with additional JMA smoothing (Credit: @everget)
Note: This is an experiment - this is not a polished indicator

HMA=WMA(2*WMA(n/2)−WMA(n)),sqrt(n))3 Hull moving averages
Hull MA 1 (shortest period) crossing Hull MA 2 is buy and sell signal, 3rd MA (longest period) to show overall trend
Pivots included