EMA 21 Distance Hist - Diamonds V2EMA distnce with 8/21 cross . Also shows mometum and 8/21 based Buy or sell
Üstel Hareketli Ortalama (EMA)

EMA 21 Distance Hist - DiamondsIt shows distance from EMA. purple bars show the continuation of momentum and changes red bars to purple. Diamonds show 8/21 EMA cross.

EMA 21 Distance Histogram - TOS Style V2This script displays the distance from EMA. if momentum is on the same side, the following red bar paints as purple to show the continuation of the momentum.

EMA 21 Distance IndicatorSImple Indicator which displays the price difference from 21 EMA as Red and green to easily identify if the price is reaching any extreme.

DP_MoneyFlow_Osc_V4**DP_Moneyflow_Osc_V4** is a custom, volume‐weighted momentum oscillator built around the classic Money Flow Index (MFI), with a few twists to help you spot more reliable reversal points:
***Best way to use it is to take the signals as alert points, to understand when money is starting to flow in or starting to flow out. It is not intended to be a Buy or Sell signal at the point of entry where the label is printed.***
1. **Core Calculation**
* Computes the standard MFI on your chart’s native timeframe:
* Money Flow = typical price (H+L+C)/3 × volume
* Segregates positive vs. negative flow based on whether price rose or fell on each bar
* Smooths each with an N-bar SMA, forms the ratio, and maps it into a 0–100 scale
2. **Inversion & Smoothing**
* You can **invert** the oscillator around 50 (so peaks become troughs and vice versa) with the **Reverse MFI** toggle.
* Applies two layers of smoothing (one for raw noise reduction, another for longer-term trend stability).
3. **Dynamic Coloring**
* Above Overbought (OB) threshold → solid red; below Oversold (OS) → solid green.
* In between, it linearly fades from red/green toward black as it approaches the 50 midpoint.
* **Invert Colors** flips the hue logic (red ↔ green) if you prefer.
4. **Overbought/Oversold Zones**
* Plots horizontal lines at your chosen OB/OS levels.
* Optionally fills the zone between them for quick visual reference.
5. **Peak/Trough Signal Labels**
* Detects **true extremes** by finding when the oscillator reverses direction right at or beyond your OB/OS levels.
* Prints a tiny “OB” or “OS” label **exactly at that pivot bar**, so you see the high or low of the swing.
6. **Alternation Toggle**
* Prevents two consecutive “OS” or “OB” labels by enforcing strict Buy/Sell alternation—turn this on or off via **Enable Signal Alternation**.
---
**Use-Case**: This oscillator excels at pinpointing the *tops* and *bottoms* of strong volume‐backed moves, giving you clear pivot markers rather than every threshold crossover. Tweak the smoothing and threshold inputs to calibrate sensitivity to your market and timeframe.

Toolbar-FrenToolbar-Fren is a comprehensive, data-rich toolbar designed to present a wide array of key metrics in a compact and intuitive format. The core philosophy of this indicator is to maximize the amount of relevant, actionable data available to the trader while occupying minimal chart space. It leverages a dynamic color-coded system to provide at-a-glance insights into market conditions, instantly highlighting positive/negative values, trend strength, and proximity to important technical levels.
Features and Data Displayed
The toolbar displays a vertical column of critical data points, primarily calculated on the Daily timeframe to give a broader market context. Each cell is color-coded for quick interpretation.
DAY:
The percentage change of the current price compared to the previous day's close. The cell is colored green for a positive change and red for a negative one.
LOD:
The current price's percentage distance from the Low of the Day.
HOD
The current price's percentage distance from the High of the Day.
MA Distances (9/21 or 10/20, 50, 200)
These cells show how far the current price is from key Daily moving averages (MAs).
The values are displayed either as a percentage distance or as a multiple of the Average Daily Range (ADR), which can be toggled in the settings.
The cells are colored green if the price is above the corresponding MA (bullish) and red if it is below (bearish).
ADR
Shows the 14-period Average Daily Range as a percentage of the current price. The cell background uses a smooth gradient from green (low volatility) to red (high volatility) to visualize the current daily range expansion.
ADR%/50: A unique metric showing the distance from the Daily 50 SMA, measured in multiples of the 14-period Average True Range (ATR). This helps quantify how extended the price is from its mean. The cell is color-coded from green (close to the mean) to red (highly extended).
RSI
The standard 14-period Relative Strength Index calculated on the Daily timeframe. The background color changes to indicate potentially overbought (orange/red) or oversold (green) conditions.
ADX
The 14-period Average Directional Index (ADX) from the Daily timeframe, which measures trend strength. The cell is colored to reflect the strength of the trend (e.g., green for a strong trend, red for a weak/non-trending market). An arrow (▲/▼) is also displayed to indicate if the ADX value is sloping up or down.
User Customization
The indicator offers several options for personalization to fit your trading style and visual preferences:
MA Type
Choose between using Exponential Moving Averages (EMA 9/21) or Simple Moving Averages (SMA 10/20) for the primary MA calculations.
MA Distance Display
Toggle the display of moving average distances between standard percentage values and multiples of the Average Daily Range (ADR).
Display Settings
Fully customize the on-chart appearance by selecting the table's position (e.g., Top Right, Bottom Left) and the text size. An option for a larger top margin is also available.
Colors
Personalize the core Green, Yellow, Orange, and Red colors used throughout the indicator to match your chart's theme.
Technical Parameters
Fine-tune the length settings for the ADX and DI calculations.

Multi-Timeframe 20 EMA Horizontal LinesOverview
This Multi-Timeframe 20 EMA indicator provides intelligent trend analysis by displaying your current timeframe EMA alongside relevant higher timeframe EMA levels as horizontal support/resistance lines. On lower timeframes, you see all higher EMA levels for comprehensive multi-timeframe confluence, while on higher timeframes, it filters out lower timeframe noise to maintain focus on macro trends. This allows traders to align short-term entries with long-term market structure, identifying high-probability setups where multiple timeframe EMAs converge while using the current timeframe EMA for precise timing.
Feature
Multi-Timeframe Horizontal EMA Lines
The indicator fetches and displays 20 EMAs from five higher timeframes:
Daily (D): Daily 20 EMA
Weekly (W): Weekly 20 EMA
Monthly (M): Monthly 20 EMA
Quarterly (Q): 3-Month 20 EMA
Half-Yearly (HY): 6-Month 20 EMA
Intelligent Timeframe Filtering
Smart Display Logic: Only shows EMAs from timeframes higher than your current chart timeframe
Prevents Redundancy: Automatically filters out lower timeframe EMAs to avoid clutter
Example: On a 4-hour chart, you'll see Daily, Weekly, Monthly, Quarterly, and Half-Yearly EMAs, but on a Weekly chart, you'll only see Weekly and higher timeframes
Half-Yearly (HY): 6-Month 20 EMA
Shows only current timeframe EMA with half-yearly horizontal line, filtering out all lower timeframes.
Quarterly (Q): 3-Month 20 EMA
Displays current timeframe EMA with quarterly and higher horizontal lines, hiding monthly, weekly, and daily EMAs.
Monthly (M): Monthly 20 EMA
Shows current timeframe EMA with monthly and higher horizontal EMAs, excluding weekly and daily timeframes.
Weekly (W): Weekly 20 EMA
Displays current timeframe EMA with weekly and higher horizontal EMA lines, filtering out daily timeframe.
Daily (D):
Shows current timeframe EMA with all higher timeframe horizontal EMAs (daily, weekly, monthly, quarterly, half-yearly).
Note: Make sure to enable Price-Line in Style Settings after Importing Script.

Color Change EMA 200 (4H)200 Color Change EMA (4H Locked)
Overview
This indicator displays a 200-period Exponential Moving Average (EMA) that is locked to the 4-hour timeframe, regardless of what chart timeframe you're currently viewing. The EMA line changes color dynamically based on price action to provide clear visual trend signals.
Key Features
• Multi-Timeframe Capability : Always shows the 4H 200 EMA on any chart timeframe
• Dynamic Color Coding :
- Green: Price is above the 200 EMA (bullish condition)
- Red: Price is below the 200 EMA (bearish condition)
• Clean Visual Design : Bold 2-pixel line width for clear visibility
• Real-time Updates : Colors change instantly as price crosses above or below the EMA
How to Use
1. Add the indicator to any timeframe chart
2. The 4H 200 EMA will appear as a smooth line
3. Watch for color changes:
- When the line turns green, it indicates price strength above the key moving average
- When the line turns red, it suggests price weakness below the moving average
4. Use for trend identification, support/resistance levels, and entry/exit timing
Best Practices
• Combine with other technical analysis tools for confirmation
• Use the color changes as alerts for potential trend shifts
• Consider the 200 EMA as a major support/resistance level
• Works well for swing trading and position sizing decisions
Settings
• Length : Default 200 periods (customizable)
• Source : Default closing price (customizable)
Perfect for traders who want to keep the important 4H 200 EMA visible across all timeframes with instant visual trend feedback.

SMEMA Trend CoreSMEMA Trend Core is a multi-timeframe trend analysis tool designed to provide a clean, adaptive and structured view of the market’s directional bias. It can be used in short term, swing or long term contexts. The internal calculation adjusts automatically based on the selected trading style, while always combining data from six timeframes.
At its core, the indicator uses a SMEMA, which is a Simple Moving Average applied to an EMA. This combination improves smoothness without losing reactivity. The SMEMA is calculated separately on 1H, 4H, 1D, 3D, 1W and 1M timeframes. These six values are then combined using dynamic weights that depend on the trading mode:
Short Term mode gives more influence to 1H and 4H
Swing Trading mode gives more influence to 1D, 3D and 1W
Long Term mode gives more influence to 1W and 1M
However, all six timeframes are always included in the final result. This avoids the tunnel vision of relying on a single resolution and ensures that the indicator captures both local and structural movements.
The result is a synthetic trend line, called Global SMEMA, that adapts to market conditions and offers a realistic view of the ongoing trend. To enhance the reading, the indicator calculates a Trend Score. This score reflects the position of price relative to the Global SMEMA, scaled by a long-term ATR, and adjusted by the slope of the trend line. A hyperbolic tangent function is used to normalize values and reduce distortion from outliers.
The final score is capped between -10 and +10, and used to define the trend state:
Green when the trend is bullish (score > +1.5)
Red when the trend is bearish (score < -1.5)
Brown when the trend is neutral (score between -1.5 and +1.5)
Optional Deviation Bands can be displayed at ±1, ±2 and ±3 ATR distances around the central line. These dynamic zones help identify extended price movements or potential support and resistance areas, depending on the current trend bias.
Main features:
A single, stable trend line based on six timeframes
Automatic rebalancing depending on trading mode
Quantified score integrating distance and slope
No overreaction to short-term noise
Deviation zones for advanced market context
No repainting, no lookahead, 100% real-time
SMEMA Trend Core is not a signal tool. It is a directional framework that helps you stay aligned with the real structure of the market. Use it to confirm setups, filter trades or simply understand where the market stands in its trend cycle.

MA Cross MTF Alert (Miu)This script extends the classic moving average crossover strategy with support for up to 8 user-defined symbols across 4 custom timeframes, combined with a visual and alert system designed for traders who monitor multiple assets simultaneously.
Unlike traditional MA crossover tools, this script enables traders to receive real-time alerts for crossovers across multiple assets and timeframes, even when the script is not actively displayed on the chart — ideal for passive monitoring in multi-asset strategies.
What it does:
This script calculates two customizable moving averages (SMA or EMA) for each selected symbol and timeframe.
It then tracks crossover events:
- Bullish crossover when the fast MA crosses above the slow MA
- Bearish crossunder when the fast MA crosses below the slow MA
On the chart, it also displays the crossover signals for the current symbol and timeframe using color-coded cross icons.
Key features:
- Select SMA or EMA type for both moving averages
- Customize MA lengths and colors
- Works with any asset and timeframe
- Alerts include symbol and timeframe info for easy identification
How to use:
1) Add the indicator to your chart.
2) Choose the moving average type and lengths.
3) Enable/disable any of the 8 symbols and 4 timeframes.
4) Set up TradingView alerts by clicking “Create Alert” and selecting one of the alert() calls.
5) You will receive a message like:
BTC (1h) | MA Crossover ▲ or ETH (15m) | MA Crossunder ▼
Technical note:
This script uses request.security() to retrieve moving average values from up to 8 different symbols and 4 different timeframes in real time.
Feel free to leave your feedback or suggestions in the comments section below.
Enjoy!

Pucci Trend EMA-SMA Crossover with TolerancePucci Trend EMA-SMA Crossover with Tolerance
This indicator helps identify market trends and generates trading signals based on the crossover between an Exponential Moving Average (EMA) and a Simple Moving Average (SMA) with an adjustable tolerance threshold. The signals work as follows:
Buy Signal (B) -> Triggers when the EMA crosses above the SMA, exceeding a user-defined tolerance (in basis points). Optionally, a price filter can require the high or low to be below the EMA for confirmation.
Sell Signal (S) -> Triggers when the SMA crosses above the EMA, exceeding the tolerance. The optional price filter may require the high or low to be above the EMA.
The tolerance helps reduce false signals by requiring a minimum distance between the moving averages before confirming a crossover. The price filter adds an extra confirmation layer by checking if price action respects the EMA level.
Important Notes:
1º No profitability guarantee: This tool is for analysis only and may generate losses.
2º "As Is" disclaimer: Provided without warranties or responsibility for trading outcomes.
3º Use Stop Loss: Users must determine their own risk management.
4º Parameter adjustment needed: Optimal MA periods and tolerance vary by timeframe.
5º Filter impact varies: Enabling/disabling the price filter may improve or worsen performance.

Codigo Trading 1.0📌Codigo Trading 1.0
This indicator strategically combines SuperTrend, multiple Exponential Moving Averages (EMAs), the Relative Strength Index (RSI), and the Average True Range (ATR) to offer clear entry and exit signals, as well as an in-depth view of market trends. Ideal for traders looking to optimize their operations with an all-in-one tool.
🔩How the Indicator Works:
This indicator relies on the interaction and confirmation of several key components to generate signals:
SuperTrend: Determines the primary trend direction. An uptrend SuperTrend signal (green line) indicates an upward trend, while a downtrend (red line) signals a downward trend. It also serves as a guide for setting Stop Loss and Take Profit levels.
EMAs: Includes EMAs of 10, 20, 55, 100, 200, and 325 periods. The relationship between the EMA 10 and EMA 20 is fundamental for confirming the strength and direction of movements. An EMA 10 above the EMA 20 suggests an uptrend, and vice versa. Longer EMAs act as dynamic support and resistance levels, offering a broader view of the market structure.
RSI: Used to identify overbought (RSI > 70/80) and oversold (RSI < 30/20) conditions, generating "Take Profit" alerts for potential trade closures.
ATR: Monitors market volatility to help you manage exits. ATR exit signals are triggered when volatility changes direction, indicating a possible exhaustion of the movement.
🗒️Entry and Exit Signals:
I designed specific alerts based on all the indicators I use in conjunction:
Long Entries: When SuperTrend is bullish and EMA 10 crosses above EMA 20.
Short Entries: When SuperTrend is bearish and EMA 10 crosses below EMA 20.
RSI Exits (Take Profit): Indicated by "TP" labels on the chart, when the RSI reaches extreme levels (overbought for longs, oversold for shorts).
EMA 20 Exits: When the price closes below EMA 20 (for longs) or above EMA 20 (for shorts).
ATR Exits: When the ATR changes direction, signaling a possible decrease in momentum.
📌Key Benefits:
Clarity in Trend: Quickly identifies market direction with SuperTrend and EMA alignment.
Strategic Entry and Exit Signals: Receive timely alerts to optimize your entry and exit points.
Assisted Trade Management: RSI and ATR help you consider when to take profits or exit a position.
Intuitive Visualization: Arrows, labels, and colored lines make analysis easy to interpret.
Disclaimer:
Trading in financial markets carries significant risks. This indicator is an analysis tool and should not be considered financial advice. Always conduct your own research and trade at your own risk.

CHN BUY SELL with EMA 200Overview
This indicator combines RSI 7 momentum signals with EMA 200 trend filtering to generate high-probability BUY and SELL entry points. It uses colored candles to highlight key market conditions and displays clear trading signals with built-in cooldown periods to prevent signal spam.
Key Features
Colored Candles: Visual momentum indicators based on RSI 7 levels
Trend Filtering: EMA 200 confirms overall market direction
Signal Cooldown: Prevents over-trading with adjustable waiting periods
Clean Interface: Simple BUY/SELL labels without clutter
How It Works
Candle Coloring System
Yellow Candles: Appear when RSI 7 ≥ 70 (overbought momentum)
Purple Candles: Appear when RSI 7 ≤ 30 (oversold momentum)
Normal Candles: All other market conditions
Trading Signals
BUY Signal: Triggered when closing price > EMA 200 AND yellow candle appears
SELL Signal: Triggered when closing price < EMA 200 AND purple candle appears
Signal Cooldown
After a BUY or SELL signal appears, the same signal type is suppressed for a specified number of candles (default: 5) to prevent excessive signals in ranging markets.
Settings
RSI 7 Length: Period for RSI calculation (default: 7)
RSI 7 Overbought: Threshold for yellow candles (default: 70)
RSI 7 Oversold: Threshold for purple candles (default: 30)
EMA Length: Period for trend filter (default: 200)
Signal Cooldown: Candles to wait between same signal type (default: 5)
How to Use
Apply the indicator to your chart
Look for yellow or purple colored candles
For LONG entries: Wait for yellow candle above EMA 200, then enter BUY when signal appears
For SHORT entries: Wait for purple candle below EMA 200, then enter SELL when signal appears
Use appropriate risk management and position sizing
Best Practices
Works best on timeframes M15 and higher
Suitable for Forex, Gold, Crypto, and Stock markets
Consider market volatility when setting stop-loss and take-profit levels
Use in conjunction with proper risk management strategies
Technical Details
Overlay: True (plots directly on price chart)
Calculation: Based on RSI momentum and EMA trend analysis
Signal Logic: Combines momentum exhaustion with trend direction
Visual Feedback: Colored candles provide immediate market condition awareness

Directional Strength IndexThis indicator is designed to detect the dominant market direction and quantify its strength by aggregating signals across six key timeframes: 1H, 4H, 1D, 3D, 1W, and 1M.
At its core, it uses a SMEMA 'the Simple Moving Average of an EMA' as the main trend reference. This hybrid smoothing method was chosen for its balance: the EMA ensures responsiveness to recent price moves, while the SMA dampens short-term volatility. This makes the SMEMA more stable than a raw EMA and more reactive than a simple SMA, especially in noisy or volatile environments.
For each timeframe, a score between -10 and +10 is calculated. This score reflects:
- the distance of the price from the SMEMA, using ATR as a dynamic threshold
- the number of price deviations above or below the SMEMA
- the slope of the SMEMA, which adjusts the score based on momentum
These six timeframe scores are then combined into a single Global Score, using weighted averages. Three weighting profiles are available depending on your trading horizon:
- Long Term: emphasizes weekly and monthly data
- Swing Trading: gives balanced importance to all timeframes
- Short Term: prioritizes 1H and 4H action
This multi-timeframe aggregation makes the indicator adaptable to different styles while maintaining a consistent logic.
The result is displayed in a table on the chart, showing:
- the trend direction per timeframe (up, down or neutral)
- the strength score per timeframe
- the overall trend direction and strength based on the selected profile
Optional deviation bands based on ATR multiples are also plotted to provide visual context for overextensions relative to the SMEMA.
This indicator is non-repainting and built for objective, trend-based decision making.

5EMA_BB_ScalpingWhat?
In this forum we have earlier published a public scanner called 5EMA BollingerBand Nifty Stock Scanner , which is getting appreciated by the community. That works on top-40 stocks of NSE as a scanner.
Whereas this time, we have come up with the similar concept as a stand-alone indicator which can be applied for any chart, for any timeframe to reap the benifit of reversal trading.
How it works?
This is essentially a reversal/divergence trading strategy, based on a widely used strategy of Power-of-Stocks 5EMA.
To know the divergence from 5-EMA we just check if the high of the candle (on closing) is below the 5-EMA. Then we check if the closing is inside the Bollinger Band (BB). That's a Buy signal. SL: low of the candle, T: middle and higher BB.
Just opposite for selling. 5-EMA low should be above 5-EMA and closing should be inside BB (lesser than BB higher level). That's a Sell signal. SL: high of the candle, T: middle and lower BB.
Along with we compare the current bar's volume with the last-20 bar VWMA (volume weighted moving average) to determine if the volume is high or low.
Present bar's volume is compared with the previous bar's volume to know if it's rising or falling.
VWAP is also determined using `ta.vwap` built-in support of TradingView.
The Bolling Band width is also notified, along with whether it is rising or falling (comparing with previous candle).
What's special?
We love this reversal trading, as it offers many benifits over trend following strategies:
Risk to Reward (RR) is superior.
It _Does Hit_ stop losses, but the stop losses are tiny.
Means, althrough the Profit Factor looks Nahh , however due to superior RR, end of day it ended up in green.
When the day is sideways, it's difficult to trade in trending strategies. This sort of volatility, reversal strategies works better.
It's always tempting to go agaist the wind. Whole world is in Put/PE and you went opposite and enter a Call/CE. And turns out profitable! That's an amazing feeling, as a trader :)
How to trade using this?
* Put any chart
* Apply this screener from Indicators (shortcut to launch indicators is just type / in your keyboard).
* It will show you the Green up arrow when buy alert comes or red down arrow when sell comes. * Also on the top right it will show the latest signal with entry, SL and target.
Disclaimer
* This piece of software does not come up with any warrantee or any rights of not changing it over the future course of time.
* We are not responsible for any trading/investment decision you are taking out of the outcome of this indicator.

AutoFib Breakout Strategy for Uptrend AssetsThis trading strategy is designed to help you catch powerful upward moves on assets that are in a long-term uptrend, such as Gold (XAUUSD). It uses a popular technical tool called the Fibonacci Extension, combined with a trend filter and a risk-managed exit system.
✅ When to Use This Strategy
• Works best on higher timeframes: Daily (1D), 3-Day (3D), or Weekly (W).
• Best used on uptrending assets like Gold.
• Designed for swing trading – holding trades from a few days to weeks.
📊 How It Works
1. Find the Trend
We only want to trade in the direction of the trend.
• The strategy uses the 200-period EMA (Exponential Moving Average) to identify if the market is in an uptrend.
• If the price is above the 200 EMA, we consider it an uptrend and allow long trades.
2. Identify Breakout Levels
• The strategy detects recent high and low pivot points to draw Fibonacci extension levels.
• It focuses on the 1.618 Fibonacci level, which is often a target in strong trends.
• When the price breaks above this level in an uptrend, it signals a potential momentum breakout – a good time to buy.
3. Enter a Trade
• The strategy enters a long (buy) position when the price closes above the 1.618 Fibonacci level and the market is in an uptrend (above the 200 EMA).
4. Manage Risk Automatically
• The trade includes a stop-loss set to 1x the ATR (Average True Range) below the entry price – this protects against sudden drops.
• It sets a take-profit at 3x the ATR above the entry – aiming for higher rewards than risks.
⚠️ Important Notes
• 📈 Higher Timeframes Preferred: This strategy works best on Daily (D), 3-Day (3D), and Weekly (W) charts, especially on Gold (XAUUSD).
• 🧪 Not for Deep Backtesting: Due to the nature of how pivot points and Fib levels are calculated, this strategy may not perform well in backtesting simulations (because the historical calculations can shift). It is better used for live analysis and forward testing.

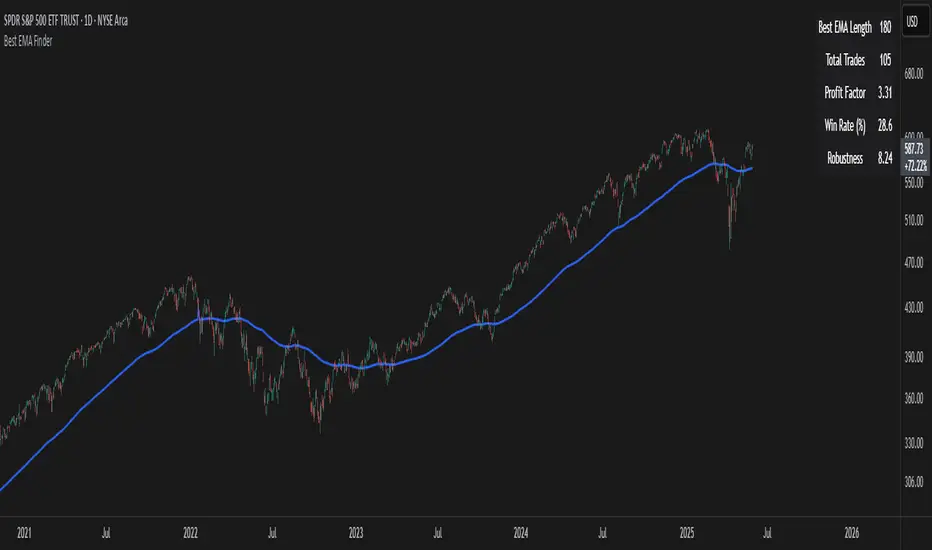
Best EMA FinderThis script, Best EMA Finder, is based on the same original logic as the Best SMA Finder I published previously. Although it was not the initial goal of the project, several users asked for an EMA version, so here it is.
The script scans a wide range of Exponential Moving Average (EMA) lengths, from 10 to 500, and identifies the one that historically delivered the most robust performance on the current chart. The choice to stop at 500 is deliberate: beyond that point, EMA curves tend to flatten and converge, adding processing time without meaningful differences in signals or outcomes.
Each EMA is evaluated using a custom robustness score:
Profit Factor × log(Number of Trades) × sqrt(Win Rate)
Only EMA lengths that exceed a user-defined minimum number of trades are considered valid. Among these, the one with the highest robustness score is selected and displayed on the chart.
A table summarizes the results:
- Best EMA length
- Total number of trades
- Profit Factor
- Win Rate
- Robustness Score
You can adjust:
- Strategy type: Long Only or Buy & Sell
- Minimum number of trades required
- Table visibility
This script is designed for analysis and optimization only. It does not execute trades or handle position sizing. Only one open trade per direction is considered at a time.
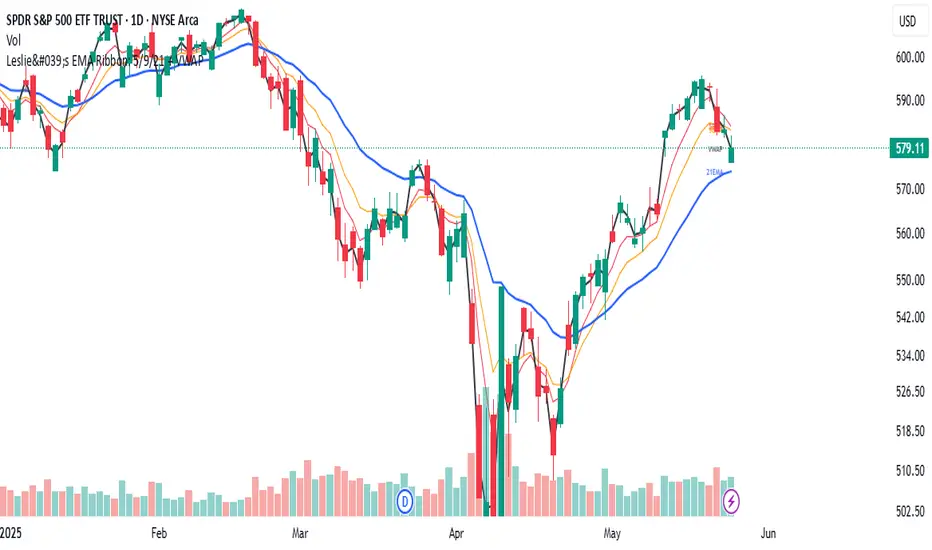
Leslie's EMA Ribbon: 5/9/21 + VWAPEMA + VWAP Crossover Indicator with Alerts
This script blends three Exponential Moving Averages (5, 9, 21) with VWAP to identify momentum shifts and volume-confirmed trend signals. It’s optimized for the Daily timeframe, but also adaptable to shorter-term trading.
🔍 Why this combination?
EMAs provide fast and reliable trend signals:
- 5/9 EMA crossover → short-term shifts (more frequent)
- 9/21 EMA crossover → swing confirmation (less noise)
- VWAP adds volume context used by institutions for fair value tracking.
- 9EMA crossing VWAP confirms price action supported by volume.
Together, these tools offer a multi-layered view of market momentum — combining speed, confirmation, and conviction.
⚙️ Features:
Clean plots with dynamic labels on latest bar
Adjustable line weights for clarity
Alerts included for all crossovers:
- 5EMA / 9EMA
- 9EMA / 21EMA
- 9EMA / VWAP
✅ How to Use:
- Best on the Daily timeframe
- Use 5/9 as early signals, 9/21 for trend filtering, and 9/VWAP for volume-backed setups
- Turn on alerts to stay informed of key shifts without staring at charts
EWMA & EWVar + EWStd Expansion with MTF_V.5EWMA & EWVar + EWStd Expansion with MTF_V.5
This indicator combines adaptive trend smoothing (EWMA), variance estimation (EWVar) and dynamic volatility “bursts” (EWStd Expansion) with optional higher-timeframe confirmation. It’s designed both for visual chart analysis and for automated alerts on regime changes.
Key Features
EWMA (Exponential Smoothing):
• Computes an exponential moving average with either a custom α or a length-derived α = 2/(N+1).
• Option to recalculate only every N bars (reduces CPU load).
EWVar & EWStd (Variance & Standard Deviation):
• Exponentially weighted variance tracks recent price dispersion.
• EWStd (σ) is computed alongside the EWMA.
• Z-score (deviation in σ units) shows how far price has diverged from trend.
Multi-Timeframe Filter (MTF):
• Optionally require the same trend direction on a chosen higher timeframe (e.g. Daily, Weekly, H4).
• Real-time lookahead available (may repaint).
Gradient Around EWMA:
• A multi-layer “glow” zone of ±1σ, broken into up to 10 steps.
• Color interpolates between “upper” and “lower” shades for bullish, bearish and neutral regimes.
Instantaneous Trendline (ITL):
• Ultra-fast trend filter with slope-based coloring.
• Highlights micro-trends and short-lived accelerations.
Cross-Over Signals (ITL ↔ EWMA):
• Up/down triangles plotted when the ITL crosses the main EWMA.
EWStd Expansion (Volatility Bursts):
• Automatically detects σ expansions (σ growth above a set % threshold).
• Price filter: only when price moves beyond EWMA ± (multiplier·σ).
• Optional higher-timeframe confirmation.
Labels & Alerts:
• Text labels and circular markers on bars where a volatility burst occurs.
• Built-in alertcondition calls for both bullish and bearish expansions.
How to Use
Visual Analysis:
• The gradient around EWMA shows the width of the volatility channel expanding or contracting.
• ITL color changes instantly highlight short-term impulses.
• EWMA line color switches (bullish/bearish/neutral) indicate trend state.
Spotting Volatility Breakouts:
• “EWStd Expansion” labels and circles signal the onset of strong moves when σ spikes.
• Useful for entering at the start of new impulses.
Automated Alerts:
• Set alerts on the built-in conditions “Bullish EWStd Expansion Alert” or “Bearish EWStd Expansion Alert” to receive a popup or mobile push when a burst occurs.
This compact tool unifies trend, volatility and multi-timeframe analysis into a single indicator—ideal for traders who want to see trend direction, current dispersion, and timely volatility burst signals all at once.

Momentum Long + Short Strategy (BTC 3H)Momentum Long + Short Strategy (BTC 3H)
🔍 How It Works, Step by Step
Detect the Trend (📈/📉)
Calculate two moving averages (100-period and 500-period), either EMA or SMA.
For longs, we require MA100 > MA500 (uptrend).
For shorts, we block entries if MA100 exceeds MA500 by more than a set percentage (to avoid fading a powerful uptrend).
Apply Momentum Filters (⚡️)
RSI Filter: Measures recent strength—only allow longs when RSI crosses above its smoothed average, and shorts when RSI dips below the oversold threshold.
ADX Filter: Gauges trend strength—ensures we only enter when a meaningful trend exists (optional).
ATR Filter: Confirms volatility—avoids choppy, low-volatility conditions by requiring ATR to exceed its smoothed value (optional).
Confirm Entry Conditions (✅)
Long Entry:
Price is above both MAs
Trend alignment & optional filters pass ✅
Short Entry:
Price is below both MAs and below the lower Bollinger Band
RSI is sufficiently oversold
Trend-blocker & ATR filter pass ✅
Position Sizing & Risk (💰)
Each trade uses 100 % of account equity by default.
One pyramid addition allowed, so you can scale in if the move continues.
Commission and slippage assumptions built in for realistic backtests.
Stops & Exits (🛑)
Long Stop-Loss: e.g. 3 % below entry.
Long Auto-Exit: If price falls back under the 500-period MA.
Short Stop-Loss: e.g. 3 % above entry.
Short Take-Profit: e.g. 4 % below entry.
🎨 Why It’s Powerful & Customizable
Modular Filters: Turn on/off RSI, ADX, ATR filters to suit different market regimes.
Adjustable Thresholds: Fine-tune stop-loss %, take-profit %, RSI lengths, MA gaps and more.
Multi-Timeframe Potential: Although coded for 3 h BTC, you can adapt it to stocks, forex or other cryptos—just recalibrate!
Backtest Fine-Tuned: Default settings were optimized via backtesting on historical BTC data—but they’re not guarantees of future performance.
⚠️ Warning & Disclaimer
This strategy is for educational purposes only and designed for a toy fund. Crypto markets are highly volatile—you can lose 100 % of your capital. It is not a predictive “holy grail” but a rules-based framework using past data. The parameters have been fine-tuned on historical data and are not valid for future trades without fresh calibration. Always practice with paper-trading first, use proper risk management, and do your own research before risking real money. 🚨🔒
Good luck exploring and experimenting! 🚀📊

MFI + RSI + EMA Dynamic SignalsThe MFI + RSI + EMA Dynamic Signals is a designed to combine with widened criteria to capture more trading opportunities, it balances momentum, trend, and flexibility, making it suitable for trading on timeframes like 15-minute to 4-hour charts.
How It Works
The indicator uses three technical components with relaxed criteria to produce signals:
Money Flow Index (MFI) for Momentum Extremes:
The MFI, calculated over a 14-period length, measures buying and selling pressure using price and volume. A buy signal can trigger when MFI crosses above the oversold level (default: 30, widened from 20), indicating potential buying pressure, while a sell signal can occur when MFI crosses below the overbought level (default: 70, widened from 80), suggesting selling pressure.
Relative Strength Index (RSI) for Momentum Confirmation:
The RSI, calculated over a 14-period length, confirms momentum strength. Bullish momentum is confirmed when RSI is above a buy threshold (default: 45, relaxed from 50), and bearish momentum when below a sell threshold (default: 55, relaxed from 50), allowing more signals near neutral momentum levels.
Exponential Moving Average (EMA) for Trend Sensitivity:
The indicator uses a fast EMA (default: 9 periods) and a slow EMA (default: 21 periods) to detect trend direction and crossovers. Signals can trigger when the fast EMA crosses the slow EMA, or when the fast EMA is within a proximity threshold (default: 0.5%) of the slow EMA, capturing early trend changes and increasing signal frequency.
Signal Generation
Signals are generated using the previous bar’s values to prevent repainting, with widened criteria for more frequent triggers:
Buy Signal: Either the MFI crosses above the oversold level or the fast EMA crosses above the slow EMA, and either RSI confirms bullish momentum (above 45) or the EMAs are near a crossover (within 0.5%). Displayed as a green upward triangle below the bar.
Sell Signal: Either the MFI crosses below the overbought level or the fast EMA crosses below the slow EMA, and either RSI confirms bearish momentum (below 55) or the EMAs are near a crossover (within 0.5%). Displayed as a red downward triangle above the bar.

EMA Distance Indicator [Eddie_Bitcoin]🧠 EMA Distance Indicator
This indicator is a powerful statistical tool designed to provide enhanced context and signal confirmation for traders who want to go beyond price action alone.
🔍 What It Does
It calculates and visualizes the distance (%) between two EMAs (Fast & Slow) on either the current chart symbol or a selected macro/index reference (e.g., BTC Dominance, TOTAL2, SPX). But it doesn't stop there:
Core Features:
✅ Real-time percentage distance between Fast and Slow EMAs
📈 Slope (acceleration) of the distance to capture trend momentum
🎯 Gaussian-based percentile rank of the current distance over a configurable historical sample
📊 Dynamic table display with intuitive emoji-based cues
🟢 Highlights extreme conditions (e.g., TOP 5% or LOW 5% percentile zones)
🔀 Compare both current asset and a macro/index asset side by side
💡 Display Modes:
Show only current symbol
Show only index/macro symbol
Show both with independently positioned tables
🎯 Ideal Use Case
This is not a standalone strategy, but rather a statistical enhancement module designed to pair with tools like my 👉 “AltCoin Index Correlation” indicator. It gives traders a quick-glance view of strength, divergence, and macro alignment for better timing and confidence.
Whether you’re trading altcoins, tracking dominance charts, or watching indices, this tool offers deep visual insight into EMA-based dynamics — wrapped in a clean, emoji-driven UI.
🛠 Created with ❤️ by @Eddie_Bitcoin
🚀 ### Check my profile for other juicy hints and original strategies. ### 🚀

EMA Pullback Speed Strategy 📌 **Overview**
The **EMA Pullback Speed Strategy** is a trend-following approach that combines **price momentum** and **Exponential Moving Averages (EMA)**.
It aims to identify high-probability entry points during brief pullbacks within ongoing uptrends or downtrends.
The strategy evaluates **speed of price movement**, **relative position to dynamic EMA**, and **candlestick patterns** to determine ideal timing for entries.
One of the key concepts is checking whether the price has **“not pulled back too much”**, helping focus only on situations where the trend is likely to continue.
⚠️ This strategy is designed for educational and research purposes only. It does not guarantee future profits.
🧭 **Purpose**
This strategy addresses the common issue of **"jumping in too late during trends and taking unnecessary losses."**
By waiting for a healthy pullback and confirming signs of **trend resumption**, traders can enter with greater confidence and reduce false entries.
🎯 **Strategy Objectives**
* Enter in the direction of the prevailing trend to increase win rate
* Filter out false signals using pullback depth, speed, and candlestick confirmations
* Predefine Take-Profit (TP) and Stop-Loss (SL) levels for safer, rule-based trading
✨ **Key Features**
* **Dynamic EMA**: Reacts faster when price moves quickly, slower when market is calm – adapting to current momentum
* **Pullback Filter**: Avoids trades when price pulls back too far (e.g., more than 5%), indicating a trend may be weakening
* **Speed Check**: Measures how strongly the price returns to the trend using candlestick body speed (open-to-close range in ticks)
📊 **Trading Rules**
**■ Long Entry Conditions:**
* Current price is above the dynamic EMA (indicating uptrend)
* Price has pulled back toward the EMA (a "buy the dip" situation)
* Pullback depth is within the threshold (not excessive)
* Candlesticks show consecutive bullish closes and break the previous high
* Price speed is strong (positive movement with momentum)
**■ Short Entry Conditions:**
* Current price is below the dynamic EMA (indicating downtrend)
* Price has pulled back up toward the EMA (a "sell the rally" setup)
* Pullback is within range (not too deep)
* Candlesticks show consecutive bearish closes and break the previous low
* Price speed is negative (downward momentum confirmed)
**■ Exit Conditions (TP/SL):**
* **Take-Profit (TP):** Fixed 1.5% target above/below entry price
* **Stop-Loss (SL):** Based on recent price volatility, calculated using ATR × 4
💰 **Risk Management Parameters**
* Symbol & Timeframe: BTCUSD on 1-hour chart (H1)
* Test Capital: \$3000 (simulated account)
* Commission: 0.02%
* Slippage: 2 ticks (minimal execution lag)
* Max risk per trade: 5% of account balance
* Backtest Period: Aug 30, 2023 – May 9, 2025
* Profit Factor (PF): 1.965 (Net profit ÷ Net loss, including spreads & fees)
⚙️ **Trading Parameters & Indicator Settings**
* Maximum EMA Length: 50
* Accelerator Multiplier: 3.0
* Pullback Threshold: 5.0%
* ATR Period: 14
* ATR Multiplier (SL distance): 4.0
* Fixed TP: 1.5%
* Short-term EMA: 21
* Long-term EMA: 50
* Long Speed Threshold: ≥ 1000.0 (ticks)
* Short Speed Threshold: ≤ -1000.0 (ticks)
⚠️Adjustments are based on BTCUSD.
⚠️Forex and other currency pairs require separate adjustments.
🔧 **Strategy Improvements & Uniqueness**
Unlike basic moving average crossovers or RSI triggers, this strategy emphasizes **"momentum-supported pullbacks"**.
By combining dynamic EMA, speed checks, and candlestick signals, it captures trades **as if surfing the wave of a trend.**
Its built-in filters help **avoid overextended pullbacks**, which often signal the trend is ending – making it more robust than traditional trend-following systems.
✅ **Summary**
The **EMA Pullback Speed Strategy** is easy to understand, rule-based, and highly reproducible – ideal for both beginners and intermediate traders.
Because it shows **clear visual entry/exit points** on the chart, it’s also a great tool for practicing discretionary trading decisions.
⚠️ Past performance is not a guarantee of future results.
Always respect your Stop-Loss levels and manage your position size according to your risk tolerance.
