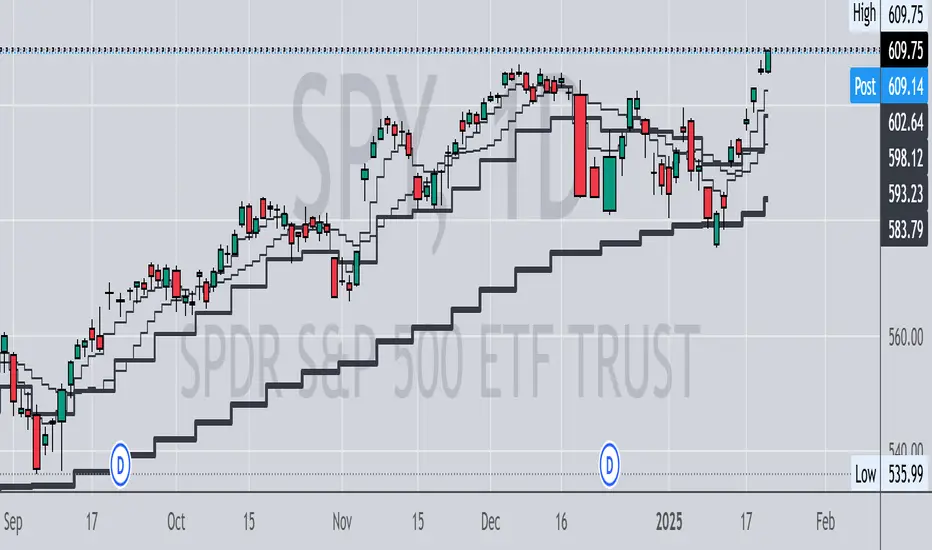
QUAD DEMAHey Folks,
Just created my first script, It's basically 4 DEMA in one indicator which helps you not to use multiple indicators.
It's more accurate than Exponential Moving Average & give signals much prior to the breakout, very helpful in short timeframes.
Tweak it according to your preference
Instructions to use
-When 55 DEMA crosses all the DEMA it's a clear signal for uptrend or downtrend which can potentially be a entry or exit points.
-Don't depend on this when all the DEMA's are entangled to each other.
-Use Stochastic RSI for better approach in entry.
-Most accurate in 1hr time frame for short term entry.
Enjoy!
Üstel Hareketli Ortalama (EMA)
EMA RibbonI added 7 EMA in a ribbon form ( basically, I took from the open script base and just combined them)
By default:
To see Short trends ( Alligator)
EMA(5)
EMA(8)
EMA(13)
To See Longer Trends
EMA(20)
EMA(50)
EMA(100)
EMA(200)
Cheers
Uptrend and Oversold Index Swing Trading System 8H--- Foreword ---
The Overbought and Oversold Index Swing Trading System or short: I11L Hypertrend primarily uses money management Strategies, EMA and SMA and my momentum Ideas for trying to produce satisfactory Alpha over a timespan of multiple years.
--- How does it Work? ---
It uses 20 different EMA's and SMA's to produce a score for each Bar.
It will credit one Point If the EMA is above the SMA.
A high score means that there is a strong Uptrend.
Spotting the strong Uptrend early is important.
The I11L Hypertrend System trys to spot the "UPTREND" by checking for a crossover of the Score(EMA) / Score(SMA).
A low score means that there is a strong Downtrend.
Its quite common to see a reversal to the mean after a Downtrend and spotting the bottom is important.
The System trys to spot the reversal, or "OVERSOLD" state by a crossunder of the Score(EMA) / Score(SMA).
--- What can i customize? ---
-> Trading Mode: You can choose between two different trading modes, Oversold and Overbought(trend) and Random Buys to check if your systems Profitfactor is actually better then market.
-> Work with the total equity: The system uses the initial capital per default for Backtesting purposes but seeing the maximum drawdown in a compounding mode might help!
-> Use a trailing SL: A TSL trys to not lose too much if the trade goes against your TP
-> Lookbackdistance for the Score: A higher Lookbackdistance results in a more lagging indicator. You have to find the balance between the confirmation of the Signal and the frontrunning.
-> Leverage: To see how your strategie and your maximum Drawdown with the total equity mode enabled would have performed.
-> Risk Capital per Trade unleveraged: How much the underlying asset can go against your position before the TSL hits, or the SL if no TSL is set.
-> TPFactor: Your risk/reward Ratio. If you risk 3% and you set the ratio to 1.2, you will have a TP at 3 * 1.2 = 3.6%
-> Select Date: Works best in the 8H Timeframe for CFD's. Good for getting a sense of what overfitting actually means and how easy one can fool themself, find the highest Profitfactor setting in the first Sector (Start - 2012) and then see if the second Sector (2012 - Now) produces Alpha over the Random Buy mode.
--- I have some questions about the System ---
Dear reader, please ask the question in the comment Section and i will do my best to assist you.
[VDB]TrendScalp-FractalBox-3EMAThere are many indicators with William’s Fractal and Alligator. As many use EMA’s it may be useful to define a 3-EMA ribbon and combining Fractal Levels/Box (filling background between top and bottom fractals) for trend scalping. I searched for this kind of indicator in community – some show fractals, some just levels, some with alligator etc. but couldn't find the one needed. Hence thought of this indicator which may be of interest to other users too.
Key Points:
EMA ribbon is created using 3 EMA’s 35/70/105. Users can change these as per their preference. This is used for trend identification – 1. Bullish bias if Price > EMA1 > EMA2 > EMA3. 2. Bearish bias if Price < EMA1 < EMA2 < EMA3.
Background is marked during crossing of EMA1 and EMA2 to alert possible trend change.
5-bar fractals are used to mark the Fractal levels and background between top and bottom fractals are filled to create a Fractal Box.
Fractal levels are marked only when the fractal formation is complete. Given offset is used this is lagging.
How to Use:
Sloping EMA ribbon is used for identifying the trend.
Fractal box break-out/ break-downs are used to trigger the trade with fractal high/low for entry/SL. Waiting for price contraction towards EMA ribbon resulting in smaller boxes is key to initiate trade. Avoid bigger boxes as SL’s will be big and price may move within. To draw the vertical lines of FractalBox change fractal level0 style to step-line.
This indicator combined with the cycle high/low (overbought/oversold) indicators such as CCI/Stochastic/RSI etc. can make it a good trend scalping setup while trading in the direction of momentum in higher timeframe.
This setup could be used for any timeframes. Do your back-testing before using it in live market.
This indicator was achieved by combing some fractal ideas from “Fractal and Alligator Alerts by JustUncleL”
DISCLAIMER : This indicator has been created for educational reference only and do not constitute investment advice. This indicator should not be relied upon as a substitute for extensive independent market research before making your actual trading decisions. Market data or any other content is subject to change at any time without notice. Liability for any loss or damage, including without limitation any loss of profit, which may arise directly or indirectly from use of this indicator is accountability of user using it.
EMA Cloud Intraday Strategy********NOT TRADING ADVICE - USE AT YOUR OWN RISK - TRADING IS RISKY - DO NOT BLINDLY FOLLOW THE SIGNALS FROM THIS STRATEGY********
This strategy utilizes the 9 and 20 period exponential moving averages to create a colored cloud between similar to what is seen on the Ichimoku Cloud. The strategy closes all trades by the end of the trading day. Entry is when the price closes above a Green (9 EMA above 20 EMA) cloud or below a Red (9 EMA below 20 EMA) cloud. Exit is when price closes against the 9 EMA or at the end of the trading day. Running the strategy tester on different intraday time frames will show the best time frame for a given Symbol. For example, I have found that the best results are returned by this strategy for SPY on the 30 minute time frame.
********NOT TRADING ADVICE - USE AT YOUR OWN RISK - TRADING IS RISKY - DO NOT BLINDLY FOLLOW THE SIGNALS FROM THIS STRATEGY********
Indicator of MagoIn this indicator you will find a combination of the indicators used by Mago Gobira. Being them EMA , RSI Levels...
USFuturesInvestments Moving Averages - Exponencia and SimpleThis indicator contains the main exponential moving averages (9, 21 and 80) and the simple moving averages (200, 305 and 610), which I use in my operational.
It was developed by my friend Giovani, who is a 10 note guy!
I hope he can help you on your journey to becoming a Professional Trader.
You can modify it the way you prefer, it is very simple.
Neste indicador estão reunidas as principais médias móveis exponenciais (9, 21 e 80) e as médias móveis simples (200, 305 e 610), que uso em meu operacional.
Ele foi desenvolvido por meu amigo Giovani, que é um cara nota 10!
Espero que ele possa ajudar a você na jornada para se tornar um Trader Profissional.
Você pode modifica-la do jeito que preferir, é muito simples.
4 Moving Averages4 EMAs indicators, I use these for daily time frame. Please feel free to explore. Comments are invited.
Quad-EMAThis indicator allows you to setup four Exponential Moving Averages onto your chart and control their lengths and colors from the same indicator
EMA/Session/ATR/LotSizeSeveral indicators combined
1. 6 Exponential Moving Averages - Identifying the trend direction or using EMAs as a dynamic support/resistance.
2. Session on Chart - Highlighting session for day trading. London, New York, Tokyo, and Sydney.
3. Average True Range - display the Average True Range on recent price to calculate the volatility.
4. Lot Size Calculator - to calculate lot size based on account balance, risk per trade, atr stop-loss, and art multiplier.
5. ATRX - ATRX is an indicator that gives the value of the (close price - EMA 27)/ATR (14)
It tells how strong the trend is compared to its volatility
According to AJ. BANK FTMO Trader Thailand, if the value of ATRX is between 2X-3X or -2X-3X, you should consider trading using climax zone on timeframe H1.
If the ATRX is more than 3X or less than -3X but does not exceed 4X or -4X, you should consider trading using timeframe M15 in the climax zone.
However, if the ATRX exceeds 4X or -4X, use M5 instead.
ATK multiple EMA This indicator Have EMA 9/50/99/200 . You can edit number and I add parabolic SAR And Auto Fib Retracement. if don't want to use you can close
Ema Crosses nklassEs un simple indicador de cruces con EMAs, de 11, 22, 50 y 200 periodos.
En un intervalo de velas diarias se obtienen las mejores señales, pero funciona bien para 4h y 15min tambien, recomiendo operar con los cruces de mayor probabilidad por encima y por debajo de la ema200, por debajo solo entradas en CORTO, y por encima solo entradas en Largo, luego de una señal se puede obtener un mejor Riesgo Beneficio si se espera a un posible test del ema 50, y se entra luego de un cierre de vela por por fuera de la ema 11, dandote un buen punto para el stop loss. Recomiendo utilizarlo basandose en zonas de soporte y resistencia de marcos temporales mas altos y teniendo en cuenta posibles divergencias en RSI al igual que su posicion en el momento de entrar al mercado.
@Kunnaphatz (EMA 5/21/50/100)EMA by Kunnaphatz
เส้น EMA นี้ถูกสร้างขึ้นจาก ข้อสงสัยของผมเกี่ยวกับ EMA ของ อาจารย์โต่งเต่ง และพบว่าในหนังสือจารย์แกมีบอกเลยทำขึ้นมาซะเลย
EMA 5/21/50/100This is EMAs that setting like Mr.Tongtang
His youtube channel: Elliott Wave By โต่งเต่ง
He also wrote a book called "เล่นหุ้นอย่างไรไม่มโน"
You can buy it at: Shopee, Lazada, and Se-Ed
Perfect OrderEntry Point
How to Entry
Perfect Order Entry
SMA5,13,21 & EMA75,90,200
Please enjoy your entry
Triple EMAThis script contains triple EMAs (20, 50 and 200) you can edit them according to your preferences by going to settings and select whatever EMA you are used to.
ema gksthis strategy is very simple scripting to buy and sell based on crossover of exponential moving averages
EMA Cross Intraday 20/50/100/200/535This shows EMA cross of 50,100,200 and the epic 535 EMA mega average price line. The 535 EMA is mentioned in a dark bold colour and it's the thickest line.
MF 200 EMA PivotPointWe will be using the 200 EMA for identifying the trend of the market & possible cross overs for Swing trades. Pivot points will be really useful for defining the Supports & resistance. By combining with these two strategies we can understand the markets simple & clear. No need to fill your chart with Graphical designs.
Awen1s EMA FiboEMA based on Fibonacci sequence starting at 5 hours.
Hours: 5, 10, 15, 25, 40, 65, 105, 170, 275, 445, 720, 1165, 1885, 3050, 4935