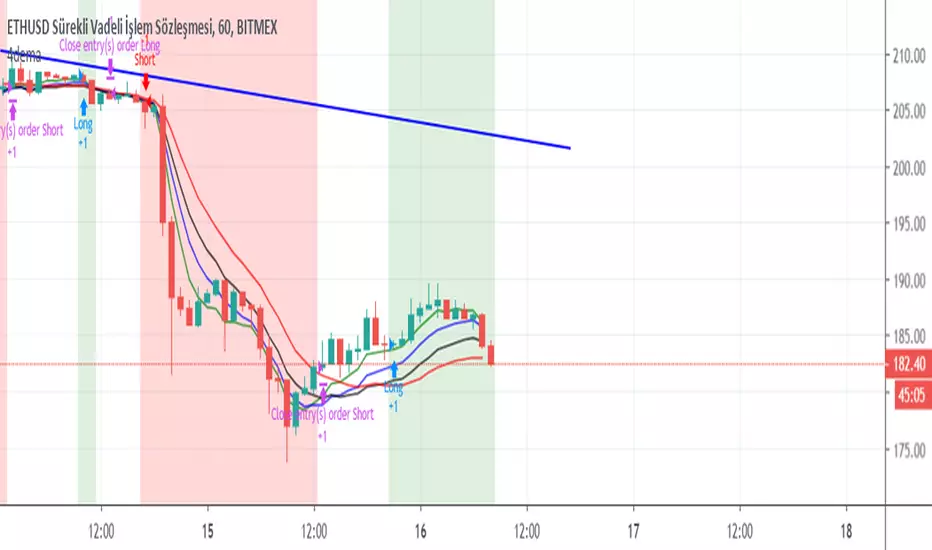
İkili Üstel Hareketli Ortalama (DEMA)
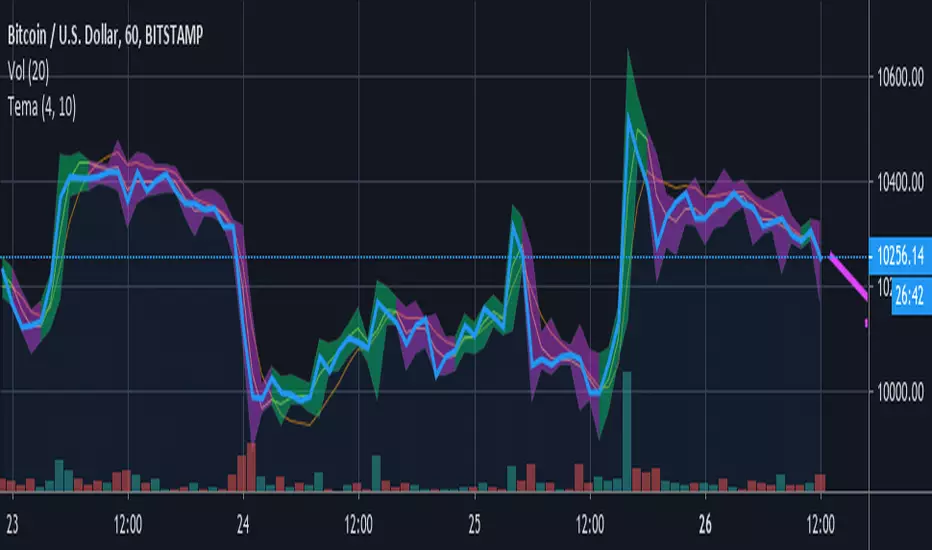
Team TemaTema highlights bars based on the triple ema ( tema ) with two different length qualifiers.
The tema is believed to react quicker to price fluctuations than the simple moving average ( sma ), the exponential moving average ( ema ), and the double ema ( dema ). The shorter length tema crossing over the longer one is believed to indicate a bullish trend ahead, highlighted in green. The shorter length crossing below the longer one may indicate a bearish trend is on the way.
Benefits.
It has been found that most traders lose money because they panic early, and don't let profits run. Tema helps me to filter out trading noise , reduce stress and stay in profitable trades longer . Highlighting the candle wicks reveals trends in highs and lows that may be difficult to see otherwise. I like being able to adjust the settings and look back to see how much noise would have been good to filter out.
Things to watch out for.
Like other moving averages, the tema is a lagging indicator , vulnerable to false signals, especially during a large move up or down . Use with other indicators that are better designed for detecting tops and bottoms. Adjust the lengths to filter out what you think may be wrong signals. The settings are subjective , and it depends on the security and the time period. Manually create a note or reminder with your favorite settings for each. You may choose how much price fluctuation to filter out by going into settings, marked with the gear icon.
Unconfirmed sentiment arrow.
Tema draws an arrow of current sentiment , based on the unconfirmed price action of the faster tema. It shows where it thinks prices are presently going, barring other factors. Its main purpose is to extend a line from the end of the tema, so it is not difficult to see. Remember, it is probably wrong until the last bar closes. And even then, buyers or sellers could come along at any moment and change the outlook.
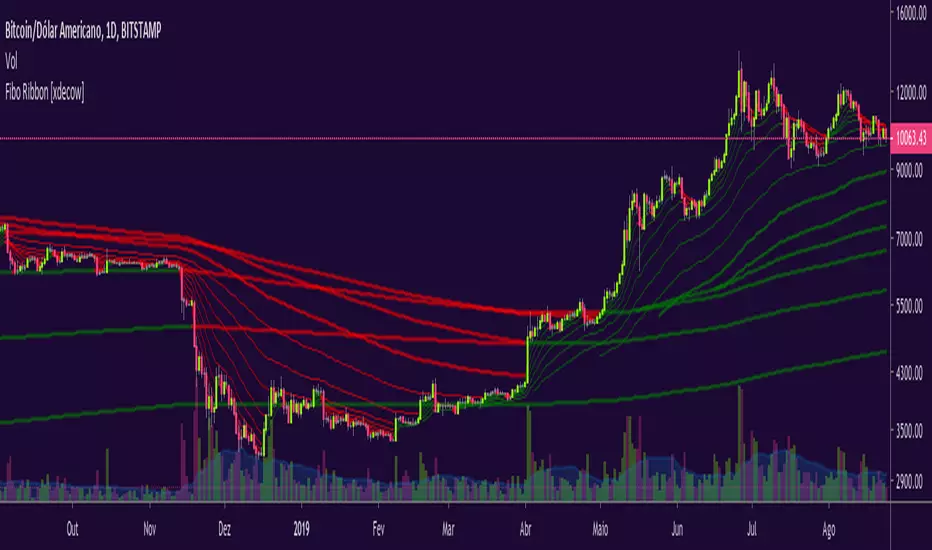
Fibo Ribbon [xdecow]Fibonacci emas sequence:
2, 3, 5, 8, 13, 21, 34, 55, 89, 144, 233, 377, 610, 987, 1597
SYT sterngththis indicator based on Support Your Trading.
candle stick, ema, sma, etc,. inclued for calculate.

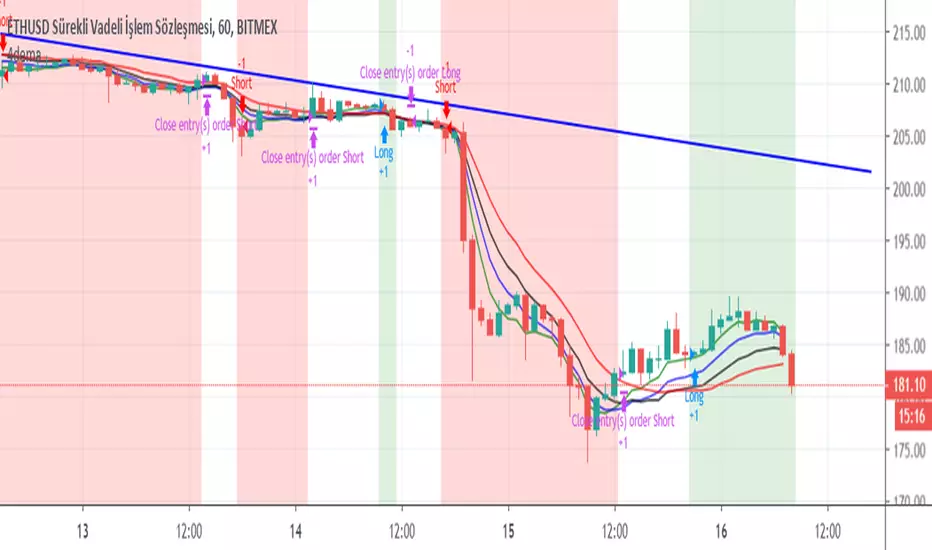
Bitguy CM_EMA Trend Bars StrategyThis Strategy based on ema trend and Trailing Stop filter
No repainting.
Can be applied to bitguy robots. You can search bitguy in chrome store to install it.
WX:kangaitianshi
QQ:55773534

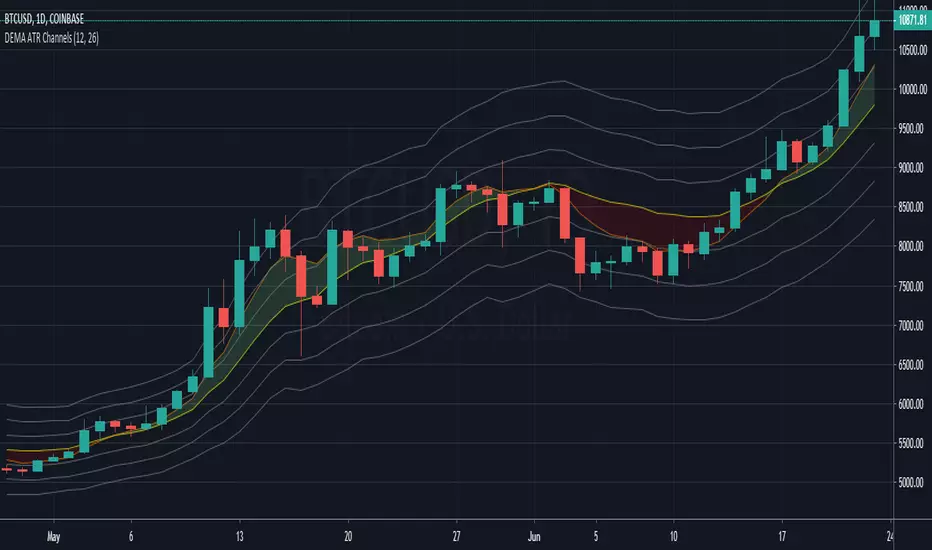
DEMA ATR Channels - New IndicatorA Double Exponential Moving Average (DEMA) with three sets of channel lines each one Average True Range (ATR) apart, above and below the DEMA.
Similar to my "ATR Channels" indicator, but using a DEMA instead of an EMA for the base. In addition, this indicator also plots a fast DEMA as well as a fill between the two. Fully customizable, you can toggle both DEMAs, the fill, and each set of ATR Channels.
ATR channel idea from Kerry Lovvorn as mentioned in Elder's "New Trading for a Living", page 93: "Kerry Lovvorn likes to plot 3 sets of lines around a moving average: at one, two, and three ATRs above and below an EMA . These can be used for setting up entry points and stops, as well as profit targets."


SlingerMust be added an Ichimoku Clound with the following entries
Conversion Line Periods __4
Base Line Periods _______ 26
Lagging Span 2 Periods___ 52
Displacement __________ 26
Turn off from chart
-Conversion Line
-Base Lina
-Lagging Span
Must add 1 EMA 25
Instructions, USE FOR BINARY AT TRENDING CHARTS
5MIN
BUY
Price must be OVER Ichimoku Clound, EMA 25 and pulled back to the GREEN lines
SELL
Price must be BELOW Ichimoku Cloud, EMA 25 and pulled back to the GREEN lines
ENTRY
As it comes back moving up or down after touching the green line(s)
I may update the script later and add all at the same so you don't have to add the EMA 25 and the Ichimiku Cloud

Double Exponential Moving Average² ProUsing this indicator allows you to use two Double Exponential Moving Average (DEMA) indicators in one indicator with variable values which can be changed in the indicator settings.
DEMA attempts to remove the inherent lag associated to Moving Averages by placing more weight on recent values.
If you would like to use this indicator drop me a line and send a request for it.

DEMA² LiteUsing this indicator allows you to use two Double Exponential Moving Average (DEMA) indicators in one indicator with fixed values.
DEMA attempts to remove the inherent lag associated to Moving Averages by placing more weight on recent values.
Hope this helps many of you to be more efficient in your chart analysis - have fun!
If you would like to be able to change these values drop me a line and send a request for the DEMA² PRO indicator.

Turtle_Trading추세 추종 거래를 위한 지표입니다.
스캘핑 또는 단타와 같은 단기 거래보다 스윙 거래에 적합합니다.
생겨나는 점들을 지지선 또는 저항선으로 생각하시면 됩니다.
빨간점은 하락추세 파란점은 상승추세를 뜻합니다.
추세를 이용하는 지표답게 횡보장에 약합니다

Turtle_Trading 추세 추종 거래를 위한 지표 입니다.
스캘핑 또는 단타와 같은 단기 거래보다 스윙 거래에 적합합니다.
생겨나는 점들을 지지선 또는 저항선으로 생각하시면 됩니다.
빨간 점은 하락추세 파란 점은 상승추세를 뜻합니다.
특별한 거래 원칙은 없어요. 자유롭게 사용하세요~
트렌드를 이용하는 지표답게 횡보장에 약합니다.

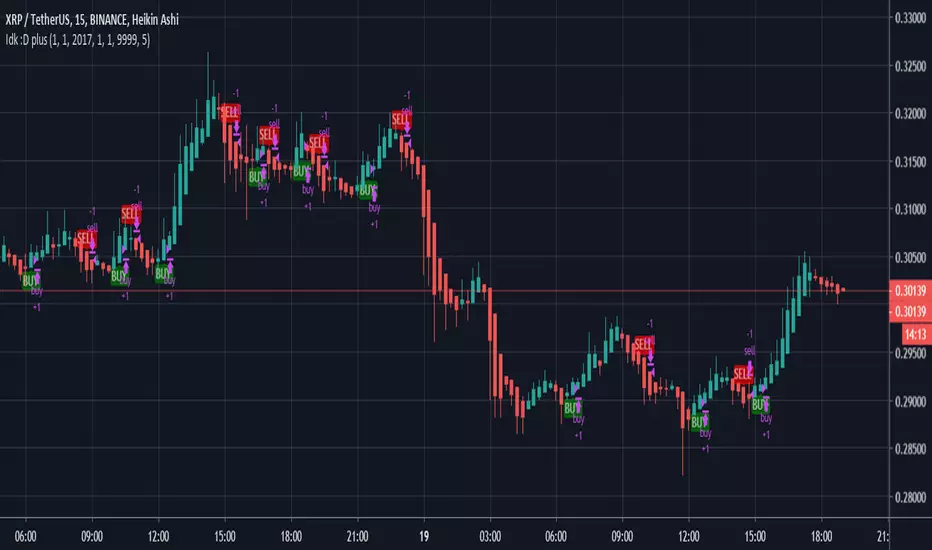
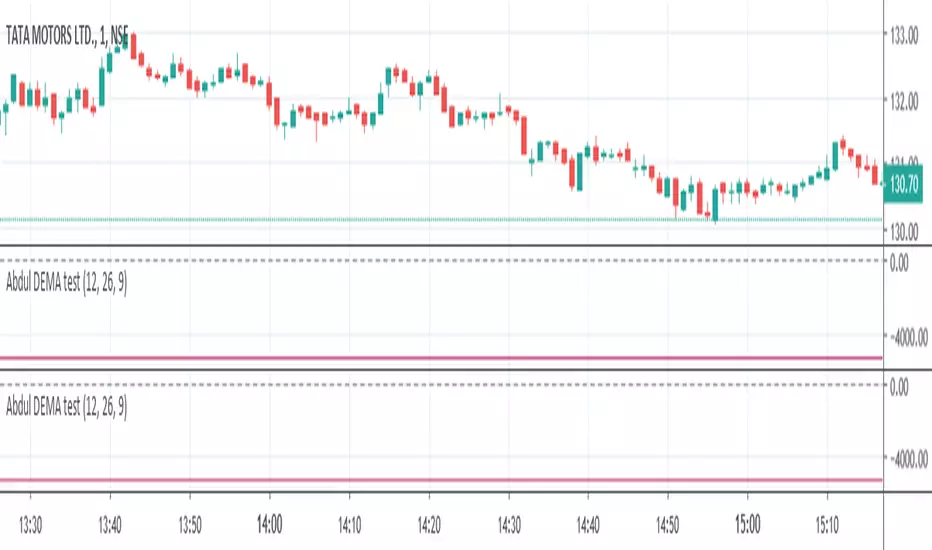
[ProfitTrailer] DEMA Spread Buy/Sell StudyProfitTrailer buy/sell study for DEMASPREAD strategy.
The script highlights the region where trailing is most likely to succeed.

[ProfitTrailer] DEMAGAIN Buy/Sell Study (standalone)ProfitTrailer buy/sell study for DEMAGAIN strategy.
The script highlights the region where trailing is most likely to succeed.

[ProfitTrailer] DEMAGAIN Buy/Sell StudyProfitTrailer buy/sell study for DEMAGAIN strategy.
The script highlights the region where trailing is most likely to succeed.

[ProfitTrailer] DEMA Cross Buy/Sell StudyProfitTrailer buy/sell study for DEMACROSS strategy.
The script highlights the region where trailing is most likely to succeed.

