OPEN-SOURCE SCRIPT
Güncellendi DEMARSI
This is little tricky indicator but you need to understand how its work in order to make it easy to understand
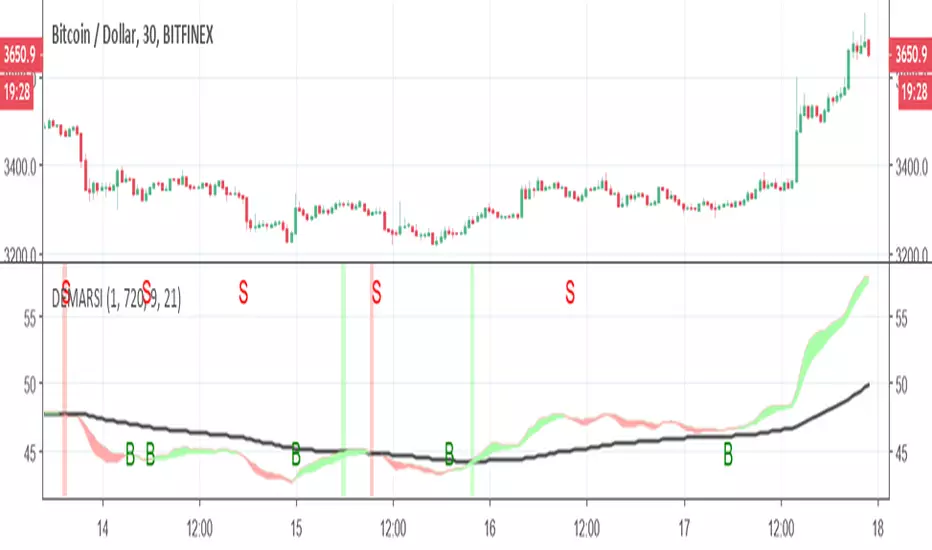
The black line is DEMA RSI hybrid which is made on the MTF length that is not repainting.
The green and red zones are also DEMA RSI that is calculated in different way (the cross between the fast and the slow moving create the color change and the signal.
you can buy or sell using the signals shown (no alerts given) but it easy to add. the since the first MTF DEMA RSI is slower the the other ones we can use it as base . so lets say you enter in green and the second DEMA is still above the black line the trend is still forward and even if you get sell signal you still can hold the coin as it expected to rise further . on the other hand once you get sell signal in red and its fall down bellow black line then it the true end of the buy period. you need to find best condition for your purpose which mean to play with setting (here I put 240 MTF over rsiDEma kegth 21) , other options can be better (did not test it).

here without the cross signals of dema rsi 2

here with MTF 120
The black line is DEMA RSI hybrid which is made on the MTF length that is not repainting.
The green and red zones are also DEMA RSI that is calculated in different way (the cross between the fast and the slow moving create the color change and the signal.
you can buy or sell using the signals shown (no alerts given) but it easy to add. the since the first MTF DEMA RSI is slower the the other ones we can use it as base . so lets say you enter in green and the second DEMA is still above the black line the trend is still forward and even if you get sell signal you still can hold the coin as it expected to rise further . on the other hand once you get sell signal in red and its fall down bellow black line then it the true end of the buy period. you need to find best condition for your purpose which mean to play with setting (here I put 240 MTF over rsiDEma kegth 21) , other options can be better (did not test it).
here without the cross signals of dema rsi 2
here with MTF 120
Sürüm Notları
so I add buy and sell alerts on the crossing, I think by increasing MTF to 720 it may work better on 30 min graph but did not tested it Sürüm Notları
I highlight the cross of the two different demarsi Açık kaynak kodlu komut dosyası
Gerçek TradingView ruhuna uygun olarak, bu komut dosyasının oluşturucusu bunu açık kaynaklı hale getirmiştir, böylece yatırımcılar betiğin işlevselliğini inceleyip doğrulayabilir. Yazara saygı! Ücretsiz olarak kullanabilirsiniz, ancak kodu yeniden yayınlamanın Site Kurallarımıza tabi olduğunu unutmayın.
Feragatname
Bilgiler ve yayınlar, TradingView tarafından sağlanan veya onaylanan finansal, yatırım, işlem veya diğer türden tavsiye veya tavsiyeler anlamına gelmez ve teşkil etmez. Kullanım Şartları'nda daha fazlasını okuyun.
Açık kaynak kodlu komut dosyası
Gerçek TradingView ruhuna uygun olarak, bu komut dosyasının oluşturucusu bunu açık kaynaklı hale getirmiştir, böylece yatırımcılar betiğin işlevselliğini inceleyip doğrulayabilir. Yazara saygı! Ücretsiz olarak kullanabilirsiniz, ancak kodu yeniden yayınlamanın Site Kurallarımıza tabi olduğunu unutmayın.
Feragatname
Bilgiler ve yayınlar, TradingView tarafından sağlanan veya onaylanan finansal, yatırım, işlem veya diğer türden tavsiye veya tavsiyeler anlamına gelmez ve teşkil etmez. Kullanım Şartları'nda daha fazlasını okuyun.