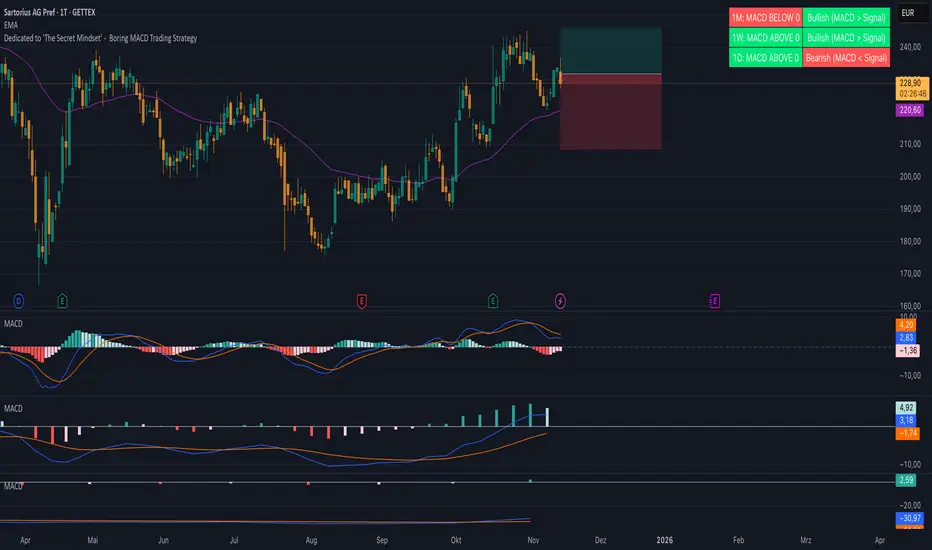
Boring MACD Trading Strategy - Dedicated to 'The Secret Mindset'This indicator displays the MACD status across three selectable timeframes, regardless of the chart timeframe you are currently viewing.
For each timeframe, it shows whether the MACD line is above or below the zero line, indicating bullish or bearish momentum.
It also shows whether the MACD line is above or below the signal line, revealing the current trend condition as bullish, bearish, or neutral.
Ortalanmış Osilatörler
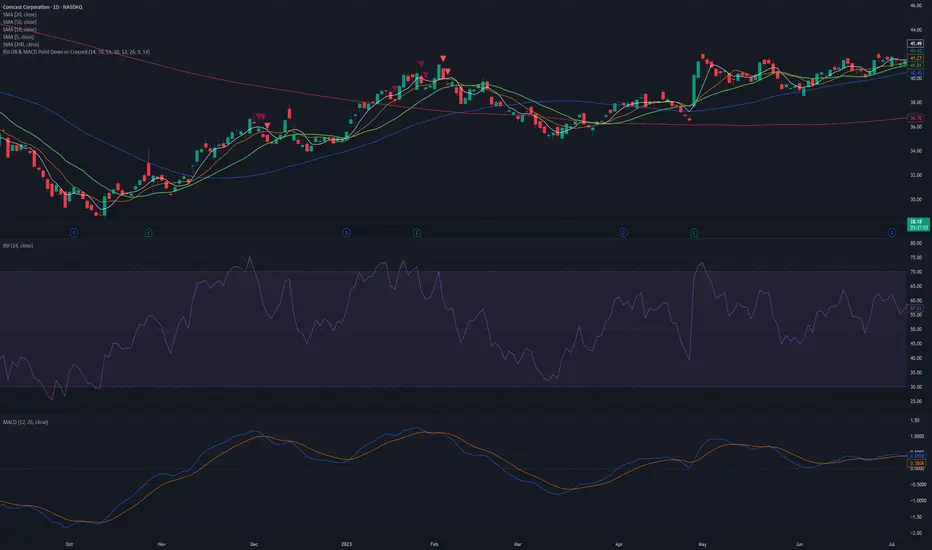
RSI OB & MACD Point Down or Crossed - PSPine script screener indicator for RSI OB and MACD point down or cross.
XAUUSD Fisher Transform Dashboard — Trend & Momentum InsightsThe script offers an educational visualization of trend and momentum on XAUUSD by combining the Fisher Transform with EMA direction. It plots momentum shifts, trend alignment, and includes a concise dashboard showing trend bias, the latest crossover event, and customizable percentage-based reference markers.
This tool is for market analysis and study purposes only and does not provide trading advice.

Adaptive Momentum Pressure (AMP)🔹 Adaptive Momentum Pressure (AMP)
A hybrid momentum oscillator that adapts to volatility and trend dynamics.
AMP measures the rate of change of price pressure and automatically adjusts its sensitivity based on market volatility.
It reacts faster in trending markets and smooths out noise during consolidation — helping traders identify genuine momentum shifts early while avoiding whipsaws.
🧠 Core Concept
AMP fuses three elements into one adaptive momentum model:
Normalized Momentum (ROC) – captures directional acceleration of price.
Adaptive Smoothing – the smoothing length dynamically contracts when volatility rises and expands when it falls.
Directional Bias – derived from the short-term EMA slope to weight momentum toward the prevailing trend.
Combined, these form a pressure value oscillating between –100 and +100, revealing when momentum expands or fades.
⚙️ How It Works
Calculates a normalized rate of change (ROC) relative to recent volatility.
Adjusts its effective length using the ATR — more volatile periods shorten the lookback for quicker reaction.
Applies a custom EMA that adapts in real time.
Modulates momentum by a normalized EMA slope (“trend bias”).
Produces a smoothed AMP line with a Signal line and crossover markers.
🔍 How to Read It
Green AMP line rising above Signal → Building bullish momentum.
Red AMP line falling below Signal → Fading or bearish momentum.
White Signal line = smoothed confirmation of trend energy.
Green dots = early bullish crossovers.
Red dots = early bearish crossovers.
Typical interpretations:
AMP crossing above 0 from below → early bullish impulse.
AMP peaking near +50–100 and curling down → potential momentum exhaustion.
Crosses below 0 with red pressure → bearish confirmation.
⚡ Advantages
✅ Adaptive across all markets and timeframes
✅ Built-in trend bias filters false signals
✅ Reacts earlier than RSI/MACD while reducing noise
✅ No manual retuning required
🧩 Suggested Use
Combine with structure or volume tools to confirm breakouts.
Works well as a momentum confirmation filter for entries/exits.
Optimal display: separate oscillator pane (not overlay).
Use it responsibly — AMP is an analytical tool, not financial advice.

True Trend OscillatorCore Concept: The Range Filter
The main purpose of this indicator is not just to show the trend, but to actively filter out "noise" or sideways (ranging) markets.
It doesn't give you a buy or sell signal simply because a fast line crosses a slow one. Instead, it tells you if the market has sufficient strength to sustain a trend. If it doesn't, it signals this by painting the line gray, suggesting it's better to stay out.
How It Works: The 3 Key Components
Your indicator works by fusing three concepts: Price Momentum, Volatility Momentum, and a Threshold Filter.
1. Price Momentum Component (RSI)
What it does: It uses a standard RSI (14-period) to measure the internal strength of the price.
How it's used:
If the RSI is high (e.g., > 50), the "Bulls" have the momentum.
If the RSI is low (e.g., < 50), the "Bears" have the momentum.
2. "Energy" Component (Stochastic ATR)
What it does: This is the most advanced part of the indicator. It doesn't measure price; it measures volatility.
How it's used:
It calculates the ATR (Average True Range) to measure volatility.
It then calculates a Stochastic of the ATR. This measures where the current volatility is relative to its recent range (highs and lows of volatility).
The result is the value k, which represents the market's "energy" or "conviction".
3. The Fusion: Creating the Bull and Bear Lines
This is where the magic happens. The indicator combines price momentum (RSI) with energy (k) using a geometric mean (math.sqrt):
bull = math.sqrt(RSI * k)
bear = math.sqrt((100 - RSI) * k)
This means a strong "Bull" line needs not only a high RSI but also high "energy" (k).
The Visual Logic: How to Read the Oscillator
You have modified the indicator to display a single line (trendStrength) whose value is the strength of the dominant trend (math.max(bull, bear)).
The color of this line is the most important signal and is based on the Threshold Filter:
🟩 Green Color (Strong Bullish Trend)
The line is painted green (lime) only if TWO conditions are met:
Bullish strength is greater than bearish strength (bull > bear).
AND the bearish strength (the weaker side) is still above the threshold (math.min(bull, bear) > threshold).
Meaning: The bulls are winning, but the bears are still putting up a fight. This is a "true trend," not just a weak, random move.
🟥 Red Color (Strong Bearish Trend)
The line is painted red only if TWO conditions are met:
Bearish strength is greater than bullish strength (bear > bull).
AND the bullish strength (the weaker side) is still above the threshold (math.min(bull, bear) > threshold).
Meaning: The bears are winning in a real, strong trend.
⬜ Gray Color (Range-Bound or "Chop" Market)
The line is painted gray if either of the two forces (bullish or bearish) drops below the threshold.
Meaning: This is the filter signal. The indicator is telling you that the market has lost its directional energy. The trend has either exhausted itself, or the market is in a sideways chop. It's a "do not trade" or "take profits" signal.
Visual Summary
Main Line (and Area Fill): Shows the strength of the dominant trend. Its color (green, red, or gray) tells you the state of that trend.
Bar Coloring: You have the option (showBarColors) to have your main price chart candles painted the same color as the oscillator, allowing you to see the trend without looking at the panel below.
Background Lines (threshold, 80, 0): These are fixed reference levels. The threshold line (green by default) is the most important, as it's the filter that decides if you are in a trend or a range.

volume cryptosmart v2Visual Components: The 3 Layers of Information
To understand the indicator, you must see it as three layers of information superimposed on a single panel.
Layer 1: The Background Color (The "Tide" or Market Regime)
The background color of the entire panel tells you the general market condition, using an ADX/DMI filter:
Green Background: ADX is above 23 (there is a trend) and DI+ is above DI-. Regime: Bullish Trend.
Red Background: ADX is above 23 (there is a trend) and DI- is above DI+. Regime: Bearish Trend.
Black Background: ADX is below 23. Regime: Range or Consolidation.
Layer 2: The Threshold Lines (The Filters)
There are two key horizontal lines that act as filters:
"Dead Zone" Line (Dotted Blue): This is your noise filter line. It is based on the ATR. Any momentum impulse that is weaker (lower) than this line is considered irrelevant noise.
"Explosion" Line (Brown): This line is based on Bollinger Bands. It measures "normal" volatility. When a histogram impulse breaks above this line, it means the acceleration is statistically large and could be a range breakout.
Layer 3: The Histogram (The "Wave" or Acceleration)
The histogram bars (trendUp and trendDown) do not measure price or volume. They measure the acceleration of momentum (specifically, the difference between today's MACD and yesterday's MACD, multiplied by sensitivity).
The Brain: The Histogram's Color Logic
This is where the true intelligence of your indicator lies. The color of each histogram bar is decided by following a series of 4 strict rules, designed to show only high-quality signals.
Rule 1: GRAY (Dead Zone)
If the impulse (trendUp or trendDown) is weaker than the "Dead Zone" line...
Then it is painted GRAY.
Meaning: The momentum is too weak to be considered. It is noise.
Rule 2: GREEN / RED (Trend Impulse)
If the impulse exceeds the Dead Zone (Gray)...
AND the panel background is Green (bullish trend) or Red (bearish trend)...
Then the histogram is painted GREEN (for trendUp) or RED (for trendDown).
Meaning: It is a valid momentum impulse that is in favor of the main trend. These are trend continuation signals.
Rule 3: BLUE (Range Breakout)
If the impulse exceeds the Dead Zone (Gray)...
AND the panel background is Black (range-bound market)...
BUT the impulse is so strong that it breaks above the "Explosion Line" (Brown)...
Then the histogram is painted BLUE.
Meaning: This is a range breakout signal. The price is exploding from a consolidation.
Rule 4: WHITE ("Chop" or Noise)
If the impulse exceeds the Dead Zone (Gray)...
BUT it does not meet the requirements of Rule 2 (no trend) or Rule 3 (not a breakout)...
Then it is painted WHITE.
Meaning: It is a momentum impulse without a clear trend and without the strength of a breakout. It is usually "noise" or market chop and should be ignored.
The Final Confirmation: The Volume Filter
In addition to the 4 rules above, you have added a final layer of conviction:
If a signal is Green, Red, or Blue (Rules 2 or 3) and occurs with high volume (volume > 20-period MA)...
...it is painted with an intense and transparent color (High Conviction).
If it occurs with low volume...
...it is painted with a light and opaque color (Low Conviction).
How to Use: Signal Summary
Background Color Histogram Color Shade Meaning
Green Green Intense (High Vol) Strong Buy Signal (Bullish impulse with trend and volume)
Red Red Intense (High Vol) Strong Sell Signal (Bearish impulse with trend and volume)
Black Blue Intense (High Vol) Breakout Signal (The range is breaking with force)
Any White or Gray - Ignore. Noise, chop, or "dead zone".
Green/Red Green/Red Light (Low Vol) Trend signal, but with low conviction. Proceed with caution.

RSI Regime: Continuation vs Reversal Indicator Description: RSI Regime (Continuation vs. Reversal)
This indicator uses the standard Relative Strength Index (RSI) to analyze market momentum and categorize it into three "regimes." Its primary goal is to help you determine if an overbought (OB) or oversold (OS) signal is likely to be a continuation of the current trend or a reversal point.
It also identifies "Fast Trend Starts," which are exceptionally fast and powerful moves from one extreme to the other.
Core Features & How to Read It
1. The Three RSI Regimes (Background Color) The script calculates a moving average (SMA) of the RSI to determine the dominant medium-term momentum. This is shown as the background color:
Bull Regime (Green Background): The RSI's average is high (e.g., above 55). The market is in a clear uptrend.
Bear Regime (Red Background): The RSI's average is low (e.g., below 45). The market is in a clear downtrend.
Range Regime (Orange Background): The RSI's average is in the middle. The market is consolidating or undecided.
2. Overbought (OB) & Oversold (OS) Signals
When the RSI line crosses into the overbought (e.g., >70) or oversold (e.g., <30) zones, the indicator generates one of two types of signals:
A) Continuation Signals (Small Triangles: ►)
These signals suggest an OB/OS reading is just a "pause" and the main trend will likely continue.
Orange ► (at the top): Appears when RSI becomes overbought while the market is already in a Bull Regime. This suggests the uptrend is strong, and this OB signal may not lead to a big drop.
Teal ► (at the bottom): Appears when RSI becomes oversold while the market is already in a Bear Regime. This suggests the downtrend is strong, and this OS signal may not lead to a big bounce.
(Note: An optional Price EMA filter can be enabled to make these signals more strict.)
B) Reversal Signals (Small Labels: "OS→>50" / "OB→<50")
These labels appear after an OB/OS signal to confirm that a reversal has actually occurred.
"OS→>50 Reversal" (Aqua Label): Appears if the RSI becomes oversold and then recovers back above the 50 midline within a set number of bars. This confirms the oversold dip was a reversal point.
"OB→<50 Reversal" (Orange Label): Appears if the RSI becomes overbought and then falls back below the 50 midline within a set number of bars. This confirms the overbought peak was a reversal point.
3. "Fast Trend Starts" (Large Labels)
This is a unique feature that identifies the fastest percentile of market moves. It measures how many bars it takes for the RSI to go from one extreme to the other and flags when a move is in the top 5% (default) of all historical moves.
"Long Pullbacks (Fast OS→BullRange)" (Large Green Label): This powerful signal appears when the RSI moves from oversold (<30) all the way up to the bull range (>60) exceptionally fast. It identifies a very strong, fast, and decisive bounce that could signal the start of a new uptrend.
"Short Pumps (Fast OB→BearRange)" (Large Red Label): This appears when the RSI moves from overbought (>70) all the way down to the bear range (<40) exceptionally fast. It identifies a very sharp, fast rejection or "pump-and-dump" that could signal the start of a new downtrend.
Key User Inputs
RSI Length (14): The lookback period for the main RSI calculation.
OB (70) / OS (30): The standard overbought and oversold levels.
Bull/Bear Range Threshold (60/40): These are the levels used to confirm the "Fast Trend Starts." They are separate from the OB/OS levels.
RSI Regime SMA Length (21): The lookback period for the moving average that determines the background regime.
Use Price EMA filter (true): If checked, the small "Continuation" triangles will only appear if the price is also above (for bulls) or below (for bears) its own 50-period EMA.
Fastest X% duration (5.0): This sets the percentile for the "Fast Trend Start" labels. 5.0 means it only flags moves that are in the fastest 5% of all recorded moves.

Liquidity Absorption OscillatorDescription:
The Liquidity Absorption Oscillator (LAO) is a sophisticated momentum indicator that measures how efficiently price moves relative to trading range while confirming momentum with volume-based liquidity flows. By combining price efficiency analysis with volume velocity, the LAO provides earlier and more reliable signals than traditional price-only oscillators, helping traders identify high-probability trend initiations and reversals.
🔍 Core Technology & Innovation:
Tri-Component Signal Processing:
Price Efficiency Ratio (PER): Measures how "cleanly" price moves by comparing net displacement to total trading range over the lookback period. High PER indicates trending markets with directional conviction.
Volume Velocity Ratio (VVR): Combines price momentum with volume confirmation, normalized by ATR to ensure consistent behavior across different instruments and volatility regimes.
Adaptive Smoothing: Dynamically adjusts responsiveness based on market conditions - becoming more stable during noisy periods and more responsive in clean trends.
Multi-Layer Signal Detection:
Confirmed Crossovers: Traditional zero-line crosses filtered by efficiency thresholds
Early Momentum Signals: Detects momentum shifts BEFORE zero-line crosses for optimal entry timing
Smart Divergence Detection: Identifies hidden bullish/bearish divergences with built-in quality filters
🎯 Trading Signals & Interpretation:
🟢 BULLISH SIGNALS:
Strong Buy: LAO crosses above zero line with medium/high efficiency (PER)
Early Buy: Momentum accelerates while LAO is still negative (anticipates reversal)
Divergence Buy: Price makes lower low while LAO forms higher low
🔴 BEARISH SIGNALS:
Strong Sell: LAO crosses below zero line with medium/high efficiency
Early Sell: Momentum decelerates while LAO is still positive (anticipates top)
Divergence Sell: Price makes higher high while LAO forms lower high
⚪ SIGNAL QUALITY FILTERING:
Automatic signal suppression during low-efficiency (choppy) market conditions
Configurable PER threshold ensures only high-quality signals are considered
📊 Visual Features:
Clean Oscillator Display: Smooth line plot with gradient fills above/below zero line
Multiple Coloring Options: Choose between no coloring, trend-based, or slope-based bar coloring
Professional Styling: Inspired by institutional-grade indicator design with subtle visual cues
Non-Repainting Logic: All signals confirmed on bar close for reliable backtesting
⚙️ Input Parameters:
Core Settings:
Lookback Period: Base period for efficiency and velocity calculations (default: 24)
Base Smooth Period: Starting point for adaptive smoothing (default: 8)
Min Efficiency for Signals: PER threshold for signal validation (default: 35)
Divergence Lookback: Bars to search for divergence patterns (default: 5)
UI Options:
Bar Coloring: Choose visual style (None, Trend, Slope)
🔔 Alert Conditions:
Buy/Sell Signal: Traditional zero-line crosses with quality filtering
Early Buy/Early Sell: Momentum-based signals before traditional crosses
All alerts use confirmed, non-repainting logic

Multi-MA OscillatorDescription:
The Multi-MA Oscillator is a highly versatile momentum tool that transforms any moving average into a normalized, mean-reverting oscillator. By converting MA values into statistical z-scores, it provides a standardized view of momentum across different timeframes and market conditions. With support for 7 distinct MA types and extensive customization options, it adapts to any trading style while offering clear visual signals for overbought/oversold conditions and potential reversals.
🔍 Core Methodology:
MA Transformation: Converts moving average values into z-scores, showing how many standard deviations the MA is from its historical mean. This normalization allows for consistent interpretation regardless of the underlying MA type or price level.
Multi-Algorithm Support: Choose from 7 MA types - EMA, SMA, KAMA, HMA, DEMA, ALMA, and WMA - each offering unique characteristics for different market environments.
Advanced Algorithm Settings: Fine-tune specialized MAs with dedicated parameters for KAMA (fast/smoothing) and ALMA (offset/sigma).
🎯 Signal Generation & Features:
Standardized Levels: The oscillator operates around a zero line with clear reference levels at ±2, ±3, and ±4 standard deviations.
Reversal Detection: Plots distinctive circle markers (⚬) when momentum peaks at extreme levels, signalling potential trend exhaustion.
Bullish Reversal: Appears in oversold territory (-3 or below) when momentum begins recovering.
Bearish Reversal: Appears in overbought territory (+3 or above) when momentum starts declining.
Dynamic Bar Colouring: Five different colouring modes to match your analysis style:
Trend: Colors bars by momentum direction (Cyan/Bullish vs Purple/Bearish)
Extremities: Highlights only extreme moves beyond ±2 standard deviations
Reversions: Colors bars specifically during reversal signals
Slope: Colors based on momentum acceleration/deceleration
None: No bar colouring
⚙️ Input Parameters:
MA Settings: Select MA type, source, length, and algorithm-specific parameters
Oscillator Settings: Adjust normalization length and reversion threshold sensitivity
Whether you're a day trader needing responsive signals or a swing trader looking for reliable momentum shifts, the Multi-MA Oscillator provides the flexibility and clarity to enhance your technical analysis workflow.

Alpha-Weighted RSIDescription:
The Alpha-Weighted RSI is a next-generation momentum oscillator that redefines the classic RSI by incorporating the mathematical principles of Lévy Flight. This advanced adaptation applies non-linear weighting to price changes, making the indicator more sensitive to significant market moves and less reactive to minor noise. It is designed for traders seeking a clearer, more powerful view of momentum and potential reversal zones.
🔍 Key Features & Innovations:
Lévy Flight Alpha Weighting: At the core of this indicator is the Alpha parameter (1.0-2.0), which controls the sensitivity to price changes.
Lower Alpha (e.g., 1.2): Makes the indicator highly responsive to recent price movements, ideal for capturing early trend shifts.
Higher Alpha (e.g., 1.8): Creates a smoother, more conservative output that filters out noise, focusing on stronger momentum.
Customizable Smoothing: The raw Lévy-RSI is smoothed by a user-selectable moving average (8 MA types supported: SMA, EMA, SMMA, etc.), allowing for further customization of responsiveness.
Intuitive Centered Oscillator: The RSI is centered around a zero line, providing a clean visual separation between bullish and bearish territory.
Dynamic Gradient Zones: Subtle, colour coded gradient fills in the overbought (>+25) and oversold (<-25) regions enhance visual clarity without cluttering the chart.
Modern Histogram Display: Momentum is plotted as a sleek histogram that changes color between bright cyan (bullish) and magenta (bearish) based on its position relative to the zero line.
🎯 How to Use & Interpret:
Zero-Line Crossovers: The most basic signals. A crossover above the zero line indicates building bullish momentum, while a crossover below suggests growing bearish momentum.
Overbought/Oversold Levels: Use the +25/-25 and +35/-35 levels as dynamic zones. A reading above +25 suggests strong bullish momentum (overbought), while a reading below -25 indicates strong bearish momentum (oversold).
Divergence Detection: Look for divergences between the Alpha-Weighted RSI and price action. For example, if price makes a new low but the RSI forms a higher low, it can signal a potential bullish reversal.
Alpha Tuning: Adjust the Alpha parameter to match market volatility. In choppy markets, increase alpha to reduce noise. In trending markets, decrease alpha to become more responsive.
⚙️ Input Parameters:
RSI Settings: Standard RSI inputs for Length and Calculation Source.
Lévy Flight Settings: The crucial Alpha factor for response control.
MA Settings: MA Type and MA Length for smoothing the final output.
By applying Lévy Flight dynamics, this indicator offers a nuanced perspective on momentum, helping you stay ahead of the curve. Feedback is always welcome!

Adaptive EMA CrossoverIndicator Name: Adaptive EMA Crossover
Description:
The Adaptive EMA Crossover is a sleek, visual tool designed to help traders identify trend direction and potential entry/exit points with clarity. By employing two Exponential Moving Averages (EMAs) with dynamic coloring, it cuts through the noise of the chart, allowing you to focus on high-probability signals.
🔍 Key Features:
Dual EMA System: Utilizes a fast and a slow EMA to gauge market momentum. The default settings are 12 (fast) and 21 (slow) periods, which can be fully customized.
Adaptive Visuals: Both EMAs change color simultaneously to reflect the dominant trend.
🟢 Bright Turquoise: Indicates an Uptrend (Fast EMA >= Slow EMA).
🔴 Bright Pink: Indicates a Downtrend (Fast EMA < Slow EMA).
Clear Crossover Signals: Prominent dots directly on the chart mark the exact moment a crossover occurs.
Turquoise Dot: A Bullish Crossover signal (Fast EMA crosses above Slow EMA).
Pink Dot: A Bearish Crossover signal (Fast EMA crosses below Slow EMA).
Integrated Alerts: Never miss a trading opportunity! Built-in alert conditions notify you instantly for both bullish and bearish crossovers.
🎯 How to Use:
Trend Identification: The primary colors of the EMAs give an immediate sense of the trend. Trade in the direction of the trend for higher-probability setups.
Signal Confirmation: Use the crossover dots as potential triggers for entry or exit. A turquoise dot in a rising market can signal a buy opportunity, while a pink dot in a falling market can signal a sell or short opportunity.
Combination with Other Tools: For best results, combine this indicator with other forms of analysis like support/resistance levels or volume confirmation to filter out false signals.
⚙️ Inputs:
EMA Small: Period for the faster-moving average (default: 12).
EMA Big: Period for the slower-moving average (default: 21).
This is my first published indicator. I welcome all feedback and suggestions for improvement! Happy Trading!


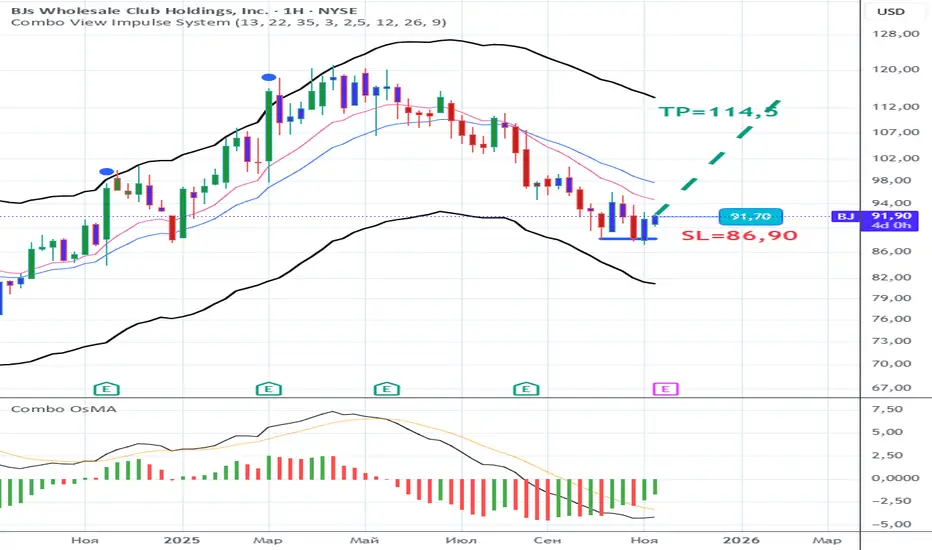
Combo OsMAMACD + OsMA Combo shows classic MACD (12,26,9) lines together with a colored OsMA histogram. Histogram bars change color based on momentum: one color for increasing bars, another for decreasing. Helps visualize trend strength and momentum shifts.
Squeeze + Short/Long (Futures) - WS🧠 Overview
The Squeeze + Short/Long (Futures) indicator combines Bollinger Bands, Keltner Channels, and momentum breakout logic to identify market compression phases (squeezes) followed by strong volatility expansion.
Ideal for crypto, futures, and FX traders who seek early breakout confirmation.
📊 Momentum Visualization
🟩 Green bars: positive momentum (bullish)
🟥 Red bars: negative momentum (bearish)
⚙️ Signals
LONG signal (green triangle) → squeeze just released + bullish momentum.
SHORT signal (red triangle) → squeeze just released + bearish momentum.
Gray background → Squeeze ON (low volatility / compression).
Includes a cooldown mechanism to prevent multiple false triggers.
💡 Trading Idea
1️⃣ Wait for a gray background (market compression).
2️⃣ When white dots and a triangle appear → volatility is expanding.
3️⃣ Trade in the direction of momentum (green for longs, red for shorts).
4️⃣ Use ATR or price structure for stops and targets.
⚙️ Recommended Settings
Market BB Len KC Len BB Mult KC Mult Momentum Len
Crypto (15m–1h) 20 20 2.0 1.5 12
Futures / FX (1h–4h) 20 20 2.0 1.5 20
🔔 Alerts
LONG Squeeze → breakout upward confirmed
SHORT Squeeze → breakout downward confirmed
Enable alerts in TradingView’s Alert Manager once added to the chart.
🧾 Credits
Created with ❤️ by WS Trading Tools
Built in Pine Script v6
Based on the classic TTM Squeeze logic with custom momentum and configurable cooldown.
© 2025 GuidoT | WS Trading Tools


Force DashboardScalping Dashboard - Complete User Guide
Overview
This scalping system consists of two complementary TradingView indicators designed for intraday trading with no overnight holds:
Force Dashboard - Single-row table showing real-time market bias and entry signals
Large Order Detection - Visual diamonds showing institutional order flow
Together, they provide a complete at-a-glance view of market conditions optimized for quick entries and exits.
Recommended Timeframes
Primary Scalping Timeframes
1-minute chart: Ultra-fast scalps (30 seconds - 3 minutes hold time)
2-minute chart: Quick scalps (2-5 minutes hold time)
5-minute chart: Standard scalps (5-15 minutes hold time)
Best Practices
Use 1-2 minute for highly liquid instruments (ES, NQ, major forex pairs)
Use 5-minute for less liquid markets or if you prefer fewer signals
Never hold past the last hour of trading to avoid overnight risk
Set hard stop times (e.g., exit all positions by 3:45 PM EST)
Dashboard Components Explained
Core Indicators (Circles ●)
MACD (5/13/5)
Green ● = Bullish momentum (MACD histogram positive)
Red ● = Bearish momentum (MACD histogram negative)
Gray ● = No clear momentum
Use: Confirms trend direction and momentum shifts
EMA (9/20/50)
Green ● = Price > EMA9 > EMA20 (uptrend)
Red ● = Price < EMA9 < EMA20 (downtrend)
Gray ● = Choppy/sideways
Use: Identifies the immediate micro-trend
Stoch (5-period Stochastic)
Green ● = Oversold (<20) - potential reversal up
Red ● = Overbought (>80) - potential reversal down
Gray ● = Neutral zone (20-80)
Use: Spots reversal opportunities at extremes
RSI (7-period)
Green ● = Oversold (<30)
Red ● = Overbought (>70)
Gray ● = Neutral
Use: Confirms overbought/oversold conditions
CVD (Cumulative Volume Delta)
Green ● = CVD above its moving average (buying pressure)
Red ● = CVD below its moving average (selling pressure)
Gray ● = Neutral
Use: Shows overall buying vs selling pressure
ΔCVD (Delta CVD - Rate of Change)
Green ● = CVD accelerating upward (buying acceleration)
Red ● = CVD accelerating downward (selling acceleration)
Gray ● = No acceleration
Use: Detects momentum shifts in order flow
Imbal (Order Flow Imbalance)
Green ● = Buy pressure >2x sell pressure
Red ● = Sell pressure >2x buy pressure
Gray ● = Balanced
Use: Identifies extreme one-sided order flow
Vol (Volume Strength)
Green ● = Volume >1.5x average (strong interest)
Red ● = Volume <0.7x average (low interest)
Gray ● = Normal volume
Yellow background = Volume surge (>2x average) - BIG MOVE ALERT
Use: Confirms conviction behind price moves
Tape (Tape Speed)
Green ● = Fast order flow (>1.3x normal)
Red ● = Slow order flow (<0.7x normal)
Gray ● = Normal speed
Yellow background = Very fast tape (>1.5x) - RAPID EXECUTION ALERT
Use: Measures urgency and speed of orders
Key Levels
Support (Supp)
Shows the nearest high-volume support level below current price
Bright Green background = Price is AT support (within 0.3%) - BOUNCE ZONE
Green background = Price above support (healthy)
Red background = Price below support (broken support, now resistance)
Resistance (Res)
Shows the nearest high-volume resistance level above current price
Bright Orange background = Price is AT resistance (within 0.3%) - REJECTION ZONE
Red background = Price below resistance (facing overhead supply)
Green background = Price above resistance (breakout)
These levels update automatically every 3 bars based on volume profile
Entry Signal Components
Score
Displays format: "6L" (6 long indicators) or "4S" (4 short indicators)
Bright Green = 6-7 indicators aligned for long
Light Green = 5 indicators aligned for long
Yellow = 4 indicators aligned (weaker setup)
Gray = No alignment
Red/Orange colors = Same scale for short setups
Score of 5+ indicates high-probability setup
SCALP (Main Entry Signal)
BRIGHT GREEN "LONG" = High-quality long scalp (Score 5+)
Green "LONG" = Decent long scalp (Score 4)
BRIGHT ORANGE "SHORT" = High-quality short scalp (Score 5+)
Red "SHORT" = Decent short scalp (Score 4)
Gray "WAIT" = No clear setup - STAY OUT
Entry Strategies
Strategy 1: High-Probability Scalps (Conservative)
When to Enter:
SCALP column shows BRIGHT GREEN "LONG" or BRIGHT ORANGE "SHORT"
Score is 5 or higher
Vol or Tape has yellow background (volume surge)
Example Long Setup:
SCALP = BRIGHT GREEN "LONG"
Score = 6L
Vol = Yellow background
Price AT Support (bright green Supp cell)
EMA, MACD, CVD, ΔCVD, Imbal all green
Entry: Enter immediately on next candle
Target: 0.5-1% move or resistance level
Stop: Below support or -0.3%
Hold Time: 2-10 minutes
Strategy 2: Momentum Scalps (Aggressive)
When to Enter:
Tape has yellow background (fast tape)
Vol has yellow background (volume surge)
ΔCVD is green (for longs) or red (for shorts)
Imbal shows strong imbalance in your direction
Score is 4+
Example Short Setup:
Tape & Vol = Yellow backgrounds
ΔCVD = Red, Imbal = Red
Price AT Resistance (bright orange)
Score = 5S
Entry: Enter immediately
Target: Quick 0.3-0.7% move
Stop: Tight -0.2%
Hold Time: 1-5 minutes
Strategy 3: Reversal Scalps (Mean Reversion)
When to Enter:
Stoch shows oversold (green) or overbought (red)
RSI confirms the extreme
Price is AT Support (for longs) or AT Resistance (for shorts)
ΔCVD and Imbal start reversing direction
Score is 4+
Example Long Setup:
Stoch = Green (oversold)
RSI = Green (oversold)
Supp = Bright green (at support)
ΔCVD turns green
Imbal turns green
Score = 4L or 5L
Entry: Wait for confirmation candle
Target: Move back to EMA9 or mid-range
Stop: Below the low
Hold Time: 3-8 minutes
Large Order Detection Usage
Diamond Signals
Green diamonds below bar = Large buy orders (institutional buying)
Red diamonds above bar = Large sell orders (institutional selling)
Size matters: Larger diamonds = larger order flow
How to Use with Dashboard
Confirmation Entries
Dashboard shows "LONG" signal
Green diamond appears
Enter immediately - institutions are buying
Divergence Alerts (CAUTION)
Dashboard shows "LONG" signal
RED diamond appears (institutions selling)
DO NOT ENTER - conflicting order flow
Cluster Patterns
Multiple green diamonds in row = Strong accumulation, stay long
Multiple red diamonds in row = Strong distribution, stay short
Alternating colors = Chop, avoid trading
Risk Management Rules
Position Sizing
Risk 0.5-1% of account per scalp
Maximum 3 concurrent positions
Reduce size after 2 consecutive losses
Stop Loss Guidelines
Tight stops: 0.2-0.3% for 1-2 min charts
Standard stops: 0.3-0.5% for 5 min charts
Always use stop loss - no exceptions
Place stops below support (longs) or above resistance (shorts)
Take Profit Targets
Target 1: 0.3-0.5% (take 50% off)
Target 2: 0.7-1% (take remaining 50%)
Move stop to breakeven after Target 1 hit
Trail stop if Score remains high
Time-Based Exits
Exit immediately if:
SCALP changes from LONG/SHORT to WAIT
Score drops below 3
Large diamond appears in opposite direction
Maximum hold time: 15 minutes (even if profitable)
Hard exit time: 30 minutes before market close
Trading Sessions
Best Times to Scalp
High-Liquidity Sessions
9:30-11:00 AM EST (Market open, highest volume)
2:00-3:30 PM EST (Afternoon session, good moves)
Avoid
11:30 AM-1:30 PM EST (Lunch, low volume)
Last 30 minutes (unpredictable, don't initiate new trades)
News releases (wait 5 minutes for volatility to settle)
Common Patterns & Setups
The Perfect Storm (Highest Probability)
Score = 6L or 7L
SCALP = BRIGHT GREEN
Vol + Tape = Yellow backgrounds
Green diamond appears
Price AT Support
Win rate: ~70-80%
The Fade Setup (Counter-Trend)
Price hits resistance (bright orange)
Stoch + RSI overbought (red)
Red diamond appears
CVD starts turning red
SCALP shows "SHORT"
Win rate: ~60-70%
The Breakout Continuation
Price breaks resistance (Res turns green)
EMA, MACD green
Vol surge (yellow)
Multiple green diamonds
SCALP = "LONG"
Win rate: ~65-75%
Warning Signs - DO NOT TRADE
Red Flags
❌ SCALP shows "WAIT"
❌ Score below 3
❌ Vol and Tape both gray (no volume)
❌ Conflicting signals (dashboard says LONG but red diamonds appearing)
❌ Alternating green/red circles (choppy market)
❌ Support and Resistance very close together (tight range)
Market Conditions to Avoid
Low volume periods
Major news releases (first 5 minutes after)
First 2 minutes after market open
Wide spreads
Consecutive losing trades (take a break after 2 losses)
Quick Reference Checklist
Before Taking ANY Trade:
☑ SCALP shows LONG or SHORT (not WAIT)
☑ Score is 4 or higher
☑ Vol or Tape shows activity
☑ No conflicting diamond signals
☑ Stop loss level identified
☑ Target profit level identified
☑ Not in restricted time periods
After Entering:
☑ Set stop loss immediately
☑ Set profit targets
☑ Watch SCALP column - exit if changes to WAIT
☑ Watch for opposite-colored diamonds
☑ Move stop to breakeven after first target
☑ Exit all by market close
Advanced Tips
Scalping Psychology
Be patient: Wait for Score 5+ setups
Be decisive: When signal appears, act immediately
Be disciplined: Follow your stop loss always
Be flexible: Exit quickly if dashboard reverses
Optimization
Backtest on your specific instrument
Adjust RSI/Stoch levels for your market
Fine-tune volume thresholds
Keep a trade journal to track which setups work best
Multi-Timeframe Confirmation
Use 5-min dashboard as "trend filter"
Take 1-min trades only in direction of 5-min SCALP signal
Increases win rate by ~10-15%
Troubleshooting
Q: Dashboard shows WAIT most of the time
Normal - scalping is about patience. Quality > Quantity
3-8 good setups per day is excellent
Q: Too many false signals
Increase minimum Score requirement to 5 or 6
Only trade with volume surge (yellow backgrounds)
Add large order detection confirmation
Q: Signals too slow
You may be on too high a timeframe
Try 1-minute chart for faster signals
Ensure real-time data feed is active
Q: Support/Resistance not updating
Normal - updates every 3 bars
If completely stuck, remove and re-add indicator
Summary
This scalping system works best when:
✅ Multiple indicators align (Score 5+)
✅ Volume and tape speed confirm the move
✅ Order flow (diamonds) confirms direction
✅ Price is at key levels (support/resistance)
✅ You manage risk strictly
✅ You exit before market close
The golden rule: When SCALP says WAIT, you WAIT. Discipline beats frequency.

Squeeze Go Momentum Pro [KingThies] █ OVERVIEW
The Squeeze Momentum Pro indicator identifies volatility compression phases and breakout opportunities by comparing Bollinger Bands to Keltner Channels. When price consolidates (squeeze), the bands contract inside the channels, signaling an imminent breakout. The momentum histogram shows directional bias, helping traders anticipate which way price will move when the squeeze releases.
This indicator displays in a separate panel below the price chart, providing clear visual signals without cluttering price action.
█ KEY FEATURES
Momentum Histogram
The histogram is the primary visual element, displaying momentum strength and direction with four distinct color states:
• Dark Green (#00C853) — Strong bullish momentum that is increasing. This signals strengthening upward pressure and potential continuation.
• Light Green (#26A69A) — Bullish momentum that is decreasing. Price remains in bullish territory but upward force is weakening.
• Dark Red (#D32F2F) — Strong bearish momentum that is increasing. This signals strengthening downward pressure and potential continuation.
• Light Red (#EF5350) — Bearish momentum that is decreasing. Price remains in bearish territory but downward force is weakening.
The color intensity provides immediate feedback on momentum strength and trend health.
Squeeze State Indicator
Colored dots on the zero line communicate the current volatility state:
• Orange Dots — Squeeze is ON. Bollinger Bands have contracted inside Keltner Channels, indicating consolidation and low volatility.
A breakout is building and traders should prepare for directional movement.
• Green Dots — Squeeze is OFF. Bollinger Bands have expanded outside Keltner Channels, indicating active momentum and higher volatility.
Price is moving with conviction in the current direction.
• Gray Dots — Neutral state. The bands are transitioning between squeeze states.
Release Triangles
Triangle shapes mark the exact bar when a squeeze releases, providing precise entry timing:
• Green Triangle Up — Bullish squeeze release. The squeeze has ended with positive momentum, suggesting a long setup opportunity.
• Red Triangle Down — Bearish squeeze release. The squeeze has ended with negative momentum, suggesting a short setup opportunity.
Information Panel
A compact dashboard in the top-right corner displays real-time trading intelligence:
• Squeeze Status — Current state: ON, OFF, or NEUTRAL with color coding
• Momentum Direction — Current bias: BULL or BEAR
• Momentum Value — Precise numerical reading of momentum strength
• Trading Signal — Actionable status: LONG SETUP, SHORT SETUP, WAIT, or MONITOR
Configurable Parameters
All calculation inputs are adjustable to match your trading style and timeframe:
• BB Length — Bollinger Bands period (default: 20)
• BB StdDev — Bollinger Bands standard deviation multiplier (default: 2.0)
• KC Length — Keltner Channels period (default: 20)
• KC ATR Multiplier — Keltner Channels range multiplier (default: 1.5)
• Momentum Length — Linear regression period for momentum calculation (default: 20)
Alert System
Four alert conditions notify you of critical trading opportunities:
• Bullish Squeeze Release — Squeeze has released with bullish momentum, indicating a potential long entry
• Bearish Squeeze Release — Squeeze has released with bearish momentum, indicating a potential short entry
• Squeeze Started — Volatility compression detected, prepare for upcoming breakout
• Squeeze Ended — Volatility expansion confirmed, breakout is active
█ TRADING METHODOLOGY
The indicator follows a clear four-step process for identifying and trading squeeze breakouts:
1 - Wait for Orange Dots . When orange dots appear on the zero line, a squeeze is building. This indicates price consolidation and declining volatility.
Do not enter trades during this phase. Instead, prepare by identifying key support and resistance levels and potential breakout directions.
2 - Watch for Release Triangle . When a triangle appears, the squeeze has released and a breakout is beginning. This is your entry signal.
The triangle color (green up or red down) combined with the histogram direction indicates the breakout direction.
3 - Confirm with Histogram Direction . Check the momentum histogram for directional confirmation:
• Green histogram + green triangle up = Go long. Bullish momentum supports upward breakout.
• Red histogram + red triangle down = Go short. Bearish momentum supports downward breakout.
4 - Monitor Momentum Intensity . Stay in the trade while histogram bars maintain their dark, intense color.
When colors lighten (dark green to light green, or dark red to light red), momentum is weakening and you should consider taking profits or tightening stops.
█ INTERPRETATION GUIDE
Squeeze Detection Logic
A squeeze occurs when Bollinger Bands contract inside Keltner Channels. This happens when:
• Standard deviation of price decreases (BB narrows)
• Price consolidates within a tight range
• Volatility compresses to unsustainable levels
The orange dots signal this condition, warning traders that explosive movement is imminent.
Squeeze Release Logic
A squeeze releases when Bollinger Bands expand outside Keltner Channels. This happens when:
• Price volatility increases sharply
• Price breaks out of consolidation
• Volume typically expands (check volume separately)
The green dots and release triangles signal this condition, indicating the direction and timing of the breakout.
Momentum Reading
The histogram uses linear regression to calculate momentum relative to the midpoint of the recent range:
• Above Zero : Price is trading above the range midpoint with bullish pressure
• Below Zero : Price is trading below the range midpoint with bearish pressure
• Increasing Bars : Momentum is strengthening in the current direction (darker color)
• Decreasing Bars : Momentum is weakening in the current direction (lighter color)
█ BEST PRACTICES
• Timeframe Selection — The indicator works on all timeframes but performs best on 15-minute to daily charts.
Lower timeframes may produce more false signals due to noise.
• Confluence Trading — Combine squeeze releases with support/resistance levels, trend lines, or other indicators for higher probability setups.
• Volume Confirmation — Check that squeeze releases occur with increasing volume. Low volume breakouts are more likely to fail.
• Multiple Timeframe Analysis — Check higher timeframes for overall trend direction. Trade squeeze releases that align with the larger trend.
• Parameter Adjustment — Increase BB and KC lengths for smoother signals on higher timeframes. Decrease for more sensitive signals on lower timeframes.
█ LIMITATIONS
• The indicator does not predict breakout direction before the squeeze releases. The momentum histogram provides bias but is not definitive until the breakout occurs.
• False breakouts can occur, particularly in choppy or low-volume market conditions. Always use proper risk management and stop losses.
• The indicator works best in trending markets. In deeply ranging markets with no clear direction, squeeze signals may be less reliable.
• Momentum calculations use linear regression which can lag during extremely fast price movements. Confirm signals with price action.
█ NOTES
This implementation uses linear regression for momentum calculation rather than simple moving averages, providing more responsive and accurate directional signals. The four-color histogram system gives traders nuanced feedback on momentum strength that binary color schemes cannot provide.
The indicator automatically adjusts to any symbol and timeframe without modification, making it suitable for stocks, forex, crypto, and futures markets.
█ CREDITS
Squeeze methodology inspired by John Carter's TTM Squeeze indicator. Momentum calculation and visual design optimized for modern trading workflows.


RSI(Min-Max)RSI (Min-Max) is an enhanced version of Welles Wilder's Relative Strength Index, designed to offer greater analytical precision and dynamic insight into the behavior of the RSI within each candlestick.In addition to displaying the traditional RSI value, this script calculates the possible extreme values — the minimum and maximum RSI — based on the low and high prices of the current candle. This allows you to estimate how the RSI would react if the price moved to the extremes of the bar, providing a predictive and refined reading of momentum.

RSI + MACD Multi-Timeframe StrategyThis strategy combines the Relative Strength Index (RSI) from the daily timeframe with the Moving Average Convergence Divergence (MACD) from the 4-hour timeframe to generate precise long entry and exit signals.
The system uses a multi-timeframe approach to align longer-term trend conditions with shorter-term momentum shifts — allowing traders to catch dips with confirmation and exit before reversals.
🧠 Strategy Logic
✅ Long Entry Condition:
- RSI on the daily (1D) timeframe is oversold (below your defined threshold)
- MACD on the 4H timeframe crosses above the signal line
→ A long trade is opened when these two align
✅ Long Exit Condition:
- RSI on the daily timeframe is overbought
- MACD on the 4H timeframe crosses below the signal line
→ The long trade is closed when these two conditions are met
💡 This strategy currently supports long entries only. Short logic can be added if needed.
📊 Indicator Components
🔹 RSI (Relative Strength Index):
- A momentum oscillator that measures the speed and magnitude of price changes.
- Helps identify overbought (potential sell) and oversold (potential buy) conditions.
- Applied on the 1D timeframe (by default) to reflect broader market trend or exhaustion levels.
🔹 MACD (Moving Average Convergence Divergence):
- A trend-following momentum indicator based on moving averages.
- The MACD Line (fast EMA - slow EMA) crossing above the Signal Line indicates bullish momentum.
- Used here on the 4-hour timeframe (by default) for shorter-term momentum confirmation.
🔹 Multi-Timeframe (MTF) Logic:
- Uses request.security() to pull higher timeframe data (1D for RSI, 4H for MACD).
- Ensures no repainting, as it only uses closed candles from the higher timeframe.
- Aligns longer-term signals with shorter-term entries, reducing false signals.
📈 Plotting Options
The script includes a plot selector input allowing you to toggle between:
- RSI Plot (with overbought/oversold lines)
- MACD Plot (MACD line and signal line)
- This helps visualize signal conditions clearly on your chart.
🛠 Customization
- RSI & MACD settings are fully configurable
- RSI and MACD timeframes can be adjusted independently
⚠️ Disclaimer
This strategy is provided for educational and informational purposes only.
It is not financial advice or a recommendation to buy or sell any asset.
Past performance does not guarantee future results. Always test strategies in a simulated environment before live use, and consult with a licensed financial advisor for investment decisions.

BVC - Momentum Dashboard ForecastBVC – Momentum Dashboard Forecast is an all-in-one indicator designed for the Casablanca Stock Exchange.
It merges trend, momentum, volatility and breakout signals to produce clear, non-repainting Buy/Sell triggers, strength scoring,
short-term forecasting and a complete visual dashboard.
Main Components
• MA20 / MA50 trend structure
• RSI(14) oversold/overbought exits
• Donchian breakouts (non-repainting using previous window)
• Optional volume confirmation
• Buy/Sell labels + strength score (0→5)
• Automatic trend-based background coloring
• Forecasting (J+1 … J+H) using linear regression + ±k·ATR
• Mini Dashboard + Forecast Table
Forecast Module
• Linear projection using slope of linreg
• ATR-based uncertainty envelope
• Projection labels (optional)
• Forecast table: Session, Projection, ATR band
Alerts
• Buy Signal
• Sell Signal
(Add alert on the indicator.)
Best Practices (BVC)
• Use daily for swing trades
• Weekly timeframe for structural trend
• Donchian 20–30 depending on volatility
• Activate volume filter for liquid stocks
• Combine with support/resistance and order book analysis

MILLION MEN - Zone Scanner ProWhat it is
MILLION MEN - Zone Scanner is a context-driven momentum tool that visualizes trend regimes (bullish / bearish) and highlights the first-touch opportunity within each regime’s reactive zones. It’s designed to help traders identify pullbacks inside an existing bias rather than chasing breakouts.
How it works
Uses a custom RSI-style momentum meter calculated from RMA of up/down moves.
When the meter > upper threshold → Green Regime.
When the meter < lower threshold → Red Regime.
Defines LONG Zone (34 – 40) and SHORT Zone (60 – 70) for mean-reversion touches.
Prints L FT or S FT on the first confirmed touch after a regime turns on.
Optional candle-color filter (green bar for LONG / red bar for SHORT).
Exit signals trigger once the meter revisits the regime boundary.
Optional Neon Glow styling improves visual clarity without clutter.
How to use
Identify regime direction (green = bullish bias, red = bearish bias).
Wait for the first touch into the relevant zone.
Confirm with higher-time-frame structure or volume context.
Manage position or exit once the meter retests its regime limit.
Use it as a context tool, not an auto-entry system.
Originality & Value
This script enforces discipline by allowing only one signal per regime, reducing over-trading and noise. The zone visualization and glow layers offer a clean, cinematic UI consistent with the MILLION MEN visual standard.
Limitations & Transparency
Works best on standard candlesticks and normal-time frames (tested on BTC, ETH, XRP, BNB, XAUUSD).
No look-ahead or future data.
Signals are bar-close confirmed (barstate.isconfirmed).
Educational tool — not financial advice.
for educational use under the MILLION MEN framework. Core logic is protected to maintain script integrity.
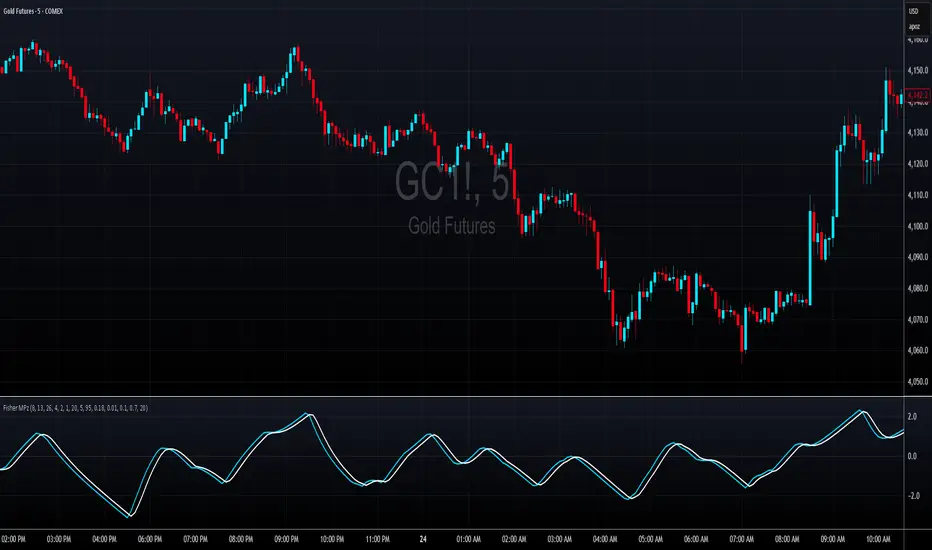
Fisher MPzFisher MPz - Multi-Period Z-Score Fisher Transform
Overview
An enhanced Fisher Transform that uses multi-period analysis and improved statistical methods to provide more reliable trading signals with the goal of fewer false positives.
Evolution Beyond Traditional Fisher Transform
While the classic Fisher Transform uses simple price normalization and basic smoothing, Fisher MPz introduces several key enhancements:
- Multi-period composite instead of single timeframe analysis
- Robust z-score normalization using median/MAD rather than mean/standard deviation
- Winsorization to handle outliers and price spikes
- Dynamic clipping that adapts to market volatility
- Kalman filtering for superior noise reduction vs. traditional EMA smoothing
These improvements result in cleaner signals, better adaptability to different market conditions, handles trending markets without over-saturation at extreme values, and reduced false signals compared to the standard Fisher Transform.
Key Features
Multi-Period Analysis
- Three Timeframe Approach: Simultaneously analyzes short (default 8), medium (default 13), and long (default 26) periods
- Weighted Composite: Combines all three periods using customizable weights for optimal signal generation
- Individual Period Display: Optional visualization of each period's Fisher Transform for deeper analysis
Advanced Statistical Methods
Robust Z-Score Calculation
- Uses median and MAD (Median Absolute Deviation) instead of mean and standard deviation
- More resistant to outliers and extreme price movements
- Provides stable normalization across varying market conditions
Winsorization
- Caps extreme price values at specified percentiles (default 5th and 95th)
- Reduces the impact of price spikes and anomalies
- Configurable lookback period for threshold calculation
Dynamic Z-Score Clipping
- Automatically adjusts clipping levels based on recent volatility
- Tighter bounds in calm markets (0.05) for precision
- Wider bounds in volatile markets (0.2) to capture significant moves
- Uses ATR-based volatility measurement
Kalman Filter Smoothing
- Optional advanced noise reduction using Kalman filtering
- Superior to traditional EMA smoothing for optimal signal extraction
- Configurable process noise (Q) and measurement noise (R) parameters
- Fallback to traditional smoothing factor available
How to Use
Basic Interpretation
- Above Zero: Bullish momentum
- Below Zero: Bearish momentum
- Extreme Values: Potential overbought/oversold conditions
- Crossovers: Entry/exit signals when composite crosses trigger line
Customizable Settings
Periods: Adjust based on your trading timeframe
- Lower values (3-10): More sensitive, suitable for scalping
- Medium values (10-20): Balanced for swing trading
- Higher values (20-50): Smoother for position trading
Weights: Customize responsiveness
- Increase short weight: More reactive to recent price changes
- Increase long weight: More stability and trend confirmation
Kalman Settings
- Lower Q (0.001-0.02): Smoother, more filtered signals
- Higher Q (0.02-0.1): More responsive to price changes
- Lower R (0.01-0.05): Trust data more, less filtering
- Higher R (0.1-1.0): More skeptical of data, more smoothing