Advanced Session Profile Predictor with SR Boxes & ORAdvanced Session Profile Predictor with Momentum Arrows
Designed for intraday traders, this indicator analyzes price action across Asia, London, and New York sessions to predict market profiles and highlight key trading opportunities. By combining session-based profiling, Opening Range (OR) visualization, and momentum signals from Traders Dynamic Index (TDI), it offers a unique tool for anticipating trends, reversals, and breakouts. Ideal for forex, indices, and crypto on 15M–1H charts.
What Makes This Indicator Unique?
Unlike typical session indicators that only mark time zones or standard TDI scripts that focus on momentum, this tool:
Predicts market profiles (e.g., "Trend Continuation," "NY Manipulation") by analyzing session ranges and directional moves, offering actionable insights into how sessions interact.
Visualizes Opening Range (OR) boxes for the first 15 minutes of each session, helping traders spot early breakout levels.
Integrates TDI with momentum to generate precise bullish/bearish arrows, filtered by session context for improved reliability.
Simplifies decision-making with dynamic profile labels showing real-time long/short conditions based on price levels.
How Does It Work?
Session Tracking:
Asia (00:00–08:00 UTC, yellow), London (08:00–16:00 UTC, red), and New York (13:00–21:00 UTC, blue) sessions are highlighted with background colors and high/low lines (crosses).
OR boxes (first 15 minutes) are drawn for each session: yellow for Asia, red for London, blue for NY.
Profile Prediction:
Compares Asia and London session ranges and directions (e.g., trending if range > 1.5x 5-period SMA).
Examples:
Trend Continuation: Asia and London trend in the same direction—long above Asia high (uptrend) or short below Asia low (downtrend).
NY Manipulation: Asia trends, London consolidates—watch for NY breakouts at London high/low.
Displays the predicted profile and entry conditions in labels (e.g., "IF price hits 1.2000 LONG").
Momentum Arrows:
Uses TDI (RSI period 21, bands 34, fast MA 2) and 12-period momentum.
Green up arrow: Fast MA > upper band (>68) and momentum rising (bullish).
Red down arrow: Fast MA < lower band (<32) and momentum falling (bearish).
Support/Resistance (SR):
Plots dynamic SR boxes based on pivot highs/lows, filtered by volume (inspired by ChartPrime’s methodology, credited below).
How to Use It
Setup: Apply to a 15M–1H chart. Adjust time zone (default: UTC) and session times if needed. Customize TDI/momentum settings for sensitivity.
Trading:
Check the top-right labels for the current profile and entry conditions (e.g., "IF price hits LONG/SHORT").
Confirm entries with green up arrows (bullish) or red down arrows (bearish).
Use OR boxes and session high/low lines to identify breakout or reversal levels.
Example: In "NY Manipulation," wait for price to hit London high (long) or low (short) during NY session, confirmed by an arrow.
Best Markets: Forex (EUR/USD), indices (SPX500), crypto (BTC/USD) with sufficient intraday volatility.
Underlying Concepts
Session Profiling: Detects trends (range > SMA * threshold) and manipulation (e.g., London breaking Asia’s high/low) to predict NY behavior.
OR Boxes: Marks the first 15 minutes’ high/low as a breakout zone (time-based, 900,000 ms).
TDI + Momentum: Combines RSI-based bands with price change (close – close ) for momentum signals.
SR Boxes: Identifies pivots over a lookback period (default 20), scaled by ATR and filtered by volume thresholds.
Credits
The SR box logic is inspired by ChartPrime’s volume-filtered support/resistance methodology, adapted with custom breakout/hold detection. Original authors are credited for their foundational work.
Chart Setup
Displays session backgrounds, OR boxes, high/low lines, TDI arrows, and profile labels. Keep other indicators off for clarity.
Ortalanmış Osilatörler

BBVOL SwiftEdgeBBVOL SwiftEdge – Precision Scalping with Volume and Trend Filtering
Optimized for scalping and short-term trading on fast-moving markets (e.g., 1-minute charts), BBVOL SwiftEdge combines Bollinger Bands, Heikin Ashi smoothing, volume momentum, and EMA trend alignment to deliver actionable buy/sell signals with visual trend cues. Ideal for forex, crypto, and stocks.
What Makes BBVOL SwiftEdge Unique?
Unlike traditional Bollinger Bands scripts that focus solely on price volatility, BBVOL SwiftEdge enhances signal precision by:
Using Heikin Ashi to filter out noise and confirm trend direction, reducing false signals in choppy markets.
Incorporating volume analysis to ensure signals align with significant buying or selling pressure (customizable thresholds).
Adding an EMA overlay to keep trades in sync with the short-term trend.
Coloring candlesticks (green for bullish, red for bearish, purple for consolidation) to visually highlight market conditions at a glance.
How Does It Work?
Buy Signal: Triggers when price crosses above the lower Bollinger Band, Heikin Ashi shows bullish momentum (close > open), buy volume exceeds your set threshold (default 30%), and price is above the EMA. A green triangle appears below the candle.
Sell Signal: Triggers when price crosses below the upper Bollinger Band, Heikin Ashi turns bearish (close < open), sell volume exceeds the threshold (default 30%), and price is below the EMA. A red triangle appears above the candle.
Trend Visualization: Candles turn green when price is significantly above the Bollinger Bands’ basis (indicating a bullish trend), red when below (bearish trend), or purple when near the basis (consolidation), based on a customizable threshold (default 10% of BB width).
Risk Management: Each signal calculates a stop-loss (10% beyond the opposite band) and take-profit (opposite band), plotted for reference.
How to Use It
Timeframe: Best on 1-minute to 5-minute charts for scalping; test higher timeframes for swing trading.
Markets: Works well in volatile markets like forex pairs (e.g., EUR/USD), crypto (e.g., BTC/USD), or liquid stocks.
Customization: Adjust Bollinger Bands length (default 10), multiplier (default 1.2), volume thresholds (default 30%), EMA length (default 3), and consolidation threshold (default 0.1%) to match your strategy.
Interpretation: Look for green/red triangles as entry signals, confirmed by candle colors. Purple candles suggest caution—wait for a breakout. Use stop-loss/take-profit levels for trade management.
Underlying Concepts
Bollinger Bands: Measures volatility and identifies overbought/oversold zones.
Heikin Ashi: Smooths price action to emphasize trend direction.
Volume Momentum: Calculates cumulative buy/sell volume percentages to confirm market strength (e.g., buyVolPercent = buyVolume / totalVolume * 100).
EMA: A fast-moving average (default length 3) ensures signals align with the immediate trend.
Chart Setup
The chart displays Bollinger Bands (orange), Heikin Ashi close (green circles), EMA (purple), and volume-scaled lines (lime/red). Signals are marked with triangles, and candle colors reflect trend state. Keep the chart clean by focusing on these outputs for clarity.

MACD Crossover Strategy MACD Crossover Strategy:
This strategy is based on the Moving Average Convergence Divergence (MACD) indicator, a popular tool used in technical analysis to identify potential trend changes and momentum in price movements. The strategy focuses on MACD crossovers within a specific "important zone" to generate trading signals.
Key Components:
1. MACD Calculation: The strategy uses customizable parameters for fast length (default 12), slow length (default 26), and signal length (default 9) to calculate the MACD line and signal line.
2. Important Zone: Defined by upper and lower thresholds (default 0.5 and -0.5), this zone helps filter out potentially less significant crossovers.
3. Entry Conditions:
- Long (Buy) Entry: When the MACD line crosses above the signal line within the important zone.
- Short (Sell) Entry: When the MACD line crosses below the signal line within the important zone.
4. Exit Conditions: The strategy closes positions on opposite crossover signals. Long positions are closed on bearish crossovers, and short positions on bullish crossovers.
5. Visualization:
- MACD line (blue) and signal line (orange) are plotted.
- The zero line, upper threshold, and lower threshold are displayed for reference.
- Buy signals are represented by green triangles at the bottom of the chart.
- Sell signals are shown as red triangles at the top of the chart.
This strategy aims to capture trend changes while filtering out potentially false signals that occur when the MACD is at extreme values. By focusing on crossovers within the important zone, the strategy attempts to identify more reliable trading opportunities.
Traders can adjust the MACD parameters and the important zone thresholds to fine-tune the strategy for different assets or timeframes. As with any trading strategy, it's crucial to thoroughly backtest and consider risk management before using it in live trading.

Uptrick: Time Based ReversionIntroduction
The Uptrick: Time Based Reversion indicator is designed to provide a comprehensive view of market momentum and potential trend shifts by combining multiple moving averages, a streak-based trend analysis system, and adaptive color visualization. It helps traders identify strong trends, spot potential reversals, and make more informed trading decisions.
Purpose
The primary goal of this indicator is to assist traders in distinguishing between sustained market movements and short-lived fluctuations. By evaluating how price behaves relative to its moving averages, and by measuring consecutive streaks above or below these averages, the indicator highlights areas where trends are likely to continue or lose momentum.
Overview
Uptrick: Time Based Reversion calculates one or more moving averages of price data and then tracks the number of consecutive bars (streaks) above or below these averages. This streak-based detection provides insight into whether a trend is gaining strength or nearing a potential reversal point. The indicator offers:
• Multiple moving average types (SMA, EMA, WMA)
• Optional second and third moving average layers for additional smoothing of first moving average
• A streak detection system to quantify trend intensity
• A dynamic color scheme that changes with streak strength
• Optional buy and sell signals for potential trade entries and exits
• A ribbon mode that applies moving averages to Open, High, Low, and Close prices for a more detailed visualization of overall trend alignment
Originality and Uniqueness
Unlike traditional moving average indicators, Uptrick: Time Based Reversion incorporates a streak measurement system to detect trend strength. This approach helps clarify whether a price movement is merely a quick fluctuation or part of a longer-lasting trend. Additionally, the optional ribbon mode extends this logic to Open, High, Low, and Close prices, creating a layered and intuitive visualization that shows complete trend alignment.
Inputs and Features
1. Enable Ribbon Mode
This input lets you activate or deactivate the ribbon display of multiple moving averages. When enabled, the script plots moving averages for the Open, High, Low, and Close prices and uses color fills to show whether these four data points are collectively above or below their respective moving averages.
2. Color Scheme Selection
Users can choose from several predefined color schemes, such as Default, Emerald, Crimson, Sapphire, Gold, Purple, Teal, Orange, Gray, Lime, or Aqua. Each scheme assigns distinct bullish, bearish and neutral colors..
3. Show Buy/Sell Signals
The indicator can display buy or sell signals based on its streak analysis logic. These signals appear as markers on the chart, indicating a “Safe Uptrend” (buy) or “Safe Downtrend” (sell).
4. Moving Average Types and Lengths
• First MA Type and Length: Choose SMA, EMA, or WMA along with a customizable period.
• Second and Third MA Types and Lengths: You can optionally stack additional moving averages for further smoothing, each with its own customizable type and period.
5. Streak Threshold Multiplier
This numeric input determines how strong a streak must be before the script considers it a “safe” trend. A higher multiplier requires a longer or more intense streak for a buy or sell signal.
6. Dynamic Transparency Calculation
The color intensity adapts to the streak’s strength. Longer streaks increase the transparency of the opposing color, making the current dominant color stand out. This feature ensures that a vigorous uptrend or downtrend is visually distinct from short-lived or weaker moves.
7. Ribbon Moving Averages
In ribbon mode, the script calculates moving averages for the Open, High, Low, and Close prices. Each of these is optionally smoothed again if the second and/or third moving average layers are active. The final result is a ribbon of moving averages that helps confirm whether the market is uniformly aligned above or below these key reference points.
Calculation Methodology
1. Initial Moving Average
The script calculates the first moving average (SMA, EMA, or WMA) of the closing price over a user-defined period.
2. Optional Secondary and Tertiary Averages
If selected, the script then applies a second and/or third smoothing step. Each of these steps can be a different type of moving average (SMA, EMA, or WMA) with its own period length.
3. Streak Detection
The indicator counts consecutive bars above or below the smoothed moving average. A running total (streakUp or streakDown) increments with every bar that remains above or below that average.
4. Reversion Intensity
The script compares the current streak value to its own average (calculated over the final chosen period). This ratio determines whether the streak is nearing a likely reversion or is strong enough to continue.
5. Color Assignment and Signals
The indicator calculates color transparency based on streak intensity. Buy and sell signals appear when the streak meets or exceeds the threshold multiplier, indicating a safe uptrend or downtrend.
Color Schemes and Visualization
This indicator offers multiple predefined color sets. Each scheme specifies a unique bullish color, bearish color and neutral color. The script automatically varies transparency to highlight strong trends and fade weaker ones, making it visually clear when a trend is intensifying or losing momentum.
Smoothing Techniques
By allowing up to three layers of moving average smoothing, the indicator accommodates different trading styles. A single layer provides faster reactions to market changes, while more layers reduce noise at the cost of slower responsiveness. Traders can choose the right balance between responsiveness and stability for their strategy, whether it is short-term scalping or long-term trend following.
Why It Combines Specific Smoothing Techniques
The Uptrick: Time Based Reversion indicator strategically combines specific smoothing techniques—SMA, EMA, and WMA—to leverage their complementary strengths. The SMA provides stable and consistent trend identification by equally weighting all data points, while the EMA emphasizes recent price movements, allowing quicker responses to market changes. WMA enhances sensitivity to recent price shifts, which helps in detecting subtle momentum changes early. By integrating these methods in layers, the indicator effectively balances responsiveness with stability, helping traders clearly identify genuine trend changes while filtering out short-term noise and false signals.
Ribbon Mode
If Open, High, Low, and Close prices remain above or below their respective moving averages consistently, the script colors the bars fully bullish or bearish. When the data points are mixed, a neutral color is applied. This mode provides a thorough perspective on whether the entire price range is aligned in one direction or showing conflicting signals.
Summary
Uptrick: Time Based Reversion combines multiple moving averages, streak detection, and dynamic color adjustments to help traders identify significant trends and potential reversal areas. Its flexibility allows it to be used either in a simpler form, with one moving average and streak analysis, or in a more advanced configuration with ribbon mode that charts multiple smoothed averages for a deeper understanding of price alignment. By adapting color intensities based on streak strength and providing optional buy/sell signals, this indicator delivers a clear and flexible tool suited to various trading strategies.
Disclaimer
This indicator is designed as an analysis aid and does not guarantee profitable trades. Past performance does not indicate future success, and market conditions can change unexpectedly. Users are advised to employ proper risk management and thoroughly evaluate trades before taking positions. Use this indicator as part of a broader strategy, not as a sole decision-making tool.

Neural Pulse System [Alpha Extract]Neural Pulse System (NPS)
The Neural Pulse System (NPS) is a custom technical indicator that analyzes price action through a probabilistic lens, offering a dynamic view of bullish and bearish tendencies.
Unlike traditional binary classification models, NPS employs Ordinary Least Squares (OLS) regression with dynamically computed coefficients to produce a smooth probability output ranging from -1 to 1.
Paired with ATR-based bands, this indicator provides an intuitive and volatility-aware approach to trend analysis.
🔶 CALCULATION
The Neural Pulse System utilizes OLS regression to compute probabilities of bullish or bearish price action while incorporating ATR-based bands for volatility context:
Dynamic Coefficients: Coefficients are recalculated in real-time and scaled up to ensure the regression adapts to evolving market conditions.
Ordinary Least Squares (OLS): Uses OLS regression instead of gradient descent for more precise and efficient coefficient estimation.
ATR Bands: Smoothed Average True Range (ATR) bands serve as dynamic boundaries, framing the regression within market volatility.
Probability Output: Instead of a binary result, the output is a continuous probability curve (-1 to 1), helping traders gauge the strength of bullish or bearish momentum.
Formula:
OLS Regression = Line of best fit minimizing squared errors
Probability Signal = Transformed regression output scaled to -1 (bearish) to 1 (bullish)
ATR Bands = Smoothed Average True Range (ATR) to frame price movements within market volatility
🔶 DETAILS
📊 Visual Features:
Probability Curve: Smooth probability signal ranging from -1 (bearish) to 1 (bullish)
ATR Bands: Price action is constrained within volatility bands, preventing extreme deviations
Color-Coded Signals:
Blue to Green: Increasing probability of bullish momentum
Orange to Red: Increasing probability of bearish momentum
Interpretation:
Bullish Bias: Probability output consistently above 0 suggests a bullish trend.
Bearish Bias: Probability output consistently below 0 indicates bearish pressure.
Reversals: Extreme values near -1 or 1, followed by a move toward 0, may signal potential trend reversals.
🔶 EXAMPLES
📌 Trend Identification: Use the probability output to gauge trend direction.
📌Example: On a 1-hour chart, NPS moves from -0.5 to 0.8 as price breaks resistance, signaling a bullish trend.
Reversal Signals: Watch for probability extremes near -1 or 1 followed by a reversal toward 0.
Example: NPS hits 0.9, price touches the upper ATR band, then both retreat—indicating a potential pullback.
📌 Example snapshots:
Volatility Context: ATR bands help assess whether price action aligns with typical market conditions.
Example: During low volatility, the probability signal hovers near 0, and ATR bands tighten, suggesting a potential breakout.
🔶 SETTINGS
Customization Options:
ATR Period – Defines lookback length for ATR calculation (shorter = more responsive, longer = smoother).
ATR Multiplier – Adjusts band width for better volatility capture.
Regression Length – Controls how many bars feed into the coefficient calculation (longer = smoother, shorter = more reactive).
Scaling Factor – Adjusts the strength of regression coefficients.
Output Smoothing – Option to apply a moving average for a cleaner probability curve

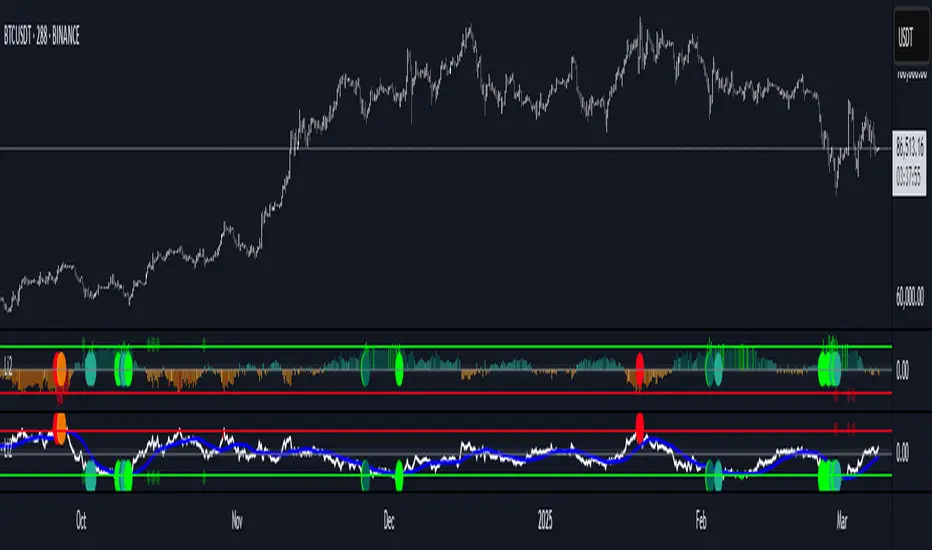
Liquidity Imbalance Index (Li2)How to Use the Liquidity Imbalance Index (Li2)
The Liquidity Imbalance Index (Li2) is designed to track market liquidity and identify significant imbalances between buyers and sellers. Here's how to effectively use this indicator in your trading:
Understanding the Main Components
1. Liquidity Delta Histogram/Line:
- Shows the difference between buy and sell liquidity
- Green bars/line: Buying pressure dominates
- Red bars/line: Selling pressure dominates
- The intensity of color shows the strength of the imbalance
2. Threshold Lines:
- Upper (green) threshold: Marks significant buy pressure
- Lower (red) threshold: Marks significant sell pressure
- Neutral zone: Area between the dotted lines where neither buyers nor sellers dominate
3. Liquidity Zones (circles shown on top/bottom):
- Green circles on upper threshold: Historical bull zones (significant buying interest)
- Red circles on lower threshold: Historical bear zones (significant selling interest)
- These zones require multiple hits, consecutive signals, and optionally volume confirmation
Trading Strategies
For Trend Trading
1. Look for when the Liquidity Delta crosses above the upper threshold for bullish signals
2. Look for when the Liquidity Delta crosses below the lower threshold for bearish signals
3. Especially powerful when crossing occurs with acceleration (darker histogram colors)
For Support and Resistance
1. Identify where the significant bull/bear zones appear (green/red circles)
2. These often align with important price levels where orders cluster
3. Use these zones as potential reversal or confirmation points
For Divergence
1. Watch for price making new highs/lows while liquidity shows the opposite
2. Divergence between price and liquidity can signal potential reversals
Volume Confirmation
1. Pay attention to volume-confirmed signals (small circles at zero line)
2. These indicate stronger conviction behind the liquidity imbalance
Optimal Settings
- For day trading or volatile markets, consider reducing lookback periods and increasing thresholds
- For swing trading, the default settings work well to capture significant zones
- In ranging markets, focus on the zones as they often mark the range boundaries
- In trending markets, follow the overall direction of the liquidity delta
Reading Acceleration Signals
The indicator shows color intensity variations to highlight acceleration in liquidity flows:
- Dark green/red: Strong acceleration (rapid shift in order flow)
- Medium green/red: Medium acceleration
- Light green/red: Weak acceleration
These acceleration signals often precede significant price movements.
CCI with Signals & Divergence [AIBitcoinTrend]👽 CCI with Signals & Divergence (AIBitcoinTrend)
The Hilbert Adaptive CCI with Signals & Divergence takes the traditional Commodity Channel Index (CCI) to the next level by dynamically adjusting its calculation period based on real-time market cycles using Hilbert Transform Cycle Detection. This makes it far superior to standard CCI, as it adapts to fast-moving trends and slow consolidations, filtering noise and improving signal accuracy.
Additionally, the indicator includes real-time divergence detection and an ATR-based trailing stop system, helping traders identify potential reversals and manage risk effectively.
👽 What Makes the Hilbert Adaptive CCI Unique?
Unlike the traditional CCI, which uses a fixed-length lookback period, this version automatically adjusts its lookback period using Hilbert Transform to detect the dominant cycle in the market.
✅ Hilbert Transform Adaptive Lookback – Dynamically detects cycle length to adjust CCI sensitivity.
✅ Real-Time Divergence Detection – Instantly identifies bullish and bearish divergences for early reversal signals.
✅ Implement Crossover/Crossunder signals tied to ATR-based trailing stops for risk management
👽 The Math Behind the Indicator
👾 Hilbert Transform Cycle Detection
The Hilbert Transform estimates the dominant market cycle length based on the frequency of price oscillations. It is computed using the in-phase and quadrature components of the price series:
tp = (high + low + close) / 3
smooth = (tp + 2 * tp + 2 * tp + tp ) / 6
detrender = smooth - smooth
quadrature = detrender - detrender
inPhase = detrender + quadrature
outPhase = quadrature - inPhase
instPeriod = 0.0
deltaPhase = math.abs(inPhase - inPhase ) + math.abs(outPhase - outPhase )
instPeriod := nz(3.25 / deltaPhase, instPeriod )
dominantCycle = int(math.min(math.max(instPeriod, cciMinPeriod), 500))
Where:
In-Phase & Out-Phase Components are derived from a detrended version of the price series.
Instantaneous Frequency measures the rate of cycle change, allowing the CCI period to adjust dynamically.
The result is bounded within a user-defined min/max range, ensuring stability.
👽 How Traders Can Use This Indicator
👾 Divergence Trading Strategy
Bullish Divergence Setup:
Price makes a lower low, while CCI forms a higher low.
Buy signal is confirmed when CCI shows upward momentum.
Bearish Divergence Setup:
Price makes a higher high, while CCI forms a lower high.
Sell signal is confirmed when CCI shows downward momentum.
👾 Trailing Stop & Signal-Based Trading
Bullish Setup:
✅ CCI crosses above -100 → Buy signal.
✅ A bullish trailing stop is placed at Low - (ATR × Multiplier).
✅ Exit if the price crosses below the stop.
Bearish Setup:
✅ CCI crosses below 100 → Sell signal.
✅ A bearish trailing stop is placed at High + (ATR × Multiplier).
✅ Exit if the price crosses above the stop.
👽 Why It’s Useful for Traders
Hilbert Adaptive Period Calculation – No more fixed-length periods; the indicator dynamically adapts to market conditions.
Real-Time Divergence Alerts – Helps traders anticipate market reversals before they occur.
ATR-Based Risk Management – Stops automatically adjust based on volatility.
Works Across Multiple Markets & Timeframes – Ideal for stocks, forex, crypto, and futures.
👽 Indicator Settings
Min & Max CCI Period – Defines the adaptive range for Hilbert-based lookback.
Smoothing Factor – Controls the degree of smoothing applied to CCI.
Enable Divergence Analysis – Toggles real-time divergence detection.
Lookback Period – Defines the number of bars for detecting pivot points.
Enable Crosses Signals – Turns on CCI crossover-based trade signals.
ATR Multiplier – Adjusts trailing stop sensitivity.
Disclaimer: This indicator is designed for educational purposes and does not constitute financial advice. Please consult a qualified financial advisor before making investment decisions.

Relative Vigor Index (RVI) with EMD [AIBitcoinTrend]👽 Adaptive Relative Vigor Index with EMD & Signals (AIBitcoinTrend)
The Adaptive Relative Vigor Index (RVI) with Empirical Mode Decomposition (EMD) is an enhanced version of the traditional RVI, designed to improve signal clarity and responsiveness to market conditions. By integrating EMD smoothing and adaptive volatility-based trailing stops.
👽 What Makes the Adaptive RVI with EMD Unique?
Unlike the standard RVI, which often lags in volatile markets, this version refines price momentum detection by applying Empirical Mode Decomposition (EMD), effectively filtering out noise. Additionally, it features ATR-based trailing stops for precise trade execution.
Key Features:
EMD-Enhanced RVI – Filters out short-term noise, improving signal accuracy.
Crossover & Crossunder Signals – Generates trade signals based on RVI trends.
ATR-Based Trailing Stop – Adjusts dynamically based on volatility for optimal risk management.
👽 The Math Behind the Indicator
👾 RVI Calculation with EMD Smoothing
The Relative Vigor Index (RVI) measures trend strength by comparing the relationship between closing and opening prices, relative to the high-low range. Traditional RVI uses fixed smoothing, whereas this version applies Empirical Mode Decomposition (EMD) to extract dominant price cycles and improve trend clarity.
How It Works:
The RVI is initially calculated using a weighted moving average (WMA) over a specified period.
EMD refines the RVI signal by removing high-frequency noise, creating a smoothed RVI component.
This results in a more stable and reliable trend indicator.
👽 How Traders Can Use This Indicator
👾 Trailing Stop & Signal-Based Trading
Bullish Setup:
✅ RVI crosses above EMD → Buy signal.
✅ A bullish trailing stop is placed at low - ATR × Multiplier.
✅ Exit if price crosses below the stop.
Bearish Setup:
✅ RVI crosses below EMD → Sell signal.
✅ A bearish trailing stop is placed at high + ATR × Multiplier.
✅ Exit if price crosses above the stop.
👾 Detecting Overbought & Oversold Areas
This indicator helps traders identify potential reversal zones by highlighting overbought and oversold conditions.
Overbought Zone: When RVI moves above 0.4, the market may be overextended, signaling a potential reversal downward.
Oversold Zone: When RVI moves below -0.4, the market may be undervalued, suggesting a possible upward reversal.
Using these levels, traders can confirm entry and exit points alongside divergence signals for higher probability trades.
👽 Why It’s Useful for Traders
EMD-Based Signal Enhancement: Filters out noise, refining momentum signals.
Adaptive ATR-Based Risk Management: Automatically adjusts stop-loss levels to market conditions.
Works Across Multiple Markets & Timeframes: Effective for stocks, forex, crypto, and futures trading.
👽 Indicator Settings
RVI Length – Defines the period for calculating the Relative Vigor Index.
EMD Period – Controls the level of EMD smoothing applied.
Final Smoothing – Adjusts the degree of additional signal filtering.
Lookback Period – Determines how many bars are used for detecting pivot points.
Enable Trailing Stop – Activates dynamic ATR-based trailing stops.
ATR Multiplier – Adjusts the stop-loss sensitivity.
Disclaimer: This indicator is designed for educational purposes and does not constitute financial advice. Please consult a qualified financial advisor before making investment decisions.

Chaikin Money Flow with EnhancementsThis enhanced version of the Chaikin Money Flow (CMF) indicator is designed to help traders better understand market sentiment by visualizing momentum shifts and trends based on volume-weighted accumulation and distribution.
CMF Calculation: The CMF line is calculated using the typical CMF formula, which compares the close price to the high/low range, weighted by volume.
Fading Color Zones: Green and red fading zones are added between the CMF line and the zero line. Green represents bullish momentum (CMF above zero), and red represents bearish momentum (CMF below zero). These zones highlight key shifts in market sentiment.
Cross Detection: The indicator detects when the CMF crosses above or below the zero line, signaling potential trend changes. The price and CMF values at the time of the cross are stored and can be used for further analysis.
Average Line: A configurable moving average of the CMF is plotted to provide a smoothed trendline, helping traders identify the overall direction of market sentiment.
This indicator is ideal for traders who want to enhance their technical analysis by incorporating volume-weighted momentum indicators and identifying trend reversals more clearly.

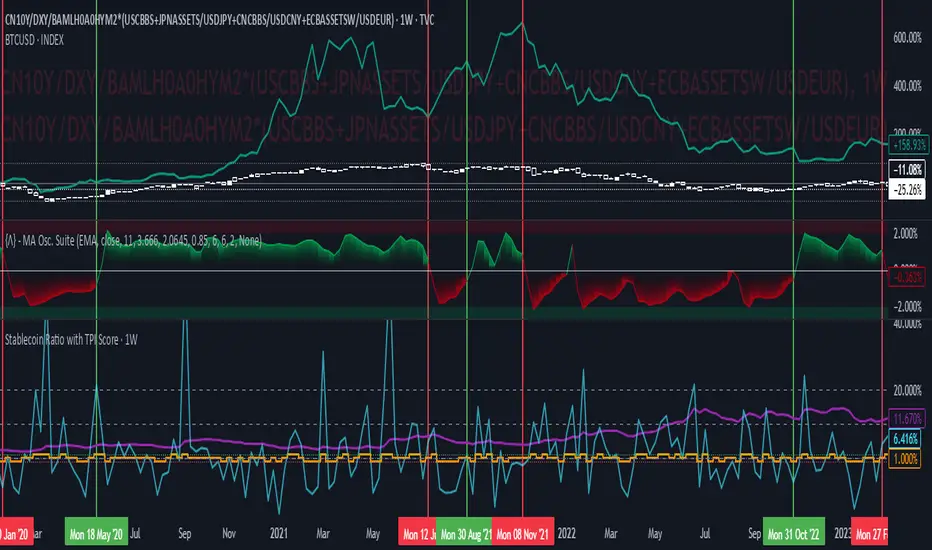
Stablecoin Ratio with TPI ScoreThe script measures the stablecoin ratio (total stablecoin market cap divided by total crypto market cap, times 100) and its weekly change. Stablecoins (e.g., USDT, USDC) are a key gateway for capital entering or exiting the crypto ecosystem.
A rising ratio suggests more capital is parked in stablecoins (potential buying power), while a falling ratio indicates capital leaving (selling or withdrawal).
In a macro analysis, this is critical—it reflects the availability of liquid funds that could fuel price movements.
In macroeconomics, liquidity is a driver of asset prices.
In crypto, stablecoins represent sidelined capital ready to deploy.
How does it work?
Stablecoin Ratio:
Formula: (total_stablecoin_mcap / total_crypto_mcap) * 100.
Example: If stablecoins = $235B and total market cap = $2.5T, ratio = 9.4%.
Plotted as a red line in the oscillator pane, showing the percentage of the market held in stablecoins.
Weekly Change:
Calculates the percentage change in the ratio from the previous week:
(current_ratio - previous_ratio) / previous_ratio * 100.
Example: Ratio goes from 9% to 10% = +11.11% change.
TPI Score Assignment:
+1 (Bullish): If the ratio increases by more than 5% week-over-week.
-1 (Bearish): If the ratio decreases by more than 5% week-over-week.
0 (Neutral): If the change is between -5% and +5%.
Plotted as orange step line bars in the oscillator pane, snapping to +1, 0, or -1.
MACD with Holt–Winters Smoothing [AIBitcoinTrend]👽 MACD with Holt–Winters Smoothing (AIBitcoinTrend)
The MACD with Holt–Winters Smoothing is an momentum indicator that enhances traditional MACD analysis by incorporating Holt–Winters exponential smoothing. This adaptation reduces lag while maintaining trend sensitivity, making it more effective for detecting trend reversals and sustained momentum shifts. Additionally, the indicator includes real-time divergence detection and an ATR-based trailing stop system, helping traders manage risk dynamically.
👽 What Makes the MACD with Holt–Winters Smoothing Unique?
Unlike the standard MACD, which relies on simple exponential moving averages, this version applies Holt–Winters smoothing to better capture trends while filtering out market noise. Combined with real-time divergence detection and a trailing stop system, this indicator allows traders to:
✅ Identify trend strength with a dynamically smoothed MACD signal.
✅ Detect bullish and bearish divergences in real time.
✅Implement Crossover/Crossunder signals tied to ATR-based trailing stops for risk management
👽 The Math Behind the Indicator
👾 Holt–Winters Smoothing for MACD
Traditional MACD calculations use exponential moving averages (EMA) to identify momentum. This indicator improves upon it by applying Holt’s linear trend equations, which enhance signal accuracy by reducing lag and smoothing out fluctuations.
Key Features:
Alpha (α) - Controls the weight of the new data in smoothing.
Beta (β) - Determines how fast the trend component adapts to new changes.
The Holt–Winters Signal Line provides a refined MACD crossover system for better trade execution.
👾 Real-Time Divergence Detection
The indicator identifies bullish and bearish divergences between MACD and price action.
Bullish Divergence: Occurs when price makes a lower low, but MACD makes a higher low – signaling potential upward momentum.
Bearish Divergence: Occurs when price makes a higher high, but MACD makes a lower high – signaling potential downward momentum.
👾 Dynamic ATR-Based Trailing Stop
The indicator includes a trailing stop system based on ATR (Average True Range). This allows traders to manage positions dynamically based on volatility.
Bullish Trailing Stop: Triggers when MACD crosses above the Holt–Winters signal, with a stop placed at low - (ATR × Multiplier).
Bearish Trailing Stop: Triggers when MACD crosses below the Holt–Winters signal, with a stop placed at high + (ATR × Multiplier).
Trailing Stop Adjustments: Expands or contracts dynamically with market conditions, reducing premature exits while securing profits.
👽 How Traders Can Use This Indicator
👾 Divergence Trading
Traders can use real-time divergence detection to anticipate trend reversals before they occur.
Bullish Divergence Setup:
Look for MACD making a higher low, while price makes a lower low.
Enter long when MACD confirms upward momentum.
Bearish Divergence Setup:
Look for MACD making a lower high, while price makes a higher high.
Enter short when MACD confirms downward momentum.
👾 Trailing Stop & Signal-Based Trading
Bullish Setup:
✅ MACD crosses above the Holt–Winters signal.
✅ A bullish trailing stop is placed using low - ATR × Multiplier.
✅ Exit if the price crosses below the stop.
Bearish Setup:
✅ MACD crosses below the Holt–Winters signal.
✅ A bearish trailing stop is placed using high + ATR × Multiplier.
✅ Exit if the price crosses above the stop.
This systematic trade management approach helps traders lock in profits while reducing drawdowns.
👽 Why It’s Useful for Traders
Lag Reduction: Holt–Winters smoothing ensures faster and more reliable trend detection.
Real-Time Divergence Alerts: Identify potential reversals before they happen.
Adaptive Risk Management: ATR-based trailing stops adjust to volatility dynamically.
Works Across Markets & Timeframes: Effective for stocks, forex, crypto, and futures trading.
👽 Indicator Settings
MACD Fast & Slow Lengths: Adjust the MACD short- and long-term EMA periods.
Holt–Winters Alpha & Beta: Fine-tune the smoothing sensitivity.
Enable Divergence Detection: Toggle real-time divergence analysis.
Lookback Period for Divergences: Configure how far back pivot points are detected.
ATR Multiplier for Trailing Stops: Adjust stop-loss sensitivity to market volatility.
Trend Filtering: Enable signal filtering based on trend direction.
Disclaimer: This indicator is designed for educational purposes and does not constitute financial advice. Please consult a qualified financial advisor before making investment decisions.

Market Participation Index [PhenLabs]📊 Market Participation Index
Version: PineScript™ v6
📌 Description
Market Participation Index is a well-evolved statistical oscillator that constantly learns to develop by adapting to changing market behavior through the intricate mathematical modeling process. MPI combines different statistical approaches and Bayes’ probability theory of analysis to provide extensive insight into market participation and building momentum. MPI combines diverse statistical thinking principles of physics and information and marries them for subtle changes to occur in markets, levels to become influential as important price targets, and pattern divergences to unveil before it is visible by analytical methods in an old-fashioned methodology.
🚀 Points of Innovation:
Automatic market condition detection system with intelligent preset selection
Multi-statistical approach combining classical and advanced metrics
Fractal-based divergence system with quality scoring
Adaptive threshold calculation using statistical properties of current market
🚨 Important🚨
The ‘Auto’ mode intelligently selects the optimal preset based on real-time market conditions, if the visualization does not appear to the best of your liking then select the option in parenthesis next to the auto mode on the label in the oscillator in the settings panel.
🔧 Core Components
Statistical Foundation: Multiple statistical measures combined with weighted approach
Market Condition Analysis: Real-time detection of market states (trending, ranging, volatile)
Change Point Detection: Bayesian analysis for finding significant market structure shifts
Divergence System: Fractal-based pattern detection with quality assessment
Adaptive Visualization: Dynamic color schemes with context-appropriate settings
🔥 Key Features
The indicator provides comprehensive market analysis through:
Multi-statistical Oscillator: Combines Z-score, MAD, and fractal dimensions
Advanced Statistical Components: Includes skewness, kurtosis, and entropy analysis
Auto-preset System: Automatically selects optimal settings for current conditions
Fractal Divergence Analysis: Detects and grades quality of divergence patterns
Adaptive Thresholds: Dynamically adjusts overbought/oversold levels
🎨 Visualization
Color-coded Oscillator: Gradient-filled oscillator line showing intensity
Divergence Markings: Clear visualization of bullish and bearish divergences
Threshold Lines: Dynamic or fixed overbought/oversold levels
Preset Information: On-chart display of current market conditions
Multiple Color Schemes: Modern, Classic, Monochrome, and Neon themes
Classic
Modern
Monochrome
Neon
📖 Usage Guidelines
The indicator offers several customization options:
Market Condition Settings:
Preset Mode: Choose between Auto-detection or specific market condition presets
Color Theme: Select visual theme matching your chart style
Divergence Labels: Choose whether or not you’d like to see the divergence
✅ Best Use Cases:
Identify potential market reversals through statistical divergences
Detect changes in market structure before price confirmation
Filter trades based on current market condition (trending vs. ranging)
Find optimal entry and exit points using adaptive thresholds
Monitor shifts in market participation and momentum
⚠️ Limitations
Requires sufficient historical data for accurate statistical analysis
Auto-detection may lag during rapid market condition changes
Advanced statistical calculations have higher computational requirements
Manual preset selection may be required in certain transitional markets
💡 What Makes This Unique
Statistical Depth: Goes beyond traditional indicators with advanced statistical measures
Adaptive Intelligence: Automatically adjusts to current market conditions
Bayesian Analysis: Identifies statistically significant change points in market structure
Multi-factor Approach: Combines multiple statistical dimensions for confirmation
Fractal Divergence System: More robust than traditional divergence detection methods
🔬 How It Works
The indicator processes market data through four main components:
Market Condition Analysis:
Evaluates trend strength, volatility, and price patterns
Automatically selects optimal preset parameters
Adapts sensitivity based on current conditions
Statistical Oscillator:
Combines multiple statistical measures with weights
Normalizes values to consistent scale
Applies adaptive smoothing
Advanced Statistical Analysis:
Calculates higher-order statistical moments
Applies information-theoretic measures
Detects distribution anomalies
Divergence Detection:
Uses fractal theory to identify pivot points
Detects and scores divergence quality
Filters signals based on current market phase
💡 Note:
The Market Participation Index performs optimally when used across multiple timeframes for confirmation. Its statistical foundation makes it particularly valuable during market transitions and periods of changing volatility, where traditional indicators often fail to provide clear signals.

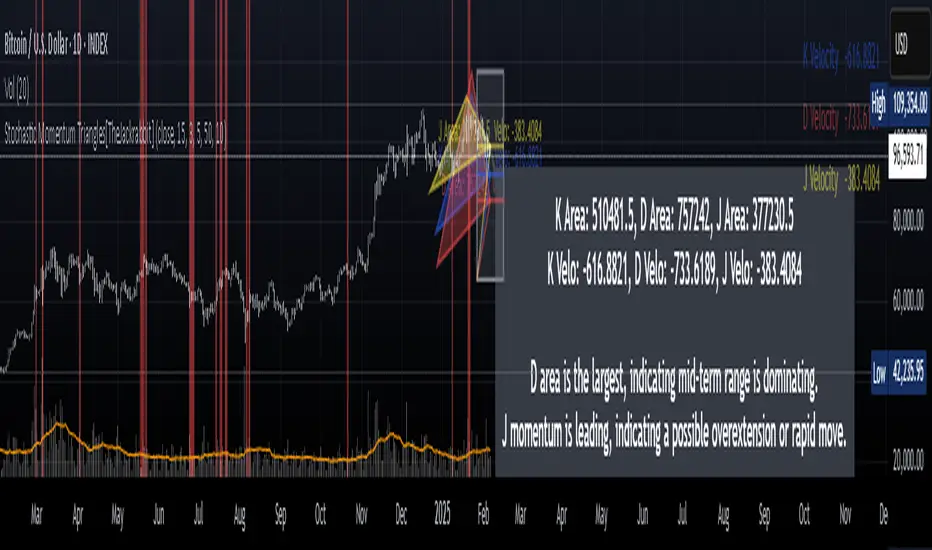
Stochastic Momentum Triangles[TheJackrabbit]This code is invite-only and in the experimental phase. Please contact the author if you are interested in testing.
**Stochastic Momentum Triangles ** is a custom indicator designed to integrate multiple dimensions of market momentum into a single, visual framework. Rather than relying on generic oscillators, this tool brings together stochastic calculations, price mapping, velocity measurement, and dynamic visual feedback to offer a layered view of market conditions.
#### Key Features and Components
- **Stochastic Calculations Mapped to Price Levels**
The indicator starts by computing the traditional stochastic oscillator values—%K, %D, and %J—over a user-defined period. These values are then mapped to the current price range. This mapping is achieved via a dedicated function that uses an exponential moving average and a rounding option, thereby linking momentum metrics directly with price dynamics.
- **Momentum Velocity and Its RSI**
To quantify the rate of change, the script calculates a “velocity” by measuring the difference in the price-mapped stochastic values over a specified lookback period. The resulting velocity values are then processed through a Relative Strength Index (RSI) calculation. This additional layer helps to provide a clearer picture of how rapidly market momentum is changing.
- **Triangle Area Measurement as a Volatility Proxy**
For each of the K, D, and J series, the indicator identifies the highest and lowest values within a user-specified lookback window and constructs triangles by connecting these extremes with the current value. The area of these triangles is computed, serving as an abstract measure of volatility and the range of price momentum. These areas are displayed alongside the velocity readings in an on-chart table for easy reference.
- **Dynamic Interpretation Label**
The tool also generates a concise reading in English that summarizes the relationships among the areas and velocity values. For example, it notes when one series, such as J, exhibits both the largest triangle area and the highest velocity. In such cases—suggesting an extended move or potential overextension—the label’s text color changes (to red) to visually alert the trader to an increased likelihood of a reversal. This approach allows traders to quickly assimilate the indicator’s data without overwhelming them with subjective language.
- **Additional Visual Elements**
Beyond the core calculations, the indicator includes a “momentum box” that captures the range of the stochastic-derived values over recent bars, as well as radial lines that provide a visual connection from the box’s reference point to current values. These elements together offer a structured, multi-faceted view of market dynamics.
#### Significance and Effects
This indicator takes a measured approach to integrating multiple aspects of market analysis. By combining price-based mapping with traditional stochastic and momentum measurements, it provides traders with:
- **A structured framework** to assess market range and momentum changes.
- **Visual cues** (such as the dynamic label and color changes) that highlight conditions warranting closer attention.
- **Tangible, calculated metrics**—triangle areas and velocity RSIs—that may assist in identifying potential reversal points.
Stochastic Momentum Triangles is intended to serve as a supplementary tool for traders who appreciate a quantitative perspective on market behavior. Its design focuses on clear, measurable outputs rather than relying on broad claims, allowing for a calm and thoughtful evaluation of market conditions.
Adaptive RSI with Real-Time Divergence [AIBitcoinTrend]👽 Adaptive RSI Trailing Stop (AIBitcoinTrend)
The Adaptive RSI Trailing Stop is an indicator that integrates Gaussian-weighted RSI calculations with real-time divergence detection and a dynamic ATR-based trailing stop. This advanced approach allows traders to monitor momentum shifts, identify divergences early, and manage risk with adaptive trailing stop levels that adjust to price action.
👽 What Makes the Adaptive RSI with Signals and Trailing Stop Unique?
Unlike traditional RSI indicators, this version applies a Gaussian-weighted smoothing algorithm, making it more responsive to price action while reducing noise. Additionally, the trailing stop feature dynamically adjusts based on volatility and trend conditions, allowing traders to:
Detects real-time divergences (bullish/bearish) with a smart pivot-based system.
Filter noise with Gaussian weighting, ensuring smoother RSI transitions.
Utilize crossover-based trailing stop activation, for systematic trade management.
👽 The Math Behind the Indicator
👾 Gaussian Weighted RSI Calculation
Traditional RSI calculations rely on simple averages of gains and losses. Instead, this indicator weights recent price changes using a Gaussian distribution, prioritizing more relevant data points while maintaining smooth transitions.
Key Features:
Exponential decay ensures recent price changes are weighted more heavily.
Reduces short-term noise while maintaining responsiveness.
👾 Real-Time Divergence Detection
The indicator detects bullish and bearish divergences using pivot points on RSI compared to price action.
👾 Dynamic ATR-Based Trailing Stop
Bullish Trailing Stop: Activates when RSI crosses above 20 and dynamically adjusts based on low - ATR multiplier.
Bearish Trailing Stop: Activates when RSI crosses below 80 and adjusts based on high + ATR multiplier
This allows traders to:
Lock in profits systematically by adjusting stop-losses dynamically.
Stay in trades longer while maintaining adaptive risk management.
👽 How It Adapts to Market Movements
✔️ Gaussian Filtering ensures smooth RSI transitions while preventing excessive lag.
✔️ Real-Time Divergence Alerts provide early trade signals based on price-RSI discrepancies.
✔️ ATR Trailing Stop dynamically expands or contracts based on market volatility.
✔️ Crossover-Based Activation enables the stop-loss system only when RSI confirms a momentum shift.
👽 How Traders Can Use This Indicator
👾 Divergence Trading
Traders can use real-time divergence detection to anticipate reversals before they happen.
Bullish Divergence Setup:
Look for RSI making a higher low, while price makes a lower low.
Enter long when RSI confirms upward momentum.
Bearish Divergence Setup:
Look for RSI making a lower high, while price makes a higher high.
Enter short when RSI confirms downward momentum.
👾 Trailing Stop Signals
Bullish Signal and Trailing Stop Activation:
When RSI crosses above 20, a trailing stop is placed using low - ATR multiplier.
If price crosses below the stop, it exits the trade and removes the stop.
Bearish Signal and Trailing Stop Activation:
When RSI crosses below 80, a trailing stop is placed using high + ATR multiplier.
If price crosses above the stop, it exits the trade and removes the stop.
This makes trend-following strategies more efficient, while ensuring proper risk management.
👽 Why It’s Useful for Traders
✔️ Dynamic and Adaptive: Adjusts to changing market conditions automatically.
✔️ Noise Reduction: Gaussian-weighted RSI reduces short-term price distortions.
✔️ Comprehensive Strategy Tool: Combines momentum detection, divergence analysis, and automated risk management into a single indicator.
✔️ Works Across Markets & Timeframes: Suitable for stocks, forex, crypto, and futures trading.
👽 Indicator Settings
RSI Length: Defines the lookback period for RSI smoothing.
Gaussian Sigma: Controls how much weight is given to recent data points.
Enable Signal Line: Option to display an RSI-based moving average.
Divergence Lookback: Configures how far back pivot points are detected.
Crossover/crossunder values for signals: Set the crossover/crossunder values that triggers signals.
ATR Multiplier: Adjusts trailing stop sensitivity to market volatility.
Disclaimer: This indicator is designed for educational purposes and does not constitute financial advice. Please consult a qualified financial advisor before making investment decisions.

EMA 200 Price Deviation AlertsThis script is written in Pine Script v5 and is designed to monitor the difference between the current price and its 200-period Exponential Moving Average (EMA). Here’s a quick summary:
200 EMA Calculation: It calculates the 200-period EMA of the closing prices.
Threshold Input: Users can set a threshold (default is 65) that determines when an alert should be triggered.
Price Difference Calculation: The script computes the absolute difference between the current price and the 200 EMA.
Alert Condition: If the price deviates from the 200 EMA by more than the specified threshold, an alert condition is activated.
Visual Aids: The 200 EMA is plotted on the chart for reference, and directional arrows are drawn:
A sell arrow appears above the bar when the price is above the EMA.
A buy arrow appears below the bar when the price is below the EMA.
This setup helps traders visually and programmatically identify significant price movements relative to a key moving average.

Enhanced Order Flow Pressure GaugeShort Description:
Estimates bullish/bearish pressure by analyzing each candle’s close position within its range, then weighting that by volume. Detects potential trend shifts and provides real-time signals.
Full Description:
1. Purpose
The Enhanced Order Flow Pressure Gauge (OFPG+) is designed to approximate buy vs. sell pressure within each bar, even if you don’t have full Level II / order flow data. By measuring the candle’s close relative to its high-low range and multiplying by volume, OFPG+ provides insights into which side of the market (bulls or bears) is more aggressive in a given interval.
2. Key Components
Pressure Score (Histogram):
Raw measure of each bar’s close position (rangePos) minus midpoint, multiplied by volume. If the bar closes near its high with decent volume, the score is positive (bullish). Conversely, a close near its low yields a negative (bearish) reading.
Cumulative Pressure:
Sum of all pressure readings over time (similar to cumulative delta), reflecting the overall market bias.
Pressure Delta:
The change in cumulative pressure from one bar to the next, plotted as a line. Rising values suggest increasing bullish momentum, while falling values show growing bearish influence.
3. Visual Cues & Signals
Histogram (Pressure Profile): A color-coded bar for each candle, indicating net bullish (blue) or bearish (gray) intrabar pressure.
Pressure Delta Line: Plotted over the histogram. Turns bullish (blue) when net buy pressure is increasing, or bearish (gray) when net selling accelerates.
Background Highlights:
Turns lightly blue if the smoothed pressure line exceeds the positive threshold, or lightly gray if it goes below the negative threshold.
Bullish / Bearish Signals:
Bullish Signal occurs when the smoothed pressure line crosses above the positive threshold, combined with a positive Delta.
Bearish Signal occurs when the smoothed pressure line crosses below the negative threshold, combined with a negative Delta.
Confirmed Signals:
After a bullish/bearish signal, OFPG+ checks the highest or lowest smoothed pressure values over a user-defined number of bars (signalLookback) to confirm momentum.
Plotshapes (diamond icons) appear on the chart to mark these confirmed reversals.
4. Usage Scenarios
Trend-Following / Momentum: Watch for transitions from negative to positive net pressure or vice versa. Helps identify potential turning points.
Reversal Confirmation: The threshold-based signals plus the “confirmed” checks can help filter choppy conditions.
Volume-Weighted Insights: By factoring in volume, strong closes near the highs or lows are weighted more heavily, capturing sentiment shifts.
5. Inputs & Parameters
Smoothing Length (length): The EMA period for smoothing the raw pressure score.
Volume Weight (volWeight): Scales the volume impact on pressure calculations.
Pressure Threshold (threshold): Defines when pressure is considered significantly bullish or bearish.
Signal Lookback (signalLookback): Number of bars to confirm momentum after a signal.
6. Alerts
Bullish Signal & Confirmed Bullish
Bearish Signal & Confirmed Bearish
These alerts can notify you in real-time about potential shifts in the market’s buying or selling pressure.
7. Disclaimer
This script provides an approximation of order flow by analyzing candle structure and volume. It does not represent actual exchange-level order data.
Past performance is not necessarily indicative of future results. Always conduct thorough analysis and use proper risk management.
Not financial advice. Use at your own discretion.

Enhanced BarUpDn StrategyEnhanced BarUpDn Strategy
The Enhanced BarUpDn Strategy is a refined price action-based trading approach that identifies market trends and reversals using bar formations. It focuses on detecting bullish and bearish momentum by analyzing consecutive price bars and key support/resistance levels.
Key Features:
✅ Trend Confirmation – Uses a combination of bar patterns and indicators (e.g., moving averages, RSI) to confirm momentum shifts.
✅ Entry Signals – A buy signal is triggered when an "Up Bar" (higher high, higher low) follows a bullish setup; a sell signal when a "Down Bar" (lower high, lower low) confirms bearish momentum.
✅ Enhanced Filters – Incorporates volume analysis and additional conditions to reduce false signals.
✅ Stop-Loss & Risk Management – Uses recent swing highs/lows for stop placement and dynamic trailing stops for maximizing gains.

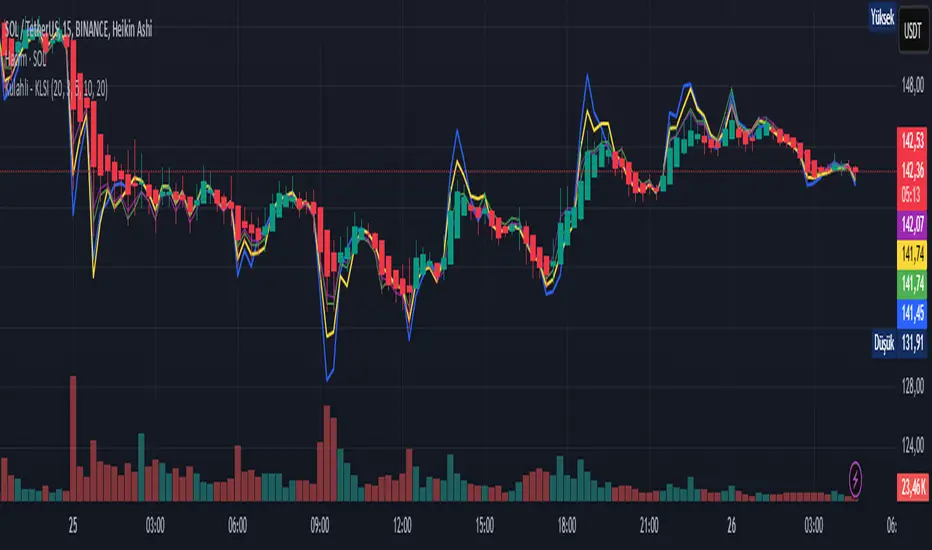
Kulahli - KLSIDynamic Price Levels & Trend Tracker
Description
This indicator focuses on identifying dynamically changing price levels and determining the trend direction.
Key Features:
Dynamic Level Calculation: Price levels are continuously recalculated in a way that is sensitive to market conditions.
Trend Indicator: Based on how long the price stays above or below a certain level, the indicator shows the trend direction (uptrend or downtrend).
Color Coding: Price levels and trend direction are coded with different colors for easy visual identification.
Customizable Sensitivity: Offers sensitivity settings to adjust how quickly the indicator reacts to price changes.
Alert Options: Can be configured to receive alerts when the price crosses a specific level or when the trend direction changes.
How to Use:
Disclaimer:
This indicator is for educational and informational purposes only and should not be considered financial advice.
Past performance is not indicative of future results.1
Use at your own risk.
Feel free to adjust this draft according to the specific features and functions of your indicator.
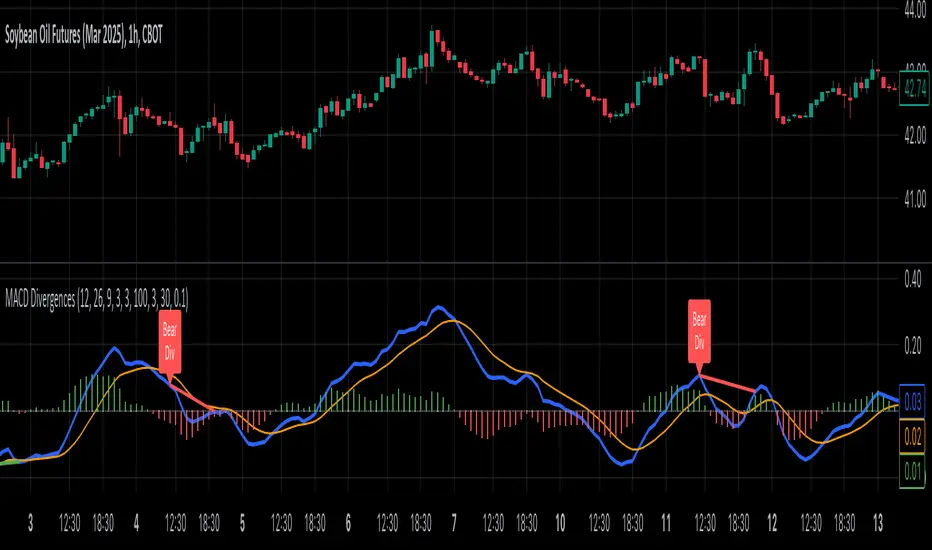
MACD Divergence all in oneMACD Divergence all in one
It can also be named as MACD dual divergence detector pro !
A sophisticated yet user-friendly tool designed to identify both bullish and bearish divergences using the MACD (Moving Average Convergence Divergence) indicator. This advanced script helps traders spot potential trend reversals by detecting hidden momentum shifts in the market, offering a comprehensive solution for divergence trading.
🎯 Key Features:
• Automatic detection of bullish and bearish divergences
• Clear visual signals with color-coded lines (Green for bullish, Red for bearish)
• Smart filtering system to eliminate false signals
• Customizable parameters to match your trading style
• Clean, uncluttered chart presentation
• Optimized performance for real-time analysis
• Easy-to-read labels showing divergence types
• Built-in signal spacing to avoid clustering
📊 How it works:
The indicator uses an advanced algorithm to analyze the relationship between price action and MACD momentum to identify:
Bullish Divergences:
- Price makes higher lows while MACD shows lower lows
- Signals potential trend reversal from bearish to bullish
- Marked with green lines and upward labels
Bearish Divergences:
- Price makes lower highs while MACD shows higher highs
- Signals potential trend reversal from bullish to bearish
- Marked with red lines and downward labels
⚙️ Customizable Settings:
1. MACD Parameters:
- Fast Length (default: 12)
- Slow Length (default: 26)
- Signal Length (default: 9)
2. Divergence Detection:
- Left/Right Pivot Bars
- Divergence Lookback Period
- Minimum/Maximum Divergence Length
- Divergence Strength Filter
3. Visual Settings:
- Clear color coding for easy identification
- Adjustable line thickness
- Customizable label size
💡 Best Practices:
- Most effective on higher timeframes (1H, 4H, Daily)
- Combine with support/resistance levels
- Use with trend lines and price action
- Consider volume confirmation
- Best results during trending markets
- Use appropriate stop-loss levels
🎓 Trading Tips:
1. Look for bullish divergences near support levels
2. Watch for bearish divergences near resistance zones
3. Confirm signals with other technical indicators
4. Consider market context and overall trend
5. Use proper position sizing and risk management
⚠️ Important Notes:
- Past performance doesn't guarantee future results
- Always use proper risk management
- Test settings on historical data first
- Different timeframes may require parameter adjustments
- Not all divergences lead to reversals
Created by: Anmol-max-star
Last Updated: 2025-02-25 16:15:08 UTC
📌 Regular updates and improvements planned!
Disclaimer:
This indicator is for informational purposes only. Always conduct your own analysis and use proper risk management techniques. Trading involves risk of loss, and past performance does not guarantee future results.
🤝 Support:
Feel free to leave comments for:
- Suggestions
- Improvements
- Feature requests
- Bug reports
- General feedback
Your feedback helps make this tool better for everyone!
Happy Trading and May the Trends Be With You! 📈
WaveTrend Divergences, Candle Colouring and TP Signal [LuciTech]WaveTrend is a momentum-based oscillator designed to track trend strength, detect divergences, and highlight potential take-profit zones using Bollinger Bands. It provides a clear visualization of market conditions to help traders identify trend shifts and exhaustion points.
The WaveTrend Oscillator consists of a smoothed momentum line (WT Line) and a signal line, which work together to indicate trend direction and possible reversals. When the WT Line crosses above the signal line, it suggests bullish momentum, while crossing below signals bearish momentum.
Candle colouring changes dynamically based on WaveTrend crossovers. If the WT Line crosses above the signal line, candles turn bullish. If the WT Line crosses below the signal line, candles turn bearish. This provides an immediate visual cue for trend direction.
Divergence Detection identifies when price action contradicts the WaveTrend movement.
Bullish Divergence appears when price makes a lower low, but the WT Line forms a higher low, suggesting weakening bearish pressure.
Bearish Divergence appears when price makes a higher high, but the WT Line forms a lower high, indicating weakening bullish pressure.
Plus (+) Divergences are stronger signals that occur when the first pivot of the divergence happens at an extreme level—above +60 for bearish divergence or below -60 for bullish divergence. These levels suggest the market is overbought or oversold, making the divergence more significant.
Bollinger Band Signals highlight potential take-profit zones by detecting when the WT Line moves beyond its upper or lower Bollinger Band.
If the WT Line crosses above the upper band, it signals stretched bullish momentum, suggesting a possible pullback or reversal.
If the WT Line crosses below the lower band, it indicates stretched bearish momentum, warning of a potential bounce.
How It Works
The WaveTrend momentum calculation is based on an EMA-smoothed moving average to filter out noise and provide a more reliable trend indication.
The WT Line (momentum line) fluctuates based on market momentum.
The signal line smooths out the WT Line to help identify trend shifts.
When the WT Line crosses above the signal line, it suggests buying pressure, and when it crosses below, it indicates selling pressure.
Divergences are detected by comparing pivot highs and lows in price with pivot highs and lows in the WT Line.
A pivot forms when a local high or low is confirmed after a certain number of bars.
The indicator tracks whether price action and the WT Line are making opposite movements.
If a divergence occurs and the first pivot was beyond ±60, it is marked as a Plus Divergence, making it a stronger reversal signal.
Bollinger Bands are applied directly to the WT Line instead of price, identifying when the WT Line moves outside its volatility range. This helps traders recognize when momentum is overstretched and a potential reversal or retracement is likely.
Settings
Channel Length (default: 8) controls the period used to calculate the WT Line.
Average Length (default: 16) smooths the WT Line for better trend detection.
Divergences (on/off) enables or disables divergence plotting.
Candle colouring (on/off) applies or removes trend-based candle colour changes.
Bollinger Band Signals (on/off) toggles take-profit signals when the WT Line crosses the bands.
Bullish/Bearish colours allow customization of divergence and signal colours.
Interpretation
The WaveTrend Oscillator helps traders assess market momentum and trend strength.
Crossovers between the WT Line and signal line indicate potential trend reversals.
Divergences warn of weakening momentum and possible reversals, with Plus Divergences acting as stronger signals.
Bollinger Band Crosses highlight areas where momentum is overstretched, signaling potential profit-taking opportunities.

Balance Price Range (BPR) IndicatorOverview
The BPR with Directional Momentum-Filtered Breakouts indicator is designed to identify Balanced Price Ranges (BPR) and d etect high-probability breakouts and breakdowns with directional momentum confirmation . By leveraging historical BPR structures, EMA-based momentum filtering , and a trade cooldown mechanism , this script provides a structured approach to identifying potential trading opportunities while reducing false signals.
This invite-only indicator is ideal for traders who seek precise breakout confirmation, reduced noise, and trend-following logic while maintaining flexibility through adjustable parameters.
How It Works
The script follows a multi-step breakout detection process by integrating multiple key technical components:
1. Balanced Price Range (BPR) Detection:
• A Balanced Candle is identified when the price remains within a specific percentage of its range midpoint.
• These BPR zones represent areas of equilibrium , where a breakout or breakdown is likely to occur.
• The script historically tracks BPR levels across the entire chart to monitor price action around key areas.
2. Momentum-Filtered Breakout & Breakdown Logic:
• Bullish Breakout: Occurs when the price breaks above the historical BPR high with bullish momentum.
• Bearish Breakdown: Occurs when the price breaks below the historical BPR low with bearish momentum.
• Momentum Confirmation: Each breakout requires a strong directional move, measured against the Exponential Moving Average (EMA) .
• Only confirmed breakouts are marked, reducing the likelihood of false signals in choppy markets.
3. Candle-Based Background Visualization:
• Grey Background: Represents a Balanced Price Range (BPR), indicating potential breakout zones.
• Green Background: Indicates a Bullish Breakout when the price successfully breaks and holds above the BPR high.
• Red Background: Indicates a Bearish Breakdown when the price drops below the BPR low.
4. Trade Cooldown Mechanism:
• Prevents consecutive signals from triggering too frequently.
• Default cooldown period: 5 bars (adjustable).
• Ensures that trades are not clustered, improving signal quality.
5. EMA for Trend Direction & Confirmation:
• A 20-period EMA (default, adjustable) is used to confirm trade direction.
• Breakouts above the EMA align with uptrend continuation.
• Breakdowns below the EMA align with downtrend momentum.
Key Features
✔️ Historical BPR Detection – Tracks past BPR levels across the entire chart for structured breakout zones.
✔️ Momentum-Based Breakouts – Ensures breakouts are confirmed by directional price movement before generating signals.
✔️ Candle-Based Background Logic – Subtle candle highlights rather than full background fills, for better chart clarity.
✔️ Trade Cooldown Period – Prevents consecutive buy/sell signals within a defined period, improving signal efficiency.
✔️ Dynamic EMA Confirmation – Ensures trades align with the overall trend, reducing counter-trend trades.
✔️ Customizable Inputs – Adjust breakout thresholds, EMA length, and cooldown periods as per trading style.
✔️ Works Across Multiple Timeframes – Can be applied to intraday, swing, and positional trading strategies.
How to Use
1. Look for Balanced Price Ranges ( BPR )
• These zones highlight equilibrium areas where price is likely to break out.
• Grey-shaded candles indicate potential breakout zones.
2. Monitor for Bullish or Bearish Breakouts
• A green candle background signals a bullish breakout above BPR.
• A red candle background signals a bearish breakdown below BPR.
• The EMA filter helps confirm whether the breakout aligns with the prevailing trend.
3. Follow the Cooldown Logic
• After a breakout signal, wait for the cooldown period before another trade is allowed.
• This helps filter out noisy price action and prevents excessive trading.
4. Use Alongside Other Indicators
• Works well with volume analysis, support/resistance levels, and price action strategies.
• Can be combined with other momentum indicators for further trade confirmation.
Why This Combination?
Unlike generic breakout indicators, this script uniquely combines:
• BPR historical structures for defining potential breakout zones.
• Momentum-based breakout filtering using EMA confirmation.
• Trade cooldown logic to avoid excessive trading signals.
• Subtle candle-based highlights instead of cluttered full-background fills.
This structured approach makes the indicator more robust, adaptive, and reliable in different market conditions.
Why It’s Worth Using?
🔹 Avoid False Breakouts: Built-in momentum confirmation prevents weak or fake breakouts.
🔹 Clean Visualization: No excessive overlays—just precise, meaningful background coloring for breakouts.
🔹 Works in Any Market: Use on stocks, crypto, forex, indices, and commodities across different timeframes.
🔹 User-Friendly & Customizable: Fine-tune parameters to match individual trading styles.
⚠️ Note: This is an Invite-Only script. Access is granted to selected users.
✅ If you find it useful, consider incorporating it into your trend-following & breakout trading strategies.
🚀 Optimize your trading with structured breakout detection! 🚀
Bar Color - Moving Average Convergence Divergence [nsen]The Pine Script you've provided creates a custom indicator that utilizes the MACD (Moving Average Convergence Divergence) and displays various outputs, such as bar color changes based on MACD signals, and a table of data from multiple timeframes. Here's a breakdown of how the script works:
1. Basic Settings (Input)
• The script defines several user-configurable parameters, such as the MACD values, bar colors, the length of the EMA (Exponential Moving Average) periods, and signal smoothing.
• Users can also choose timeframes to analyze the MACD values, like 5 minutes, 15 minutes, 1 hour, 4 hours, and 1 day.
2. MACD Calculation
• It uses the EMA of the close price to calculate the MACD value, with fast_length and slow_length representing the fast and slow periods. The signal_length is used to calculate the Signal Line.
• The MACD value is the difference between the fast and slow EMA, and the Signal Line is the EMA of the MACD.
• The Histogram is the difference between the MACD and the Signal Line.
3. Plotting the Histogram
• The Histogram values are plotted with colors that change based on the value. If the Histogram is positive (rising), it is colored differently than if it's negative (falling). The colors are determined by the user inputs, for example, green for bullish (positive) signals and red for bearish (negative) signals.
4. Bar Coloring
• The bar color changes based on the MACD's bullish or bearish signal. If the MACD is bullish (MACD > Signal), the bar color will change to the color defined for bullish signals, and if it's bearish (MACD < Signal), the bar color will change to the color defined for bearish signals.
5. Multi-Timeframe Data Table
• The script includes a table displaying the MACD trend for different timeframes (e.g., 5m, 15m, 1h, 4h, 1d).
• Each timeframe will show a colored indicator: green (🟩) for bullish and red (🟥) for bearish, with the background color changing based on the trend.
6. Alerts
• The script has alert conditions to notify the user when the MACD shows a bullish or bearish entry:
• Bullish Entry: When the MACD turns bullish (crosses above the Signal Line).
• Bearish Entry: When the MACD turns bearish (crosses below the Signal Line).
• Alerts are triggered with custom messages such as "🟩 MACD Bullish Entry" and "🟥 MACD Bearish Entry."
Key Features:
• Customizable Inputs: Users can adjust the MACD settings, histogram colors, and timeframe options.
• Visual Feedback: The color changes of the histogram and bars provide instant visual cues for bullish or bearish trends.
• Multi-Timeframe Analysis: The table shows the MACD trend across multiple timeframes, helping traders monitor trends in different timeframes.
• Alert Conditions: Alerts notify users when key MACD crossovers occur.

SuperTrend AI Oscillator StrategySuperTrend AI Oscillator Strategy
Overview
This strategy is a trend-following approach that combines the SuperTrend indicator with oscillator-based filtering.
By identifying market trends while utilizing oscillator-based momentum analysis, it aims to improve entry precision.
Additionally, it incorporates a trailing stop to strengthen risk management while maximizing profits.
This strategy can be applied to various markets, including Forex, Crypto, and Stocks, as well as different timeframes. However, its effectiveness varies depending on market conditions, so thorough testing is required.
Features
1️⃣ Trend Identification Using SuperTrend
The SuperTrend indicator (a volatility-adjusted trend indicator based on ATR) is used to determine trend direction.
A long entry is considered when SuperTrend turns bullish.
A short entry is considered when SuperTrend turns bearish.
The goal is to capture clear trend reversals and avoid unnecessary trades in ranging markets.
2️⃣ Entry Filtering with an Oscillator
The Super Oscillator is used to filter entry signals.
If the oscillator exceeds 50, it strengthens long entries (indicating strong bullish momentum).
If the oscillator drops below 50, it strengthens short entries (indicating strong bearish momentum).
This filter helps reduce trades in uncertain market conditions and improves entry accuracy.
3️⃣ Risk Management with a Trailing Stop
Instead of a fixed stop loss, a SuperTrend-based trailing stop is implemented.
The stop level adjusts automatically based on market volatility.
This allows profits to run while managing downside risk effectively.
4️⃣ Adjustable Risk-Reward Ratio
The default risk-reward ratio is set at 1:2.
Example: A 1% stop loss corresponds to a 2% take profit target.
The ratio can be customized according to the trader’s risk tolerance.
5️⃣ Clear Trade Signals & Visual Support
Green "BUY" labels indicate long entry signals.
Red "SELL" labels indicate short entry signals.
The Super Oscillator is plotted in a separate subwindow to visually assess trend strength.
A real-time trailing stop is displayed to support exit strategies.
These visual aids make it easier to identify entry and exit points.
Trading Parameters & Considerations
Initial Account Balance: Default is $7,000 (adjustable).
Base Currency: USD
Order Size: 10,000 USD
Pyramiding: 1
Trading Fees: $0.94 per trade
Long Position Margin: 50%
Short Position Margin: 50%
Total Trades (M5 Timeframe): 1,032
Visual Aids for Clarity
This strategy includes clear visual trade signals to enhance decision-making:
Green "BUY" labels for long entries
Red "SELL" labels for short entries
Super Oscillator plotted in a subwindow with a 50 midline
Dynamic trailing stop displayed for real-time trend tracking
These visual aids allow traders to quickly identify trade setups and manage positions with greater confidence.
Summary
The SuperTrend AI Oscillator Strategy is developed based on indicators from Black Cat and LuxAlgo.
By integrating high-precision trend analysis with AI-based oscillator filtering, it provides a strong risk-managed trading approach.
Important Notes
This strategy does not guarantee profits—performance varies based on market conditions.
Past performance does not guarantee future results. Markets are constantly changing.
Always test extensively with backtesting and demo trading before using it in live markets.
Risk management, position sizing, and market conditions should always be considered when trading.
Conclusion
This strategy combines trend analysis with momentum filtering, enhancing risk management in trading.
By following market trends carefully, making precise entries, and using trailing stops, it seeks to reduce risk while maximizing potential profits.
Before using this strategy, be sure to test it thoroughly via backtesting and demo trading, and adjust the settings to match your trading style.
