STARKPROFITS SCALPER 2.0señales compra y venta..tendencia y estructura del mercado.se basa en tendenciaPine Script® göstergesiPedroRamirezSilva tarafından29
SuperEMA RSI Strategy [wjdtks255]Indicator Description and Trading Guide for “SuperEMA RSI Strategy ” Indicator Name: SuperEMA RSI Strategy Description The SuperEMA RSI Strategy combines fast and slow Exponential Moving Averages (EMA) to identify key trend changes, enhanced with the Relative Strength Index (RSI) to filter momentum strength. It plots clear buy and sell signals based on EMA crossovers while highlighting trend zones with colored backgrounds for quick visual reference. This multi-timeframe compatible indicator is suitable for stocks, cryptocurrencies, and other markets. How to Use the SuperEMA RSI Strategy Buy Signal: Enter a long position when the short-term EMA crosses above the long-term EMA, indicated by a green circle below the price bar. Confirm the trend with a green background and consider RSI values showing sufficient momentum (typically RSI above 50). Sell Signal: Enter a short position when the short-term EMA crosses below the long-term EMA, indicated by a red circle above the price bar. Confirm the bearish trend with a red background and verify momentum weakening (typically RSI below 50). Trend Confirmation: Use the background color-shaded zones to identify prevailing trend strength and avoid counter-trend trades. RSI Application: Optionally enable RSI display to avoid overbought/oversold entries by watching for levels above 70 (overbought) or below 30 (oversold). Additional Tips Adjust EMA and RSI parameters to suit different timeframes or asset volatility. Combine this indicator with volume analysis and other technical tools for enhanced signal reliability. Implement well-defined stop-loss and take-profit levels to manage risk effectively. Pine Script® göstergesiwjdtks255 tarafından18
盯盘-平均K线图This is a Pine Script v6 indicator/strategy designed to assist traders with clear, configurable trend and momentum signals. It combines adaptive filters and volatility-aware logic to highlight high‑quality entries and exits, includes optional multi‑timeframe confirmation, and supports risk controls such as stop loss/target levels. Signals are visualized directly on the chart with arrows/labels and can trigger TradingView alerts for real‑time notifications. The tool offers smoothing and sensitivity settings to tune responsiveness, overlay mode for price action, and strategy mode for backtesting performance. It’s built to be lightweight, transparent, and easy to adjust, helping traders streamline decision‑making while maintaining control over parameters and risk.Pine Script® stratejisitaozitong tarafından20
Fib+BOS/CHOCH+OB# ⭐ 1) **What This Indicator Does** The indicator combines 4 major concepts: ### **1️⃣ Market Structure (Swing High/Low)** * Detects major swing highs and lows using pivot logic * Determines whether the market is **Bullish** or **Bearish** ### **2️⃣ BOS / CHOCH (Break of Structure / Change of Character)** * **BOS:** continuation of trend * **CHOCH:** early signal of trend reversal * Only the **last 5** levels are displayed → keeps chart clean ### **3️⃣ Order Blocks (OB)** * Detects last opposite candle before BOS/CHOCH * Displays only **the latest 3 OB zones** * Ideal for identifying high-probability pullbacks Pine Script® göstergesisuphotsudsee tarafından74
Institutional Buying %This is an Institutional Footprint Detector that identifies when large traders (institutions, hedge funds, market makers) are actively accumulating or distributing. Unlike retail-focused indicators, it detects the specific signatures institutions leave in the market: Absorption (high volume, low movement) Liquidity grabs (stop hunts) Volume delta (buying vs selling pressure) Hidden divergences (smart money disagreeing with price) What it catches: Sustained institutional accumulation Directional conviction with volume When smart money is aggressively buying/selling Divergences: Hidden bullish div: Price makes lower low, but delta makes higher low Translation: "Price falling but institutions secretly buying" Hidden bearish div: Price makes higher high, but delta makes lower high Translation: "Price rising but institutions secretly selling" Absorption Example: Price at support: $100 Volume: 3x average Range: Only $0.50 movement Close up → Bullish absorption (institutions eating supply) What it catches: Institutions absorbing supply without moving price Stealth accumulation at support Distribution at resistance Classic "they're loading the boat" behavior ATR-adaptive zones: Works on crypto, stocks, futures automatically Liquidity Grabs Example: Recent low: $98 Price spikes to $97.50 (breaks low, triggers stops) Strong wick recovery, closes at $99.50 Bullish grab → Institutions hunted stops, now buying Filters: Wick must be >1.2x opposite wick (real rejection) Range expansion (filters inside bars) Volume confirmation This is pure market manipulation detection Higher timeframe institutional flow Confirmation Purpose: Prevents trading against the institutional trend Acts as a confirmation filter, not primary driver "Don't fight the bigger money" Adjustable: 5% for pure signal, 15% for strong trend following How to Read the Signals The Histogram (Main Display) Green Zone (>65%): Strong institutional buying All 4 components aligned bullish Safe to be long-biased Look for entries on pullbacks Orange Zone (35-65%): Neutral/Consolidation Mixed signals Institutions not committed Wait for clarity Red Zone (<35%): Strong institutional selling All 4 components aligned bearish Reduce longs, consider shorts Institutions distributing Background Highlights Lime Background: Bullish divergence detected Hidden accumulation happening Price may be about to reverse up Major signal - institutions disagree with price decline Red Background: Bearish divergence detected Hidden distribution happening Price may be about to reverse down Major signal - institutions disagree with price rally Optional: Cumulative Delta Line Shows session-level institutional flow: Rising line → Net buying pressure this session Falling line → Net selling pressure this session Resets daily (or your chosen session boundary) Use: Confirms the histogram direction with intraday flow How to Trade With It Setup 1: Divergence + Absorption (Highest Probability) Wait for divergence background (lime or red) Check if absorption is occurring (enable debug plot for absorption Percent) Enter when histogram crosses into green/red zone Example: Price falling, making lower lows Lime background appears (bullish divergence) Histogram crosses above 65% Entry: Go long, institutions are accumulating Setup 2: Liquidity Grab Reversal Price breaks obvious support/resistance Strong wick rejection appears Histogram confirms direction (green for bullish grab, red for bearish) Example: Price breaks $100 support, hits $99 Long lower wick, closes $101 Histogram >65% green Entry: Long, stop hunt complete Setup 3: HTF Alignment (Trend Following) Set HTF to 240min or Daily Increase HTF weight to 10-15% Only trade when histogram aligns with HTF Example: Daily timeframe shows strong accumulation On 15min chart, wait for histogram >65% Entry: Long on any green bar Setup 4: Session Reset Play (Day Traders) Enable cumulative delta plot At session open, watch for delta direction Enter when histogram confirms Example: Market opens Cumulative delta immediately spikes positive Histogram moves into green zone Entry: Long, institutions showing hand early Best Practices ✅ DO: Wait for histogram to cross thresholds clearly Trust divergences - they're ±35 point boosts for a reason Use HTF as confirmation filter, not primary signal Tune divergence sensitivity per instrument Combine with price action at key levels ❌ DON'T: Trade in orange zone (institutions not committed) Ignore divergence backgrounds (major signals) Fight histogram when it's strongly green/red Use on extremely illiquid assets Enable all debug plots on 1min charts (lag) This indicator gives you institutional x-ray vision. When the histogram is green, the big money is buying. When it's red, they're selling. The divergences show you when they're doing it secretly. Trade with them, not against them. The label on the price scale shows the current Institutional Buying Percentage - it's a real-time reading of the indicator value. What the Number Means The label displays a value between 0 and 100: Example readings: 75 (Green) → Institutions are strongly buying 75% buying pressure vs 25% selling pressure All components (delta, absorption, liquidity, HTF) aligned bullish Safe to be long-biased 50 (Orange) → Neutral/Balanced Equal buying and selling pressure Institutions not committed either way Wait for clarity before entering 25 (Red) → Institutions are strongly selling 25% buying pressure vs 75% selling pressure All components aligned bearish Reduce longs, consider shorts Pine Script® göstergesiKirk_M tarafındanGüncellendi 2233
EMA Velocity Dual TF Momentum 1h (v2)BINANCE:SOLUSDT The result is calculated on futures x10 ### EMA Velocity Dual TF Momentum (v2) – Public Description **Overview** EMA Velocity Dual TF Momentum (v1) is a trend-following momentum strategy that uses the *speed of change* of Exponential Moving Averages (EMA) on two timeframes: the chart timeframe 1h. The strategy looks for moments when both timeframes point in the same direction and the short‑term momentum is significantly stronger than usual, then manages trades with configurable ATR filtering, stop‑loss / take‑profit and early exit logic. --- ### Core Idea (high level, without formulas) - On the **lower timeframe** (LTF), the strategy tracks how fast the EMA is moving (its “velocity”) and detects **impulse bars** where this velocity is unusually strong compared to its recent history. - On the **higher timeframe** (HTF), it also measures EMA velocity and requires that the HTF trend direction is **aligned** with the LTF (both bullish or both bearish), if enabled. - A **long trade** is opened when: - LTF EMA velocity is positive (upward momentum), - LTF momentum is strong enough (impulse), - HTF EMA velocity is also upwards (if HTF filter is enabled), - and ATR‑based volatility is above the minimum threshold. - A **short trade** is opened in the symmetric situation (downward momentum on both timeframes). - Positions are closed using configurable stop‑loss and take‑profit, and can be partially exited, moved to break‑even and trailed using early‑exit options. --- ### Inputs and Parameters #### Trend & Momentum (Lower Timeframe) - **`LTF EMA length (emaLenLTF)`** Length of the EMA on the chart timeframe used to measure short‑term trend and momentum. Smaller values react faster; larger values are smoother and slower. - **`LTF velocity lookback (velKLTF)`** Lookback for computing EMA “velocity” on LTF. Controls how sensitive the momentum calculation is to recent price changes. - **`LTF impulse lookback bars (impLookback)`** Window size used to estimate the “normal” average absolute velocity. The strategy compares current momentum against this baseline to detect strong impulse moves. - **`LTF |velocity| multiplier vs average (impMult)`** Multiplier for defining what counts as a strong impulse. Higher values = fewer but stronger signals; lower values = more frequent, weaker impulses. #### Trend & Momentum (Higher Timeframe) - **`Use higher timeframe alignment (useHTF)`** If enabled, trades are only taken when the higher‑timeframe EMA velocity confirms the same direction as the lower timeframe. - **`HTF timeframe (htf_tf)`** Higher timeframe used for confirmation (e.g. 60 minutes). Defines the “macro” context above the chart timeframe. - **`HTF EMA length (emaLenHTF)`** Length of the EMA on the higher timeframe. Controls how smooth and slow the higher‑timeframe trend filter is. - **`HTF velocity lookback (velKHTF)`** Lookback for the EMA velocity on HTF. Smaller values react quicker to changes in the higher‑timeframe trend. #### Volatility / ATR Filter - **`Use ATR filter (useAtrFilter)`** Enables a volatility filter based on Average True Range. When active, trades are allowed only if market volatility is not too low. - **`ATR Period (atrPeriod)`** Lookback period for ATR calculation. Shorter periods react faster to recent volatility shifts; longer ones are more stable. - **`ATR Min % for trading (atrMinPerc)`** Minimum ATR as a percentage of price required to trade. Filters out very quiet, choppy periods where the strategy is more likely to be whipsawed. #### Risk Management - **`Use stops (SL/TP) (useStops)`** Enables fixed stop‑loss and take‑profit exits. If disabled, positions are managed only by early exit logic and manual closing. - **`Stop Loss % (stopLossPerc)`** Distance of the protective stop from entry, in percent. Higher values give trades more room but increase risk per trade. - **`Take Profit % (takeProfitPerc)`** Distance of the primary profit target from entry, in percent. Controls the reward‑to‑risk profile of each trade. #### Early Exit / Break‑Even / Trailing - **`Enable early exit module (useEarlyExit)`** Master switch for all early exit features: partial profit taking, break‑even stops and trailing exits. - **`Take partial profit at +% (close 50%) (partialTP)`** Profit level (in %) at which the strategy closes a partial portion of the position (e.g. 50%), locking in gains while leaving a runner. - **`Trailing TP distance (%) (trailTP)`** Distance (in %) for dynamic trailing stop after entry. When positive, the strategy trails the price to protect profits as the move extends. - **`Break-even stop after +% profit (useBreakEven)`** Enables automatic move of the stop to the entry price once a certain profit threshold is reached. - **`Break-even activation (+%) (breakEvenPerc)`** Profit level (in %) at which the stop is moved to break‑even. Higher values require a larger unrealized profit before break‑even protection kicks in. #### Visuals - **`Show labels (showLabels)`** Toggles on‑chart labels that mark long and short entry signals for easier visual analysis. - **`Label offset (labelOffset)`** Horizontal offset (in bars) for placing labels relative to the signal bar. Used only for visual clarity; does not affect trading logic. --- Если нужно, могу на основе этого текста сразу подготовить компактную версию (ограниченную по символам) специально под поле описания публичного скрипта в TradingView.Pine Script® stratejisiParan03d tarafından113
EMA Velocity Volatility Clamp (v1)A strategy based on the rate of price change using EMA. Configured for the 5M Solana. BINANCE:SOLUSDT Pine Script® stratejisiParan03d tarafından3
RSI Arrow Signals (Daily & Weekly)📘 Indicator Overview This indicator identifies oversold conditions using RSI on two higher timeframes and plots visual signals directly on the chart. It is designed for traders who want to track multi-timeframe RSI exhaustion without switching charts. 🔍 How It Works 1. Daily RSI Signal (Orange Arrow) The script pulls Daily RSI using request.security(). When the Daily RSI closes at 30 or below, an orange upward arrow is displayed beneath the bar. 2. Weekly RSI Signal (Red Arrow) The script also retrieves Weekly RSI. When the Weekly RSI closes at 30 or below, a red upward arrow appears beneath the bar. Both signals use confirmed candle data to reduce repainting. 🎯 Purpose This tool highlights potential oversold reversal zones across two key timeframes. It helps traders quickly identify moments when price may be stretched to the downside on Daily or Weekly context ⚙️ Features Multi-timeframe RSI (Daily & Weekly) Color-coded arrow signals for quick visual recognition Optional alert conditions for automated notifications Works on any chart timeframe via request.security() Repaint-safe (no lookahead_on) 📌 Important Notes Signals only appear after the Daily or Weekly candle closes. This indicator is not a buy/sell system; it serves as a market condition signal. Use together with your own risk management and additional confluence. *this indicator is helped by GPTPine Script® göstergesipersmmon tarafından2
MA200 Parallel ChannelDynamic MA100 Parallel Bands – Precision S/R Levels This indicator builds a clean, parallel channel around the 100-period moving average using a fixed ±4 offset. Because the offset mirrors the short-term MA1 fluctuations, the channel reveals highly accurate support and resistance zones that react instantly to market micro-structure. Unlike Bollinger Bands—which expand with volatility—this tool stays perfectly parallel and trend-aligned, making breakouts and pullbacks incredibly easy to spot. How it works: Centerline: 100-period moving average (MA100) Upper Band: MA100 + 4 Lower Band: MA100 – 4 MA1 used as a sensitivity reference for micro-trend behavior Parallel structure ensures stable, predictable levels Why it’s powerful: The ±4 channel creates extremely precise S/R zones Price respecting the lower band = dynamic support Price rejecting the upper band = dynamic resistance A clean break above or below the bands highlights strong momentum shifts Perfect for intraday traders needing structure without noise Perfect for: Identifying high-probability bounce levels Spotting early trend continuation Confirming MA100 breakouts Filtering weak signals and fake volatility spikes If you want razor-sharp support & resistance levels that stay consistent across all timeframes, these MA100 parallel bands deliver exceptional clarity.Pine Script® göstergesiS_P_X_500 tarafından45
HTF BIAS FILTER🧭HTF Bias Filter Indicator: 5 in 1 indicator Technical Overview The Bias Filter is a comprehensive multi-timeframe tool designed to confirm directional bias using five key indicators before entering a trade. It plots higher-timeframe Moving Averages directly on the chart and provides an immediate status summary via a static dashboard. The more confluence on the dashboard, the greater the probability of the direction of the trade. 1. 📊 Display Components A. Plotted Lines The indicator uses the request.security function to draw Moving Averages from higher timeframes onto your current chart: 1H EMA 21 (Purple): The 21-period Exponential Moving Average calculated on the 1-Hour (60 min) chart. Plotted using a step-line style. 4H EMA 50 (Red): The 50-period Exponential Moving Average calculated on the 4-Hour (240 min) chart. Plotted using a step-line style. B. Directional Dashboard A fixed-position summary table is anchored to the bottom-right corner of the chart, providing a quick glance at the current status of all five filters. 2. 🎨 Colour Logic Each of the five indicators is assigned a colour based on its current directional signal. The more indicators that show the same colour (confluence), the stronger the signal and the higher the likelihood of a high-probability trade. 🟢 Green indicators are signaling UP/BUY (Bullish momentum or trend). 🔴 Red indicators are signaling DOWN/SELL (Bearish momentum or trend). ⚫ Gray indicators are signaling Mixed or flat directions (neutral or undecided). Note: The dashboard's main header color is determined by a strict confluence logic (All four 4H filters must align for Green/Red), while individual indicator colors follow the simple rules above. 3. 📋 Indicator Breakdown and Logic The dashboard provides the direction of five different filters. 3.1. Higher-Timeframe (HTF) Trend Indicators These two signals determine the immediate slope and direction of the primary Moving Averages: 4H EMA 50: Timeframe: 4-Hour (240 min) Logic: Compares the current EMA value to the value two bars ago on the 4H chart. Output: UP ↑, DOWN ↓, or FLAT ⏸ 1H EMA 21: Timeframe: 1-Hour (60 min) Logic: Compares the current EMA value to the value two bars ago on the 1H chart. Output: UP ↑, DOWN ↓, or FLAT ⏸ 3.2. 4-Hour Confluence Filters These three indicators provide supplementary confirmation on Volume, Price Position, and Momentum, all calculated on the 4-Hour (240 min) chart: 4H OBV (Smoothed): Timeframe: 4-Hour (240 min) Logic: Direction is based on the current value of the 21-bar smoothed On-Balance Volume (OBV) compared to its value nine bars ago. Output: UP ↑, DOWN ↓, or FLAT ⏸ 4H ATR DIR (EMA Proxy): Timeframe: 4-Hour (240 min) Logic: Determines the price position by comparing the current Close price against the 4H EMA 50. Output: BUY 🟢 (Close > EMA 50), SELL 🔴 (Close < EMA 50), or FLAT ⏸️ (Close = EMA 50). 4H RSI (14): Timeframe: 4-Hour (240 min) Logic: Momentum check comparing the 14-period Relative Strength Index (RSI) value against the 50 level. Output: BUY 🟢 (RSI > 50), SELL 🔴 (RSI < 50), or FLAT ⏸️ (RSI = 50).Pine Script® göstergesiThe_Tokyo_Protocol tarafındanGüncellendi 32
TradingBee Supp & ResisTradingBee Untapped S&R 1. Core Concept This indicator is designed to identify "Fresh" or "Untapped" institutional order blocks. It operates on the theory that significant market reversals often occur at precise price points where the Close of one candle perfectly matches the Open of the next. When price reverses exactly at a specific level (without overlap), it indicates a strong rejection. This level remains valid (fresh) until the price returns to test it. Once tested, the level is considered "consumed" and is removed from the chart. 2. How It Works (The Logic) The indicator scans historical and real-time data for a specific Reversal Pattern: Bearish Reversal (Resistance): Previous Candle was Bullish (Green). Current Candle is Bearish (Red). Crucial Condition: The Close of the Green candle is equal to the Open of the Red candle (within your set tolerance). Result: A Red line is drawn at this price. Bullish Reversal (Support): Previous Candle was Bearish (Red). Current Candle is Bullish (Green). Crucial Condition: The Close of the Red candle is equal to the Open of the Green candle. Result: A Green line is drawn at this price. 3. Key Features Infinite "Untapped" Lines: The lines extend infinitely to the right side of the chart, allowing you to see levels created days or weeks ago that have not yet been revisited. Auto-Deletion (Smart Cleaning): As soon as the price (High or Low) touches a line, the indicator detects that the liquidity has been "tapped." The line immediately deletes itself to keep your chart clean and focused only on fresh opportunities. Multi-Timeframe (MTF) Capability: You can lock the indicator to a higher timeframe (e.g., 4 Hours) while watching a lower timeframe (e.g., 15 Minutes). This allows you to trade intraday fluctuations while remaining aware of major swing levels. Visuals: You can customize the Line Color and Width. Label Settings: Choose if you want the text to appear Above, Below, or On the line, and whether it should follow the price or stay fixed.Pine Script® göstergesiTradBee tarafından8
SIGMA 0.21✨ Professional Description for the SIGMA 0.21 Script: The code is a custom indicator built for the TradingView platform, written in Pine Script (version 6). It is an advanced technical analysis tool designed to intelligently interact with price action across multiple timeframes. The script provides entry and exit signals, dynamic support and resistance zones, linear regression channels, all supported by an informative dashboard and a rich visual interface. ✨ وصف احترافي للكود SIGMA 0.21: الكود هو مؤشر مخصص لمنصة TradingView مكتوب بلغة Pine Script (الإصدار السادس)، وهو أداة تحليل فني متقدمة تركّز على التفاعل الذكي مع حركة السعر عبر عدة أطر زمنية. يوفر إشارات دخول وخروج، مناطق دعم ومقاومة ديناميكية، وانحدارات خطية، وكل ذلك مدعوم بلوحة معلومات وواجهة عرض بصرية غنية. 📌 إخلاء مسؤولية قانونية (Disclaimer): هذا المؤشر لأغراض تعليمية وتحليلية فقط، ولا يُعد نصيحة استثمارية أو توصية بالشراء أو البيع. يعتمد المستخدم على المؤشر تحت مسؤوليته الشخصية الكاملة. لا يتحمل مطوّر المؤشر أو أي جهة مرتبطة به أي مسؤولية عن أي خسائر مالية قد تنتج عن استخدام هذا المؤشر في التداول. يُنصح دائمًا باستخدام المؤشرات الفنية مع استراتيجيات إدارة المخاطر وعدم الاعتماد عليها بشكل منفرد في اتخاذ القرارات الاستثمارية. 📌 Legal Disclaimer: This indicator is intended for educational and analytical purposes only and does not constitute financial advice or a recommendation to buy or sell any asset. The user assumes full personal responsibility for any trading decisions made based on this indicator. The developer or any associated parties are not liable for any financial losses that may occur from the use of this tool. It is strongly recommended to use this indicator in combination with sound risk management strategies and not as a standalone decision-making tool.Pine Script® göstergesimatar007 tarafından1111
3-DMA Panic Reversal [Diodato/SMI]This indicator is a market breadth tool designed to identify panic selling climaxes and potential bullish reversals. It combines Diodato's 3-DMA % Decliners with the Stochastic Momentum Index (SMI) to filter for high-probability setups. How It Works The indicator tracks the 3-Day Moving Average of Declining Issues. When this metric spikes above 65%, it signals extreme market panic. Signals 🟢 Green Dot (Bullish Reversal): Appears when a panic phase ends. It triggers when the 3-DMA Decliners crosses back under the 65% panic threshold, but only if the market was Oversold (SMI < 0) at some point during the panic. This "latch" logic ensures you catch the reversal even if momentum shifts slightly before the panic fully subsides. 🔴 Red Dot (Bearish/Overbought): Appears if the 3-DMA Decliners is high (> 65%) while the market is simultaneously Overbought (SMI > 40). This is a rare but powerful signal of extreme volatility or a "crash up" exhaustion. Settings Panic Threshold: Default 65% (Adjustable). SMI Settings: 10, 3, 3 (Fast/Standard). Credits Original concept by Diodato. Enhanced with SMI context for precision.Pine Script® göstergesisuresh789 tarafından28
STEVEN Ichimoku BUY & SELLIchimoku Cloud + Advanced Buy/Sell Signals This indicator enhances the traditional Ichimoku Cloud system by adding highly refined BUY and SELL signals based on price–Tenkan interactions, cloud positioning, and multi-step validation rules. It is designed to help traders identify high-probability trend continuation entries while filtering out signals that occur near the Kumo, where market structure is typically uncertain. ✅ BUY Signal Logic A BUY signal is triggered only when all of the following conditions are met: Price is above the Kumo Cloud, confirming a bullish environment. Tenkan (Conversion Line) is above the Kumo, reinforcing bullish momentum. Price makes a bullish cross above the Tenkan within the last 6 bars. The entry candle opens below the Tenkan and closes above it, ensuring a clean upside break. The candle must NOT touch the Kumo. If the candle touches the Kumo, the indicator waits for the next clean candle that closes above Tenkan without touching the Kumo, then triggers the BUY signal. The BUY signal appears as a small green triangle below the price bar. ✅ SELL Signal Logic A SELL signal is triggered under the mirror conditions: Price is below the Kumo Cloud, confirming a bearish environment. Tenkan is below the Kumo, supporting bearish momentum. Price makes a bearish cross below the Tenkan within the last 6 bars. The entry candle opens above the Tenkan and closes below it. The candle must NOT touch the Kumo. If the candle touches the Kumo, the indicator waits for the next clean candle that closes below Tenkan without touching the Kumo, then triggers the SELL signal. The SELL signal appears as a small red triangle above the price bar. 🎯 Purpose of the Indicator This version of Ichimoku aims to: Filter weak signals near the Kumo (high-noise zones). Identify clean pullback continuations within trending markets. Provide easy-to-read visual markers and alert conditions for automated setups. Improve decision-making by ensuring both price and Tenkan confirm trend strength before triggering entries. 🔔 Alerts Included The indicator includes two built-in alerts: BUY Signal – Ichimoku Long Entry SELL Signal – Ichimoku Short Entry These alerts can be used directly for automation, bot integration, or manual trading. 📌 Recommended Use Best used in trending markets. Works across timeframes (Scalp, Swing, Intraday, or Daily). Ideal as a primary strategy or confirmation tool.Pine Script® göstergesiStevenLopez tarafından5
Divine Master V18 (Real Money)Key Features: Smart Portfolio Memory: Saves entry prices for up to 20 different assets automatically. Real-Time Options Simulator: Calculates theoretical option price, P&L, Delta, Theta, and Breakeven using the Black-Scholes model. Clean Support & Resistance: Automatically draws and manages the last 3 support and resistance levels to keep the chart clean. Institutional Tools: Includes MA 150 trend filter, Golden/Death Cross detection, and Smart Money Volume filter. Risk Management: Calculates maximum allowed contracts based on portfolio size and risk tolerance, plus a built-in Trailing Stop visualizer. Live Dashboard: A high-contrast HUD displaying all critical data, including Earnings countdown and a weighted Strategy Score (0-100). Perfect for: Traders looking for a "Cockpit" view of their trades, combining technicals, fundamentals, and risk management in one script.Pine Script® göstergesirazielarusiidfrav tarafındanGüncellendi 8
COT Net Positions OTCCOT Net Positions Indicator Description This is a TradingView Pine Script indicator that displays Commitment of Traders (COT) data for any trading instrument. What it does: Fetches COT Data - Uses the TradingView COT library to retrieve official CFTC (Commodity Futures Trading Commission) data for the current symbol Calculates Net Positions for three trader categories: Commercial (Blue) - Large hedging institutions; represents institutional long/short positioning Non-Commercial (Yellow) - Large speculators and hedge funds; often considered "smart money" Retail (Red) - Small individual traders; often considered contrarian indicators Net Position Calculation - For each category: Takes Long Positions minus Short Positions Plots the result on a separate panel below the price chart Special Symbol Handling - Includes custom mappings for specific commodities: Copper (HG) → CFTC code 085692 Brazilian Real (LBR) → CFTC code 058644 Use Cases: Market Bias Detection - See if institutions are mostly long or short Contrarian Trading - When retail traders are extremely positioned one way, often the market reverses Trend Confirmation - Non-commercial positioning often aligns with established trends Support/Resistance - Extreme COT positions can signal market turning pointsPine Script® göstergesifreeman7788 tarafından25
Fast Knife – Volume Spike + Second Entryfast knife entry with volume spike being consideredPine Script® göstergesijaxsoulspa tarafından51
BTC Risk Metric DCA Adapter (3Commas Webhook Strategy)Risk Metric DCA Adapter (3Commas Webhook Strategy) - WORK IN PROGRESS This Pine Script strategy, originally inspired by the Risk Metric Indicator, is fundamentally engineered as an Adapter to interface with external trading bots like 3Commas via Webhooks. It calculates a dynamic market risk score and translates that score into specific dollar-cost averaging (DCA) entry levels and tiered profit-taking exits. Key Features & Logic Risk Metric Calculation (Credit to The Trading Parrot): The strategy incorporates a complex, multi-timeframe Risk Metric calculation based on daily and weekly moving averages (SMA) and standard deviation (StDev). This metric aims to quantify the current market overextension or compression relative to long-term historical data. The resulting score dictates the level of conviction for a new trade. Tiered DCA Entry Sizing: The strategy defines three distinct Buy Levels (L1, L2, L3) corresponding to increasingly favorable (lower) Risk Metric scores. L1 (Base): Risk is moderate, initiating the minimum defined trade amount. L2 (Scaled): Risk is low, initiating L1 amount + L2 amount. L3 (Aggressive): Risk is very low, initiating L1 + L2 + L3 amounts. Tiered Profit-Taking Exits: The strategy implements a staggered, partial profit-taking approach based on the Risk Metric rising: Sell L1 & L2: Closes a percentage of the current position when the Risk Metric reaches defined high thresholds, locking in partial profits. Sell L3 (Full Exit): Closes the remaining position when the Risk Metric reaches the highest defined threshold. The Adapter Function (Webhook Integration) This script is unique because it uses the Pine Script strategy() function to trigger Order Fills, which are necessary to access powerful placeholders in the TradingView alert system. Trigger Type: The alert must be set to trigger on Any order fill. Dynamic Webhook Data: Instead of using fixed alert() commands, the strategy generates dynamic labels (e.g., BUY_ENTRY_L3_USD_1000 or SELL_L1_PCT_25) using the strategy.entry and strategy.close commands. Data Transfer: The alert message then uses the placeholder {{strategy.order.comment}} to pass these dynamic labels to the 3Commas bot, allowing the bot to execute the precise action (e.g., start_deal_with_volume_in_quote_currency or close_deal_at_market_percentage). Full Strategy Webhook payload { "secret": "YOUR_3COMMAS_SECRET_KEY", "max_lag": "300", "timestamp": "{{timenow}}", "trigger_price": "{{close}}", "tv_exchange": "{{exchange}}", "tv_instrument": "{{ticker}}", "action": "{{strategy.order.action}}", "bot_uuid": "YOUR_BOT_UUID", "strategy_info": { "market_position": "{{strategy.market_position}}", "market_position_size": "{{strategy.market_position_size}}", "prev_market_position": "{{strategy.prev_market_position}}", "prev_market_position_size": "{{strategy.prev_market_position_size}}" }, "order": { "amount": "{{strategy.order.contracts}}", "currency_type": "base", "comment": "{{strategy.order.comment}}" } } Disclaimer: This script is an adapter tool and does not guarantee profit. Trading requires manual configuration of risk settings, bot parameters, and adherence to platform-specific setup instructions.Pine Script® stratejisinakphanan tarafından1134
Son 3 Tepe ve Dip IşınlarıGrafikle üzerinde son dip ve tepeleri ışınlarla işaretlerPine Script® göstergesikaracalit4 tarafından81
ICT Smart Money Strategy (Working Version)aegon its based on ict version of mss fvg ob htf biasedPine Script® göstergesiTARGARYENAEGON tarafından79
Cúpula dos gestores 1,0!We present the Opening Bias Indicator, a proprietary predictive intelligence tool developed specifically for Fund Managers, Market Analysts, and High-Frequency Traders who demand a rigorous assessment of market sentiment and direction before the official opening of Wall Street (Dow Jones and NASDAQ). Integrated Analysis of Critical Factors: Our proprietary model transcends traditional technical analysis, robustly integrating a set of macroeconomic and geopolitical variables to generate a highly calibrated directional forecast (High, Neutral, or Low). The methodology is based on reading and consolidating key liquidity and risk-off/risk-on global signals, including: Global Sessions: Evaluation of the momentum and performance of Asian and European markets. Volatility and Risk: Continuous monitoring of the VIX (Volatility Index) as a thermometer of market fear. Monetary Fundamentals: Analysis of the 10-Year Yield Curve (Treasuries) and the strength of the DXY (Dollar Index) as pillars of global capital allocation. Strategic Sectors: Detailed observation of performance and sentiment in the Biotechnology (Biotechs) sector. High-Impact Events: Real-time confirmation of Impactful News and releases that may redefine the operational bias. The Opening Bias Indicator offers an invaluable tactical advantage, allowing capital allocation and hedging strategies to be adjusted with institutional precision in the pre-market phase, mitigating the risk of surprise and capitalizing on the information gap.Pine Script® göstergesiCandleM15 tarafındanGüncellendi 6
Automatic -Market Cycle & Exposure Tracker**Market Exposure Tracker — Visual Cycle & Risk Management Tool** Market Exposure Tracker is a dynamic position sizing and cycle awareness indicator created for traders and investors who want a clear, actionable visual on market strength and risk without complex settings. It is designed to help you confidently navigate trending phases, transitions, and breakouts—tailored to your style. **How it works:** - **Trading Style Selection:** Choose from Intraday, Swing, Positional, or Investor profiles. The indicator immediately adapts to reflect the most relevant cycle signals, so you get information suited to your unique timeframe and decision-making rhythm. - **Cycle Visualization:** Colored histogram bars represent the intensity and persistence of trend cycles. As bullish or bearish moves extend, the bars dynamically adjust in height and shade, giving you immediate at-a-glance feedback about market momentum. - **Breakout Signals:** The first three bars of a new upward phase are highlighted with white dots, making it easy to spot emerging uptrends and breakout points. This intuitive marking system helps you act decisively when cycles shift. - **Risk Management Table:** Stay informed with a streamlined dashboard showing your trading style, the current market cycle, bar counts, and risk suggestions—all designed for fast reference and practical decision support. **Why use this indicator?** - No need for manual configuration: Everything adapts automatically as you select your trading profile. - Quickly identify the start and persistence of bullish and bearish market phases. - Easily spot fresh momentum and breakout opportunities. - Receive visual cues for when to adjust risk and exposure during prolonged trends. - Maintain clarity with a clean dashboard—only showing what you need. This tool is ideal for anyone seeking to add structure, discipline, and visual clarity to trading decisions, whether managing short-term trades or long-term investments. *(This indicator does not provide buy/sell signals or financial advice. Use for informational and educational purposes.)*Pine Script® göstergesitrade_parthib tarafından1
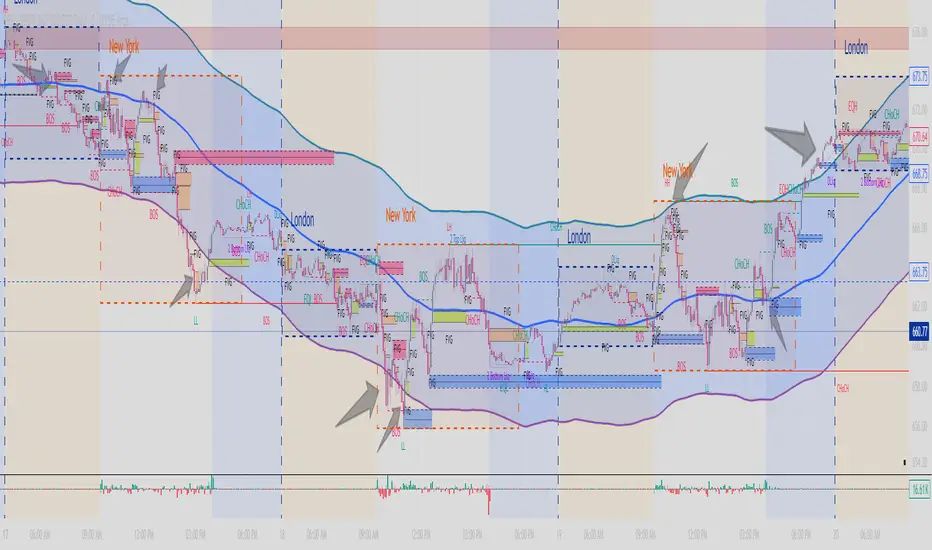
FXG Elite Signals | FXG v2.0.4Reversal Zone Trading With Scalp , Intraday and Swing setups Applicable for M1 Timeframe GOLD Indicator Added Pre Trade Alert SL / TP Alert Trade Cancellation AlertPine Script® göstergesiForexGran tarafından2