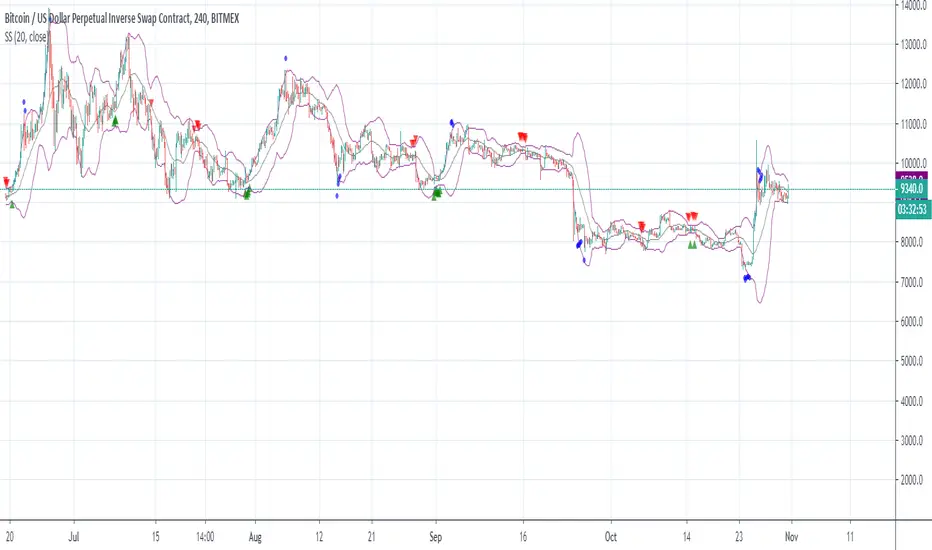
Super Signal - Bollinger BandsBollinger Bands are price channels, or bands, that are plotted above and below price. The outer Bollinger Bands are based on price volatility, which means that they expand when the price fluctuates and trends strongly, and the Bands contract during sideways consolidations and low momentum trends. By using a combination of several indicators, we try to predict the direction of a large price movement when the Bands are compressed and the market is in a consolidation period.
To use the indicator:
Go long on the green arrows.
Go short on the red arrows.
The blue circles give a clear indication of when a trend has ended.
Bollinger Bantları (BB)
Bollinger Bands Candle Close Outside ImmediateThis study can be used to set alerts whenever a candle closes outside the BBand. This 1 can get a bit spammy since you will get an alert for multiple consecutive candles at times.
The signals are there to be used for manual trading as more of an alert of extreme price movement to an area of interest where a potential trade might be available.
My recommendation is to use this on HTFs only, 4H or higher.

Bollinger Bands Candle Close Outside Delayed IndicatorThis study can be used to set alerts when a candle closes outside the BBand and the following candle closes inside it. Alert will be generated on the inside candle. Consecutive outside BBand closes won't generate any alerts.
The signals are there to be used for manual trading as more of an alert of extreme price movement to an area of interest where a potential trade might be available.
My recommendation is to use this on HTFs only, 4H or higher.

HLC Bollinger BandsThis is just a Bollinger band indicator that uses the highs & lows in addition to the close in the calculation of volatility / deviations from average. These bands will be slightly wider than regular Bollingers as a result.
I've found it useful with very short lookback lengths (3 to 5) for identifying periods when the bands are contracted... usually leads to an expansion of volatilty, so good for scalps.
Enjoy.

R100 Volatility Combo Bands v1 (*v*)The Volatility Combo Bands are made from 4 separate volatility bands- two Bollinger Bands (10 and 20 period) and two Price Headley Acceleration Bands (10 and 20 period). The Volatility Combo Bands plot the innermost upper and lower points from these bands and then plots a mid-line. By default, only the standard 20 period Bollinger Bands and Combo Bands with mid-line are displayed, but can be configured however you want.
Try it out- see squeezes earlier, ride the bands earlier in trending markets, trade pullbacks to the Combo Bands and mid-line, trade the range of the band or use them to help identify potential support and resistance levels. Hopefully they can add another dimension to identifying volatility contraction patterns or whatever you currently use these things for!
I hope you get some value out of it. Only conditions of use are that if you improve it, let me know and if you publish something that uses it, don't hide the code! Enjoy!
Code for the Price Headley Acceleration Bands pinched and modified from LazyBear - thankyou.

Multi-time RSI and BBFirst of all the main idea of this script is from Mr.sixamo who is one of the most talented technical trader in Japan.
For the purpose of creating this script is to support scalpers or traders who are planning to trade within one day, so Multi RSI and Multi BB show current leg, 15 min leg, 60 min leg, and 240 min leg values. Due to the limitation of pine script, both script should be applied only current leg or longer. Therefore, for example, when you open 60 min leg chart, only current min, 60 min, 240 min leg value will be shown and this logic cannot be changed never until pine will be upgraded.
Anyway, I hope this will be helpful for all of short-term trader.
HAVE A FUN!


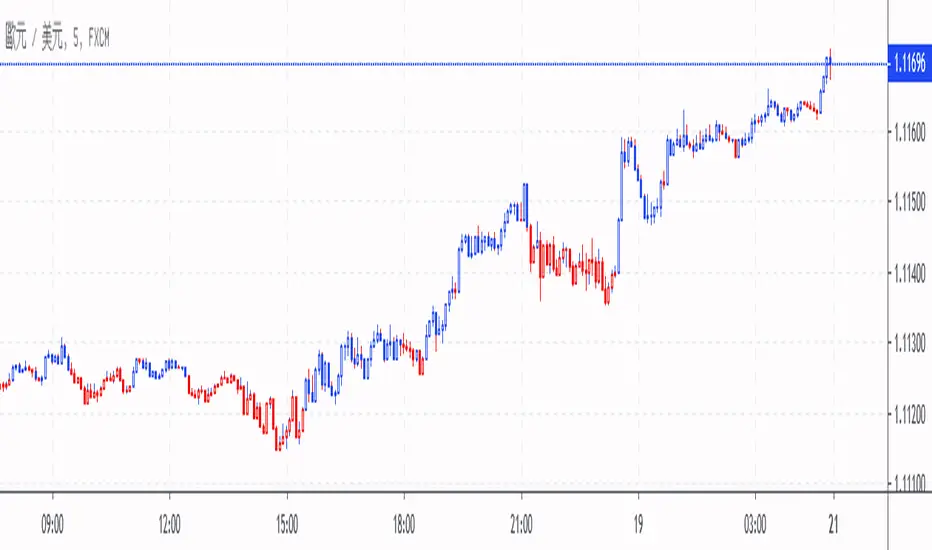
[LunaOwl] 反轉模式 (Bollinger %B Reversals)This is a tool using the Bollinger %B and Arnaud Legoux Moving Average (ALMA), it is a reliable tool for trading price action reversals.
腳本使用布林%B和ALMA,是一個可靠的逐棒分析反轉工具。
1. 英鎊兌美元 GBP / USD, 5 min
2. 美元兌日圓 USD / JPY, 5 min
3. 美元兌離岸人民幣 USD / CNH, 5 min
4. 日本 Sosei 生物製藥株式會社 Sosei Group Corporation, 5 min
5. 比特幣永續 Bitcoin for BitMEX, 5 min
6. 瑞波幣兌比特幣 XRP / BTC, Poloniex, 1 hour
7. 比特幣主導比率 Bitcoin Dominance Index, 4 hour
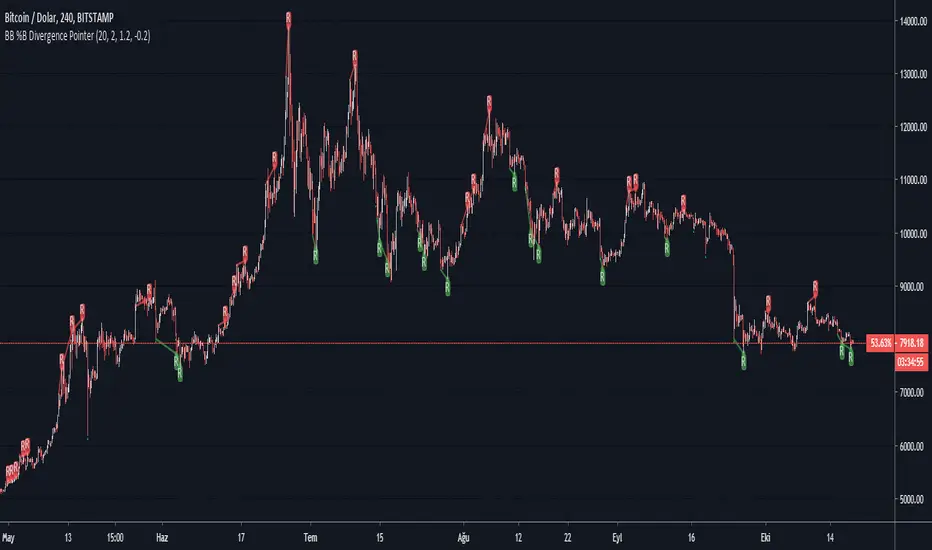
BB %B Divergence PointerThis script points regular and optionally hidden types of bullish and bearish Bollinger Band %B divergences on the chart by drawing the divergence lines and optionally labels.
Hidden divergence is disabled by default, it can be enabled over settings window.
Regular divergence is enabled by default, it can be disabled over settings window.
There is an options to display the price channel , bollinger band , Oversold and overbought levels additionally.
Supports alerts for all types of divergences.
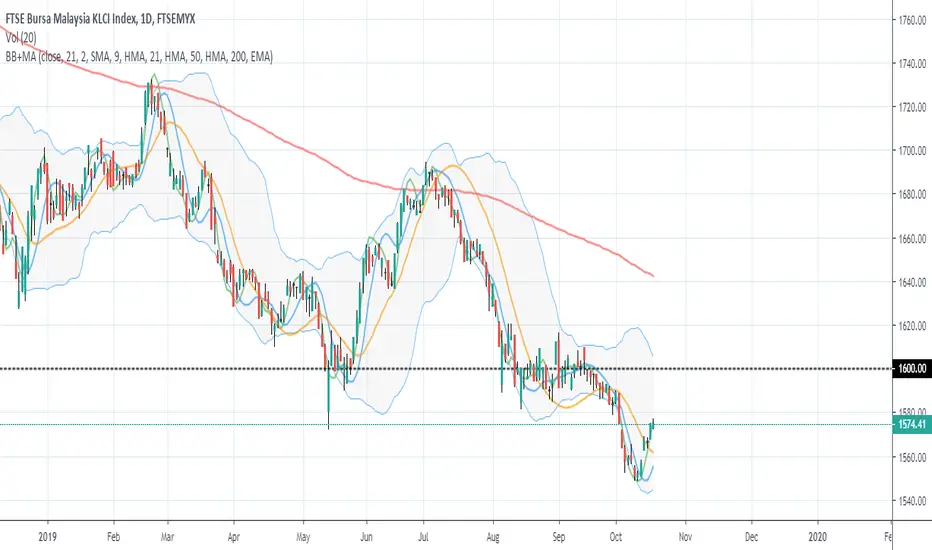
Bollinger Bands + Moving AveragesCombination of Bollinger Bands and 4 Moving Averages in one indicator.
The smoothing algorithm for the Bollinger Bands basis line and each of the Moving Averages can be chosen from either SMA , EMA , WMA , RMA, or HMA .
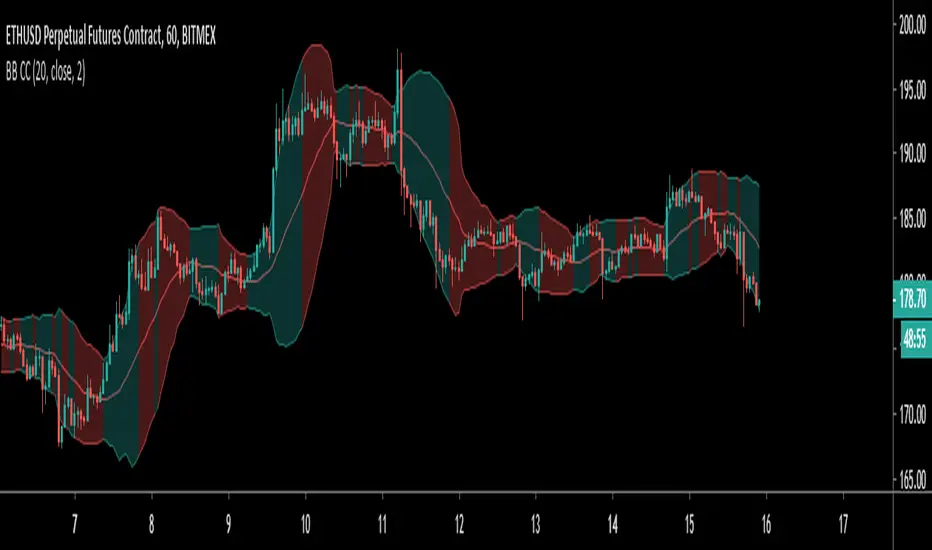
Colour Coded Bollinger BandsBollinger Bands coloured to more clearly show periods of contraction and expansion. Green filled bands indicate expansion/increasing bandwidth, and red fill indicates contraction/decreasing bandwidth.
Multi Timeframe Bollinger BandsMulti Timeframe Bollinger Bands:
This script calculates and displays the Bollinger Bands for three different timeframes. The timeframes, moving averages and sigma values can be adjusted to personal likings. I publish this with an open visibility, feel free to tinker with it or suggest improvements.
Enjoy,
s0ullight

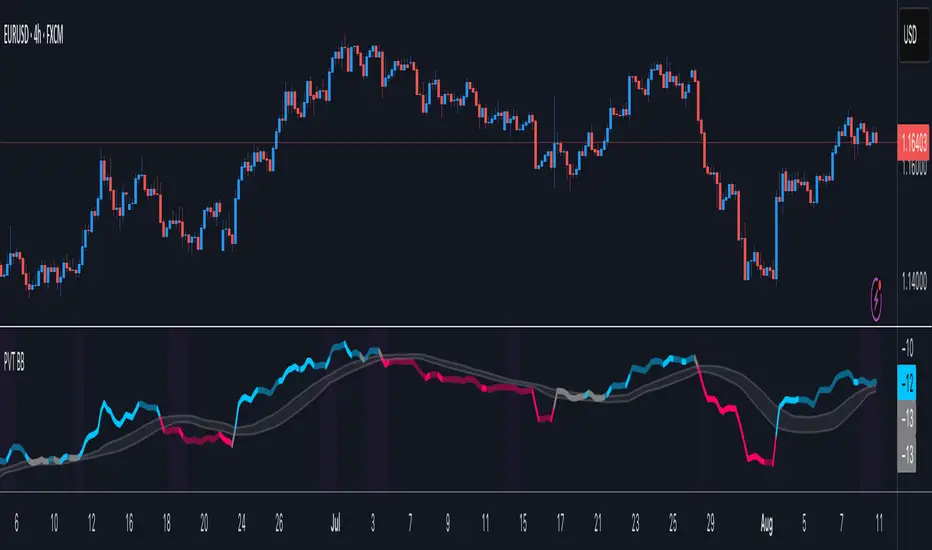
Price Volume Trend BBHey guys,
Ive been thinking about Price Volume Trend for a while and tried adding different moving averages to it, but seems its not as binary.
Therefore adding the bollinger bands as a no-trade-zone made it alot better. Indicator is pretty basic at the moment since I just implemented the idea but im planning to do some add-ons later on to make it easier to read.
Will keep you updated!
That One Indicator (Free) - [Backtester]This Backtester comes with the following indicators:
Bollinger Bands
ADX
Moving Average Trend Confirmation Filter ( EMA , SMA , DEMA , TEMA , WMA , VWMA , SMMA , HullMA, LSMA , ALMA , SSMA, TMA, ZLEMA )
And a few more indicators in the back-end to increase accuracy
This strategy works really well as a scalper on lower Time Frames as well as on higher Time Frames. Besides that you can also trade it on pretty much any coin or asset.
The alerts script is not repainting. We advise to use alerts on “Once Per Bar Close”.
If you’d like to automate this strategy you can do that by using our alerts script with AutoView, ProfitView, ProfitTrailer, CryptoHopper etc.
Alerts are set very clearly as Long and Short to avoid confusion.
Feel free to leave a comment and share it with your friends.

5 Bollinger Heat Bands - EMA/Breakout OptionsBollinger Bands are a technical analysis tool, specifically they are a type of trading band or envelope . Trading bands and envelopes serve the same purpose, they provide relative definitions of high and low that can be used to create rigorous trading approaches, in pattern. recognition, and for much more.
The uniqueness in these bands is that you can enable the breakout alerts and even change from the basic sma bollinger bands to ema bands. The application of 5 bands is unique to certain strategies.

Dependent Variable Odd Generator Risk Detector
In fact, I wrote this script for detect Bollinger and Linear Regression Bands squeeze.
It's a side script.
Logic works like this:
Only the stagnant market probability is drawn from the Bollinger bandwidth by Dependent Variable Odd Generator and MFI index is calculated taking into account the volume.
This value ranges from 0 to 100.
To be sure, this value is averaged over a small period.
If you break the average and exceed 50, the bollinger band is too narrow and the risk is too high.
This means more commissions, more transactions, and vain work.
Or, when in position, the warning is not ignored due to unnecessary signals.
This code is open source under the MIT license. If you have any improvements or corrections to suggest, please send me a pull request via the github repository github.com
Stay tuned , best regards.

InfoPanel Indicators microtrendThis panel shows current value and trend of some well knonw indicators. It may be usefull because you have all indicators in one panel only.
thanks to: RicardoSantos for his script of panel coding
Tradingview scripts
Please use comment section for any feedback.

My Recursive Bands [ChuckBanger]This is a different type of bands. I modified Alex Pierrefeu Recursive Bands algo. It is a smoothed version of Alex's algo and imo it suites better for heikin ashi candles but it works well with regular candles.
How to use it:
When price hugs the upper band. It is a potential long and when price hugs the lower band it is a potential short.
Credits to Alex Pierrefeu: figshare.com

Double Bollinger BandsOn fundamentally strong stocks for entry points. The area in the Gray lines is the best one to enter and reasonable valuation. The area in the Red lines indicates higher Valuation. The area in the Green lines indicates lower Valuation and better to be careful and avoid.

inwCoin BB Break Risk% Strategy.=========================
English
=========================
Simple yet effective strategy
when Bollinger Bands squeeze tight, the next thing will be the explosion of price in any direction.
This proven profitable if you choose to play long only.
BB Break and close above previous value = buy
Price crossunder basis line = sell
==========================
Thai
==========================
bollinger band strategy โดยใช้หลักการที่ว่า
ถ้าราคาปิดเหนือ หรือใต้ BB ก็ให้ออก position ไปในทางนั้น ( ปิดเหนือ ออก long ปิดใต้ออก short )
โดยจะทำการปิด position ถ้าราคามา cross เส้น basis ( เส้นกลาง MA20 )
เท่าที่ Backtest ได้ผลลัพธ์ที่ค่อนข้างน่าพอใจครับ
เทรดไม่มาก แล้วก็ได้กำไรพอสมควร ( แต่ก็สู้ buy & hold ไม่ได้อยู่ดี แต่เราเล่นแบบคุมเสี่ยงไงครับ 55 )

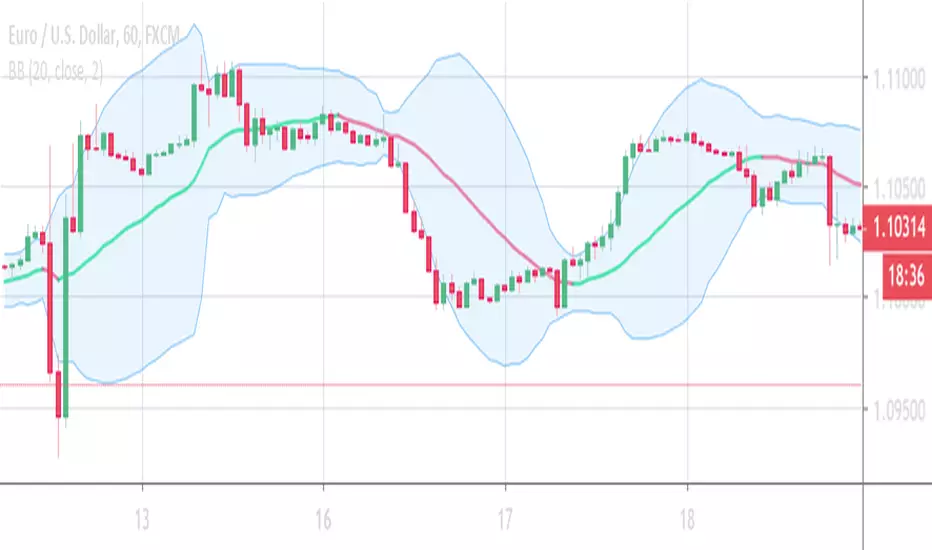
Bollinger Bands Changing ColorOriginal Bollinger Bands but the basis line changes color when the slope is positive or negative
If slope is positive the color is green (or lime)
If slope is negative the color is red
If slope is flat the color is black

Breakout Notifier LONG NEW with wicksBreakout script with few changes that considers wick to close trades instead of using candle body like in the previous version
