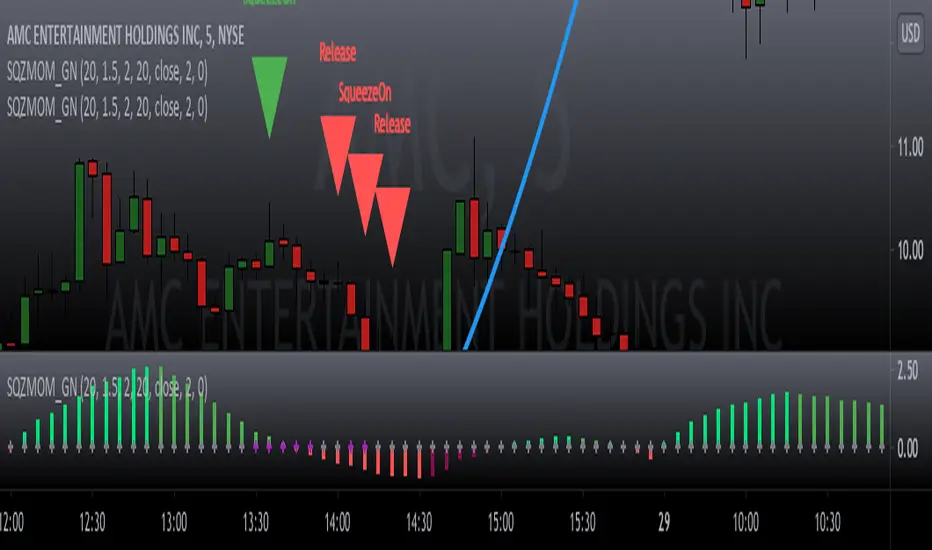
Squeeze Momentum Signal Overlay [GN]Companion script for Squeeze Momentum Indicator that plots the signal on chart.
Bollinger Bantları (BB)

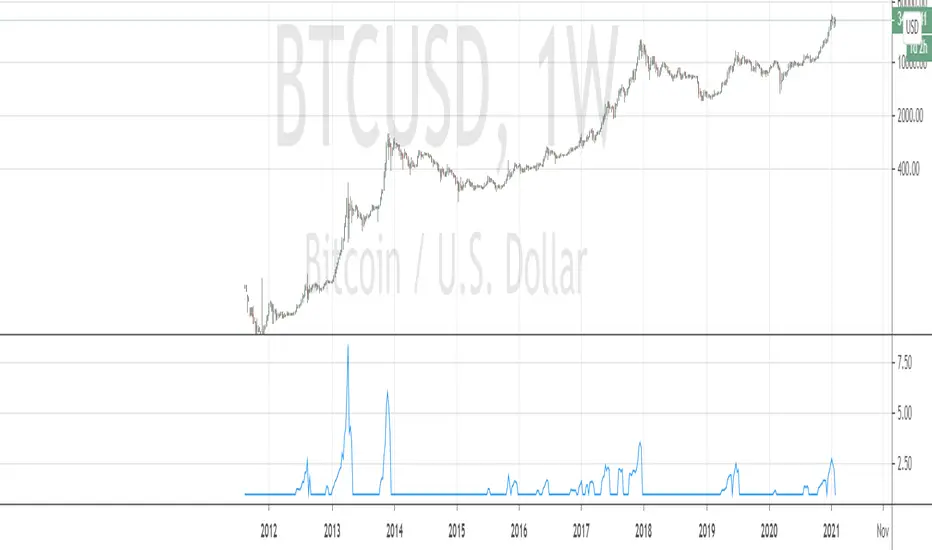
Bitcoin Bubble Strength IndexFor those who interested, here is a Bitcoin Strength Index source code. I used it on weekly chart with params (close,28). And only with Bitcoin . And only during bull run. It shows how far price went off the particular moving average during bubble run (i.e. being above BB). Weekly MA 28 is approximately daily ma 200.
The physical meaning of this indicator is to show current bull rally "speed".
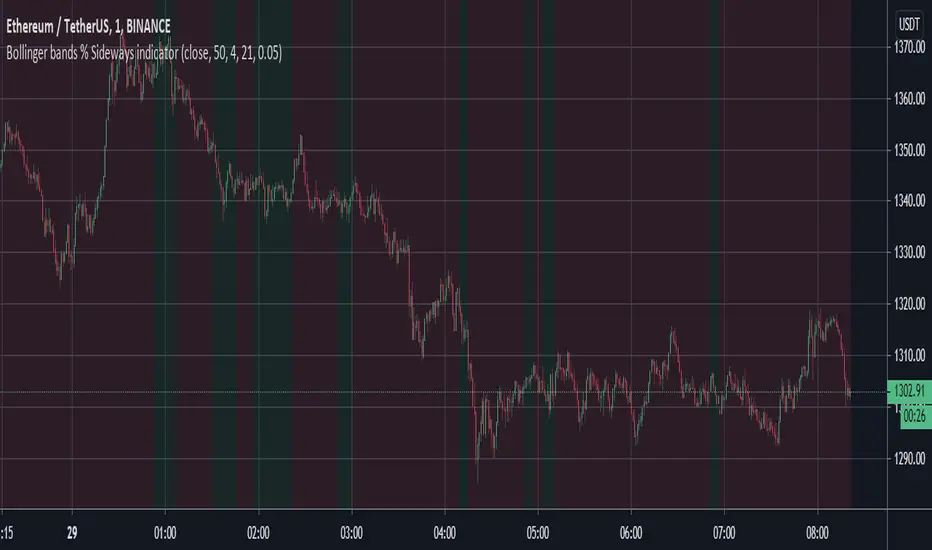
Bollinger bands % Sideways indicatorDetect sideways markets (green background) vs. trending markets (red background) with this indicator. It makes use of the Bollinger bands % as its base.
RSI + Kijun/Standard Deviation on RSIThe script is inspired by Bollinger bands but instead of applying them on the price, they are applied on a RSI oscillator. The standard deviation is not plotted against the average like in normal BBs but instead is based on median values (equivalent of a Kijun in Ichimoku ). The goal is to better identify excess in prices that offer good entering points. The usage of a median provides a clearer view of ranging market (ie. the line will be flat).
I use it for long-term investments on stocks to find "fair" entry points. After picking a list of stocks of interest based on fundamentals, I switch to a weekly view. If the stock RSI is under the bands, it indicates that we are in favorable conditions for a buy. For an accurate timing, you can switch to the daily chart and watch out for either a break or a reintegration in the bands. This is your signal.

Relative Channel BandwidthThis indicator uses different volatility channels - Bollinger Band, Donchian Channel and Keltner Channel width to measure volatility.
Indicator plots channel bandwidth percentage with respect to close price.
This is not same as Bollinger Percent B - which is measure of where price is with respect to band. Instead this indicator is similar to ATR Percent indicator published here:
Plotting is color coded to indicate volatility zone:
Red : Extreme volatility
Orange : High volatility
Lime : Low volatility
Green : Extreme low volatility
These levels are again derived by long period bollinger bands

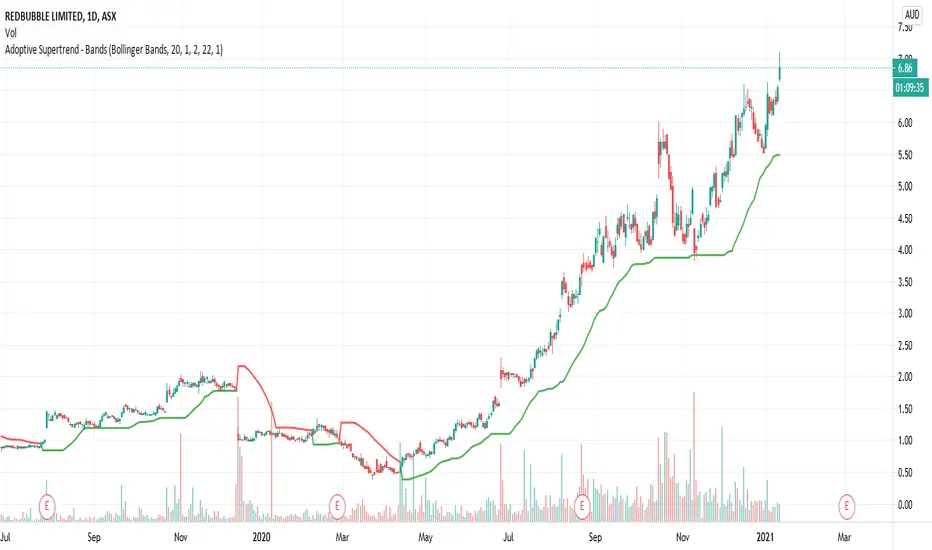
Adoptive Supertrend - BandsAnother adoption of supertrend. This time based on different channels - Bollinger Band, Keltner Channel, Donchian Channel and Pivot point based Donchian channel.
When price hits top of bands, it is considered as start or continuation of uptrend. When price hits bottom of the band it is considered as start or continuation of downtrend. Hence, supertrend is drawn based on these calculations. Use ATR Periods and ATR Multiplier to create stops certain ATR away from band's top and bottom.
Other supertrend adoptions published are here:
Pivot point based donchian channel is published here:
Modified Smoothed Heiken AshiThis code is based on Smoothed HA candle which will work on all chart types
condition for BUY:
1. When close crosses Smoothed HA
2.Close should be in side upper band
3.BBW must be greater than the average
vice versa for sell
this code takes data from HA chart so that it can be applied on all chart type.
Bollinger band and Bollinger band width conditions added for removal of unwanted signals
Alert added so that you can apply alert and check it in real time performance
thanks to The Secret Mindset You tube channel from where I got the idea to convert this into a pine script indicator
smooth HA taken from "Smoothed Heiken Ashi Candles v1" at //@jackvmk

Donchian DipThe Donchian Dip
This strategy is designed to look for good "Buy the Dip" entries on stocks that are clearly in a strong 1-year upward trend. If you do not know how to identify those stocks on your own please do not use this system or continue your education until you do. The Donchian Dip strategy was designed on the daily time frame but works amazingly well on both daily and weekly timeframes. It does still work on intraday charts also if the current trend on the daily chart is in a strong uptrend.
Chart Setup:
3-period Donchian Channel with a 1-period offset (hide basis)
Bollinger Bands with the default settings of 20/2 (display basis)
Entry Signals:
There are 3 different entry signals that will be printed on the chart that have similar underlying criteria but are ranked based on skill level just like ski slope skill levels! I recommend only taking green entries until you are familiar with the system and the stocks you are trading.
Green Easy Entry:
This is the safest buy the dip entry that is normally found at or near a large retracement bottom. You might get one or two bad entries but be persistent and eventually, a great entry will present itself!
These are the specifics for the conditions that trigger a Green entry if you want to know what they are:
1. The current bar is an up bar (green or white bar) and closed above the lower Donchian channel
2. Previous bar or 2 bars back closed below the lower Donchian channel
3. Previous bar or 2 bars back closed below the Bollinger Band Basis (20 SMA )
4. The low of the previous bar or 2 bars back was below the lower Bollinger Band
Blue Intermediate Entry:
This is a decent entry if you missed the green entry, want to add to an existing position, or are not sure it will pull back far enough to even give a green entry. I would suggest only trade these entries to add to an existing pyramid position or get back into a trade that you were recently stopped out of. However, on high-flying stocks like TSLA these signals and the Black Diamond entry signals might be the only ones you get for a long time. Also, on the weekly chart, Blue or Black entries are sometimes all you will get for a year or more.
These are the specifics for the conditions that trigger a Blue entry if you want to know what they are:
1. The current bar is an up bar (green or white bar) and closed above the lower Donchian channel
2. Previous bar or 2 bars back closed below the lower Donchian channel
3. Previous bar or 2 bars back closed below the Bollinger Band Basis (20 SMA )
Black Diamond Advanced Rule:
This is normally just a small pullback re-entry signal on a strong trending stock like TSLA ...trade with extreme caution!!! You have been warned but daredevils feel free to give it a shot. I sometimes do trade these entries if the market and sector of the stock I am trading are extremely bullish or if I am looking to add to a position but I use a conservative stop.
These are the specifics for the conditions that trigger a Black entry if you want to know what they are:
1. The current bar is an up bar (green or white bar) and closed above the lower Donchian channel
2. Previous bar or 2 bars back closed below the lower Donchian channel
3. Previous bar or 2 bars back closed above the Bollinger Band Basis (20 SMA )
Exit Criteria:
The goal of this strategy is to buy the dip and hold as long as possible...let's practice some Paytience and exercise those holding muscles! RLT!!!
So, we don't want to exit early but we also want to protect our profits somehow. We do this by using the built-in trailing stops that are defined by dots of three different shades of purple on the chart (feel free to change these in the settings). Simply move your trailing stop to the highest current dot price level. Do not move the trailing stop down ever even if a lower dot is printed later. These are simply the suggested trailing stops and definitely use your own judgment for exits but if you backtest this strategy enough you will most likely discover that in the long run, these trailing stops work really well.
I hope this strategy helps you to identify good "Buy the Dip" entries on stocks you love as well as trains you to hold your winners longer for bigger gains.
***HOW TO ADD TO YOUR CHARTS***
1) Click the "Add to Favorite Scripts" button
2) Go to a stock chart and click the "Indicators" icon at the top
3) Next, on the left, click the "Favorites" and then click the "Naked Put - Growth Indicator v2"
4) It should appear on your charts, and you can click the "gear" icon on the study to edit a few settings.
5) Read the release notes above so you understand how it works.

rocketLaunchI wanted to see if I could programmatically identify the conditions I saw just before Bitcoin broke its all-time high end of 2020. The signal picks up several rocket launch moments prior to launching which is quite cool. It also picks up a few false starts, however. In any case, I would have loved to be stopped out on those false starts but been there for all the starts this thing picks up.
It could probably use more confirmatory elements such as trailing conditions and volume perhaps?
BINANCE:BTCUSDTPERP

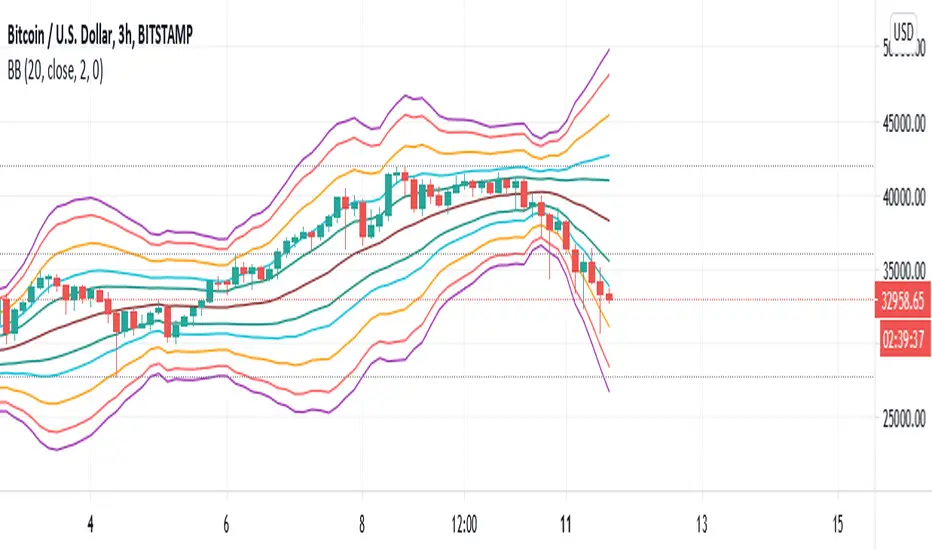
Bollinger Bands Fibonacci Ratio Standard Deviation LINESHello Traders.
in this script, Bollinger bands are made based on a standard deviation with respect to Fibonacci ratios. I hope you can be satisfied. If you are satisfied with this script, please like and feel free to share your comments with me.
Teal Upper and Lower B-Bands = 1.0 Standard Deviation
Aqua Upper and Lower B-Bands = 1.618 Standard Deviation
Orange Upper and Lower B-Bands = 2.618 Standard Deviation
Red Upper and Lower B-Bands = 3.618 Standard Deviation
Purple Upper and Lower B-Bands = 4.236 Standard Deviation
you can use this indicator by clicking the button (Add to Favorite Scripts) and then add it to your chart from (Fx) section.
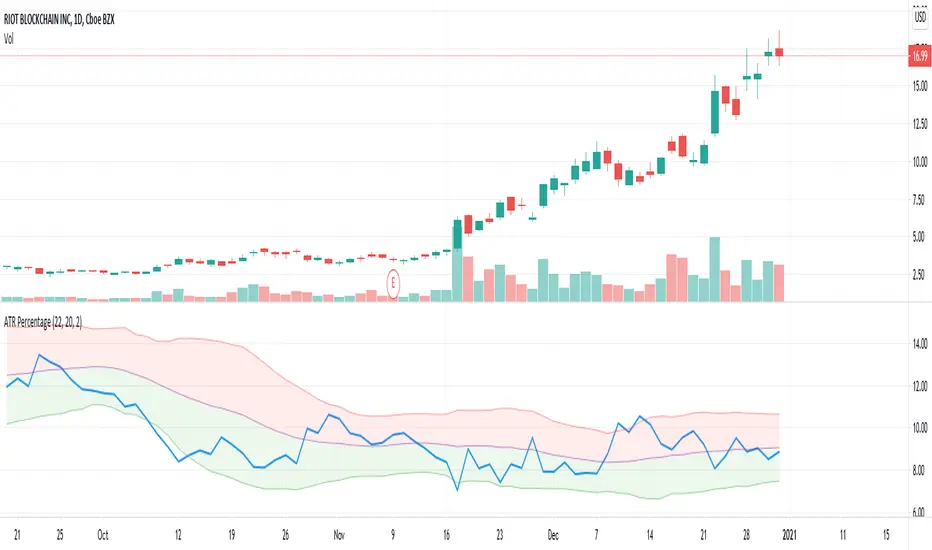
ATR PercentageThis indicator plots ATR as percentage of close price. Also applying bollinger bands on it to visualize it is relatively high or low.
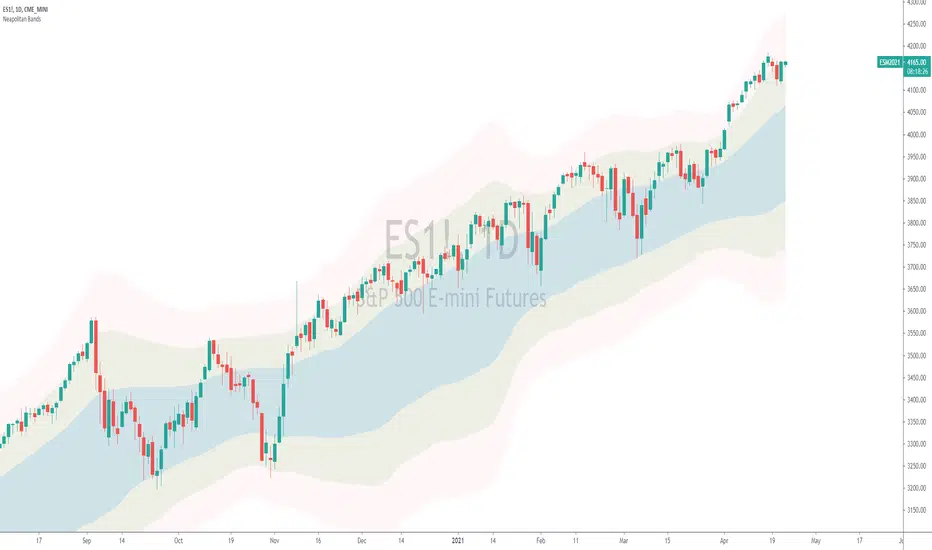
Neapolitan BandsThe Neapolitan Bands were derived from Jean Marc Guillot's 2001 IFTA trading strategy. In his study published by the International Federation of Technical Analysis titled, "Using Indicators from the Derivatives Markets to Forecast FX Moves" Guillot utilizes multiple bollinger bands of various deviations to determine trends and reversals, entries and exits. I isolated this particular part of his overall trading strategy because it has been a useful trend following indicator for me.
Some basics:
Neapolitan Bands can help identify points that a trend starts and ends, as well as reversals when price is ranging.
These bands are typically paired with another indicator like Guillot did to help separate/time trend or reversal signals. (He used MACD, Slow Stochastic, and RSI)
Parts of this indicator:
The period is by default 55 to identify "intermediate" trends. Not short or long term ones.
The blue area shows the 1st standard deviation. This is the "normal range" where price "likes" to be.
The green area shows the 2nd standard deviation and identifies/defines trends. Closes in this area are used for entering trends long or short.
The red area shows the 3rd standard deviation that shows either a spot to take profit/enter a reversal trade, or a point where the market is free falling.
Trend trading rules:
Entry and exit signals for trends are based on price closing above and below the 1st standard deviation, or blue area. If you expect a bullish trend, you buy once price enters the upper green area.
Guillot recommends setting a stop loss to the MA period of the Neapolitan Bands. So if it's 55 periods, you set the stop loss at the 55 SMA.
Reversal trading rules:
For reversals Guillot says, "In a trading range, bands act as supports and resistances. In extreme conditions reversals can occur within or past the 2nd standard deviation." For us, this means that technically anywhere in the green or red areas, a reversal can occur when the price is ranging. Typically this happens at the edges of the bands.
The "edge to edge" trade:
This is a strategy I took from Ichimoku Clouds and applied to the Neapolitan Bands. An "edge to edge" trade is when price closes back into the blue area from one edge, and price travels all the way to the other edge of the blue area. This can apply going from the edge of one green area to the other edge.
Note that this is one piece of Guillot's trading system, and not the whole thing. On top of that I have modified the original parameters to suit the function of trend following, and added an extra bollinger band. Using a shorter period like 20 is more optimal for shorter expected trends or reversals, and it's what Guillot used himself.
Thanks to Sean Nance for reminding me the indicator looks like ice cream! ( coming up with the name :P )
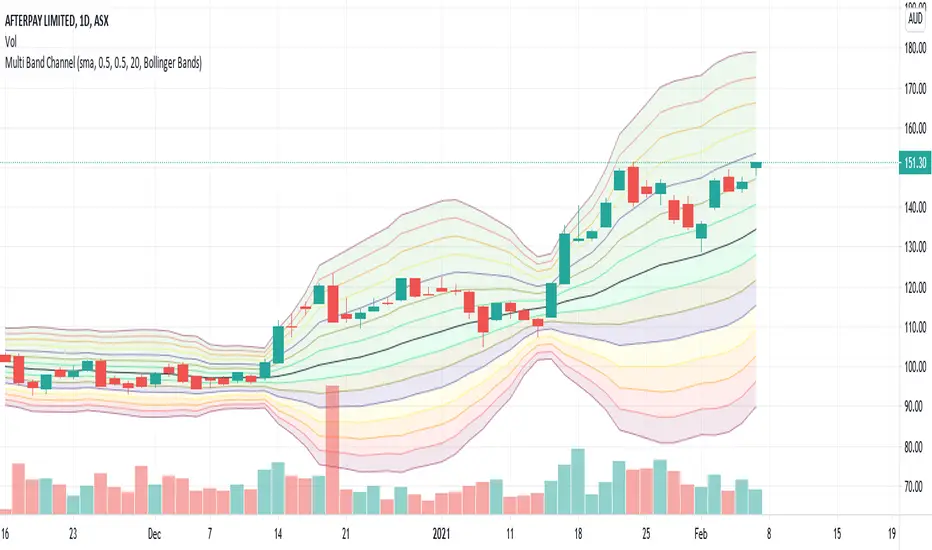
Multi Band ChannelPutting multiple bollinger bands/keltener channels together helps visualize the relative price movement. I have also used this in my BuyTheDip V2 strategy to measure dip and bounce back. 7 Standard deviation is used here. These are calculated based on the input fields StdDevStart and StdDevStep .
Overnight Bollinger Band ExtremesThis script is a combination of my overnight fakeout script and bollinger band color bars. It's designed to be used on CME/CBOT Equity Indexes during their GLOBEX session. It uses the built in Bollinger Band script and highlights bars that exceed the upper/lower bands during the overnight session.

(JS) VWAP BandsThis is a pretty simple script here - I took the VWAP and combined it with Bollinger Bands.
The bands can vary a lot based on chart resolution, so I wanted to make sure the resolution could be modified so you can use the resolution you're most comfortable with, or find the most success with.
Length:
Length of bars used to calculate the bands.
Standard Deviation Band 1-3:
There's three bands all together, this option allows you to modify the number of standard deviations per band.
VWAP Period:
This modifies when you want the VWAP to begin (Session, Week, Month, Year).
Offset:
This moves the VWAP and the bands the amount of bars you select, default is of course set to zero.
Source:
This selects the source of calculation, HLC/3 is the default VWAP calculation.
This is a pretty self explanatory script, I thought being able to see the standard deviations of the VWAP could prove to be useful - hope you all like it!

Cosmic BB SRThis script is based on Bollinger Bands/Bandwidth data and displays support and resistance levels (thick horizontal lines), the direction/volatility of the levels (thin dynamic lines), and the testing of the levels (cross markers).

Bollinger Band Color BarsThis is a simple addition to the built in Bollinger Bands script. All it does is replaces the traditional plotting of Bollinger Bands with color bars.

Mean Reversion Channel - (fareid's MRI Variant)Description :
Mean Reversion Channel objective, based on Mean Reversion theory ( everything has a tendency to revert back to its mean), is to help visualizing:
Inner Channel -> Dynamic Support and Resistance
Outer Channel -> Overbought/Oversold Zone which may signal consolidation phase or potential reversal due to unsustainable move
Details on some of the filtering type used for mean calculation can be read in Ehlers Technical Papers: "Swiss Army Knife Indicator" and/or his book "Cybernetics Analysis for Stock and Futures"
Disclaimer:
These study scripts was built only to test/visualize an idea to see its viability and if it can be used to optimize existing strategy.
Any ideas to further improve this indicator are welcome :)

Exponential Deviation Bands Width [ChuckBanger]This indicator is a compliment to Exponential Deviation Bands . It is the difference between the upper and the lower bands divided by the middle band. It is an easy way to visualize consolidation before price movements or periods of higher volatility.
How it works
During a period of high volatility, the distance between the two bands will widen and Exponential Deviation Bands width will increase. And the opposite occurs during a period of low volatility, the distance between the two bands will contract and Exponential Deviation Bands width will decrease. Meaning there is a tendency for bands to alternate between expansion and contraction.
When the bands are relatively far apart, that is often is a sign that the current trend is ending. When the distance between the two bands is relatively narrow that often is a sign that the market is about to initiate a bigger move in either direction.

MA ICHI BB [Rogulabo]3 indicators in 1.
Included Indicators are:
- MA 5,25,50,100,200
- Ichimoku
- Bollinger Band
These can be used to determine changes in trends when:
- MA's collide, trajectories shift, or certain levels are reached.
- Ichimoku cloud is above or below the candles.
- Bollinger Band's width changes, or range is broken.
Reasons for 3 in 1 assembly:
This indicator is intended to be used by students, and followers of Dan Takahashi
(a prominent educator of investing in Japan who is also a user of TradingView) .
Those who wants to use and learn with the same setup as Dan, would greatly benefit from this since,
the complex setting up process which can be a pain for beginners can be skipped with a simple click.
Every stylistic choice of color and placement were made to make it similar to the chart used by Dan.
Simple customizations are available such as:
- Changing color
- Changing the values
- Hide/show controls
Notes:
This is intended to be used alongside “CC RSI” for the complete the setup.
Any questions, please refer to:
@rogulabo
==
高橋ダンさんが使用されてるチャートと同様のセットアップの為にご活用ください。
複数のインジケータをグループにしておりますので、無料版を使われてる方は効率よく使っていただけると思います。
また、“CC RSI ”どいうタイトルのインジケータも同時に公開しておりますので、セットアップを完成させたい方はこちらもご活用ください。
以下のインジケータを含みます。
・MA線
・一目均等表
・ボリンジャーバンド
カスタマイズされたい方はご自由に値を変更ください。
ご質問は @rogulabo までよろしくお願いいたします。

CSPDMost Advanced & Accurate CandleStick Pattern Detector
Looking All Over of All Markets for All Important Powerful Reversal | Corrective Patterns (25 type)
Filtering the Results with Optional Features like Oscillator, Bollinger Bands, Volume Confirmation, Prior and Following Candles Confirmation which are Fully Customizable.
With this you can detect:
Hammer | Shooting star
Inverted Hammer | Hanging
Long legged Doji | Dragonfly Doji | Gravestone Doji
Bullish tweezers | Bearish tweezers
Bullish inside bar | Bearish inside bar
Bullish three line strike | Bearish three line strike
Bullish engulfing | Bearish engulfing
Piercing line | Dark cloud cover
Bullish abandoned baby | Bearish abandoned baby
Morning star | Evening star
Three white soldiers | Three black crows
*Bullish kayo | *Bearish kayo
Features:
Prior and Following candles Confirmation
You can set prior and following candle as basic prerequisites for marking candles as pattern to make sure you are at the top or bottom of the trend.
Volume confirmation
You can active volume increasing confirmation for some of pattern with adjustable increase % relative to prior candle | candles.
Oscillator Confirmation
Active oscillator confirmation. Select your approved oscillator from list (Stochastic, RSI, StochRSI, MFI, StochMFI) then enter desired value for marking candles as bullish | bearish pattern.
Bollinger Bands Confirmation
Active BB confirmation. Configure your Bollinger Bands. Now only see the patterns which reached or crossed from Bands. Also you can enable BB clod to have your BB indicator at the same time.
Adjustable Flexibility and Precision
You can set tolerance% for Osc and BB Confirmation - each one separately - for more control.
Self-adaptability
The properties of markets change over time, for example the amplitude of fluctuations and the intensity of movements. The script is designed in such a way that you can examine the price history as a benchmark for changes in market properties to adopt determinants. Also you can control those manually.
Self-regulatory
The user has the ability to change input factors depending on their point of view.
Behind the pattern recognition algorithms, there are relationships and similarities in their appearance that cause them to be influenced by each other. Simultaneously with changing the determining factors of each pattern by you, script automatically adjusts other details in accordance with your changes.
Alerts
You can set for type of pattern or each one of pattern have been detected.
Fully Costumizable
All of these options can be change and adjust.
Note 1.
The patterns are based on extensive study of reference and famous sources and the experience of me and my friends in trading and analysis with price action methods.
Note 2.
Due to the Pine limitations in the number of outputs | plots for each script, our attempt has been made to select the best and most important patterns.
Note 3.
So far, many scripts have been written in this field, but our experience with all of them and even the build in version was not satisfactory, and this was the initial motivation for making the script.
We strive to improve progress and elimination of shortcomings and we will continue to make this better.
Note 4.
Through personal experience and based on the principles of market and candlestick psychology, we discovered a new type of pattern and named it as Kayo.
kayo is a two candle pattern which formed when:
1.We have a pivot point with prior candles as left bars and following candles as right bar. Pivot candle called as second candle.
2.In a bullish kayo, first candle must closed descending and second candle must closed as ascending. For bearish kayo vise versa.
3.In a bullish kayo, second candle's lower wick must be longer then upper wick.
4. A pattern marked as kayo when its conditions do not correspond to any of the other patterns(include the confirmation that user added), ie it has the last naming priority over the other patterns.
Note 5.
When you active confirmation options for patterns like hammer, engulf and etc which they conditions are like kayo in some extent, if they can't pass the confirmation steps, they can be marked as kayo pattern.
Note 6.
If you active volume confirmation for Three white soldiers | Three black crows, the confirmation get passed if the volume of forth or third candle increased as value as entered relative to volume EMA3 of 3 candles.
Note 7.
In a bullish pattern all highs of following candles MUST be higher than prior highs and all lows of following candles MUST be higher than prior lows. For bearish patterns vise versa.
This type of confirmation depends on High and Low NOT close!
Gift to price action lovers!
Support us with your like and comments. let us know your experience, points and idea to make this better together.

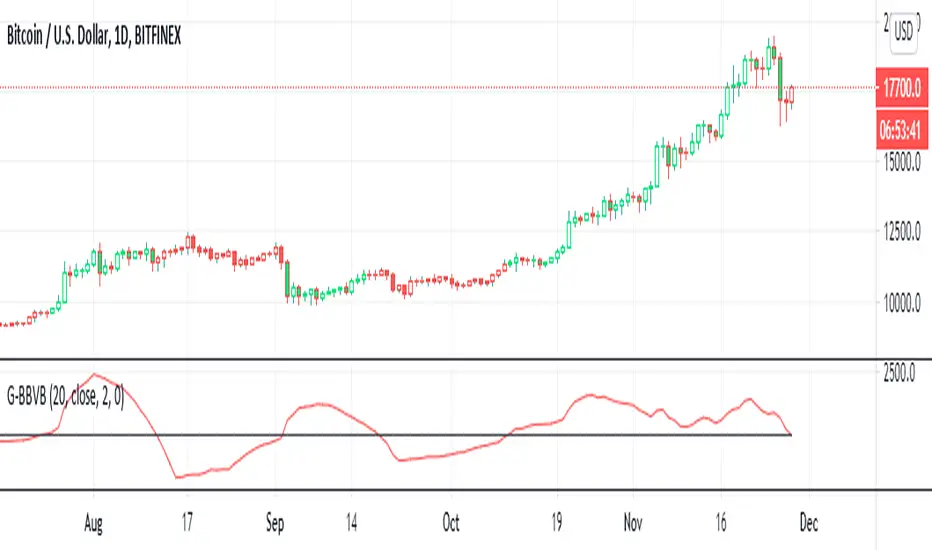
G-Bollinger bands volatility breakout v.1This is my frist publish scrpit. I developed this indicator origin is BB. It make from easy idea but powerful for sideway to breakout
1. I findout volatility by upper band of BB - lower band of BB (I called "Aline")
2. I created SMA of Aline (I called Bline)
3. I created the special line is "Cline" from Aline - Bline
4. I created 0 line " Baseline "
G-BBvB is the very good indicator to detect low volatility to begin the volatility = Buy signal
Now I can't find the sell signal form indicator. I try backtest sell at Cline cross zeroline but it not work.
I'll develop "G" indicator for free .
Goodluck :D