OPEN-SOURCE SCRIPT
Bitcoin: Mayer Multiple
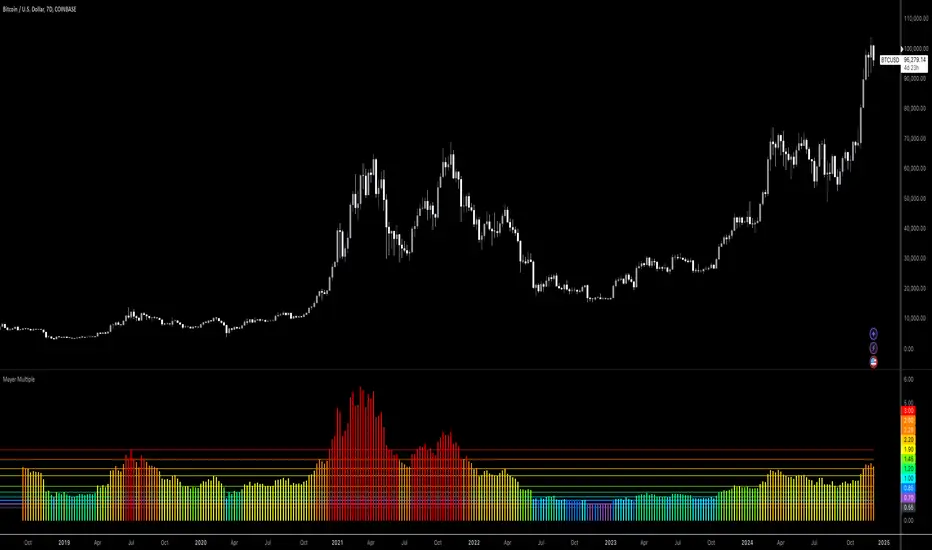
Mayer Multiple Indicator
The Mayer Multiple is a powerful tool designed to help traders assess market conditions and identify optimal buying or selling opportunities. It calculates the ratio between the current price and its 200-day simple moving average (SMA), visualizing key thresholds that indicate value zones, caution areas, and overheated markets.
Key Features:
Dynamic Market Zones: Clearly marked levels like "Smash Buy," "Boost DCA," and "Extreme Euphoria" to guide your trading decisions.
Customizable Input: Adjust the SMA length to fit your strategy.
Color-Coded Signals: Intuitive visualization of market sentiment for quick analysis.
Comprehensive Thresholds: Historical insights into price behavior with plotted reference levels based on probabilities.
This indicator is ideal for traders aiming to enhance their long-term strategies and improve decision-making in volatile markets. Use it to gain an edge in identifying potential turning points and managing risk effectively.
Açık kaynak kodlu komut dosyası
Gerçek TradingView ruhuyla, bu komut dosyasının mimarı, yatırımcıların işlevselliğini inceleyip doğrulayabilmesi için onu açık kaynaklı hale getirdi. Yazarı tebrik ederiz! Ücretsiz olarak kullanabilseniz de, kodu yeniden yayınlamanın Topluluk Kurallarımıza tabi olduğunu unutmayın.
Feragatname
Bilgiler ve yayınlar, TradingView tarafından sağlanan veya onaylanan finansal, yatırım, alım satım veya diğer türden tavsiye veya öneriler anlamına gelmez ve teşkil etmez. Kullanım Koşulları bölümünde daha fazlasını okuyun.